


Ripple Price Forecast: XRP mildly rebounds amid steady retail interest
- XRP bulls test recovery potential near $1.10 after holding support at $1.07.
- Retail demand remains steady, with perpetual futures Open Interest averaging 2.14 billion XRP.
- XRP’s technical indicators continue to signal weakness, with persistent declines in key moving averages exerting downward pressure on price action.
Ripple (XRP) exhibits a subtle rebound outlook, trading near $1.10 at the time of writing on Thursday. The headwinds in the crypto market are largely attributable to mounting investor uncertainty amid renewed tensions in the Middle East.
US and Iran exchange fire as tensions escalate
Geopolitical tensions escalated after the United States (US) military announced strikes on 90 targets along Iran’s coastline late Wednesday. In retaliation, Iran’s Revolutionary Guard launched attacks on US military bases in Kuwait and Bahrain.
Despite the attacks, Qatar’s Prime Minister urged both Iranian and US officials to pursue dialogue, according to Reuters.
XRP sees modest retail demand
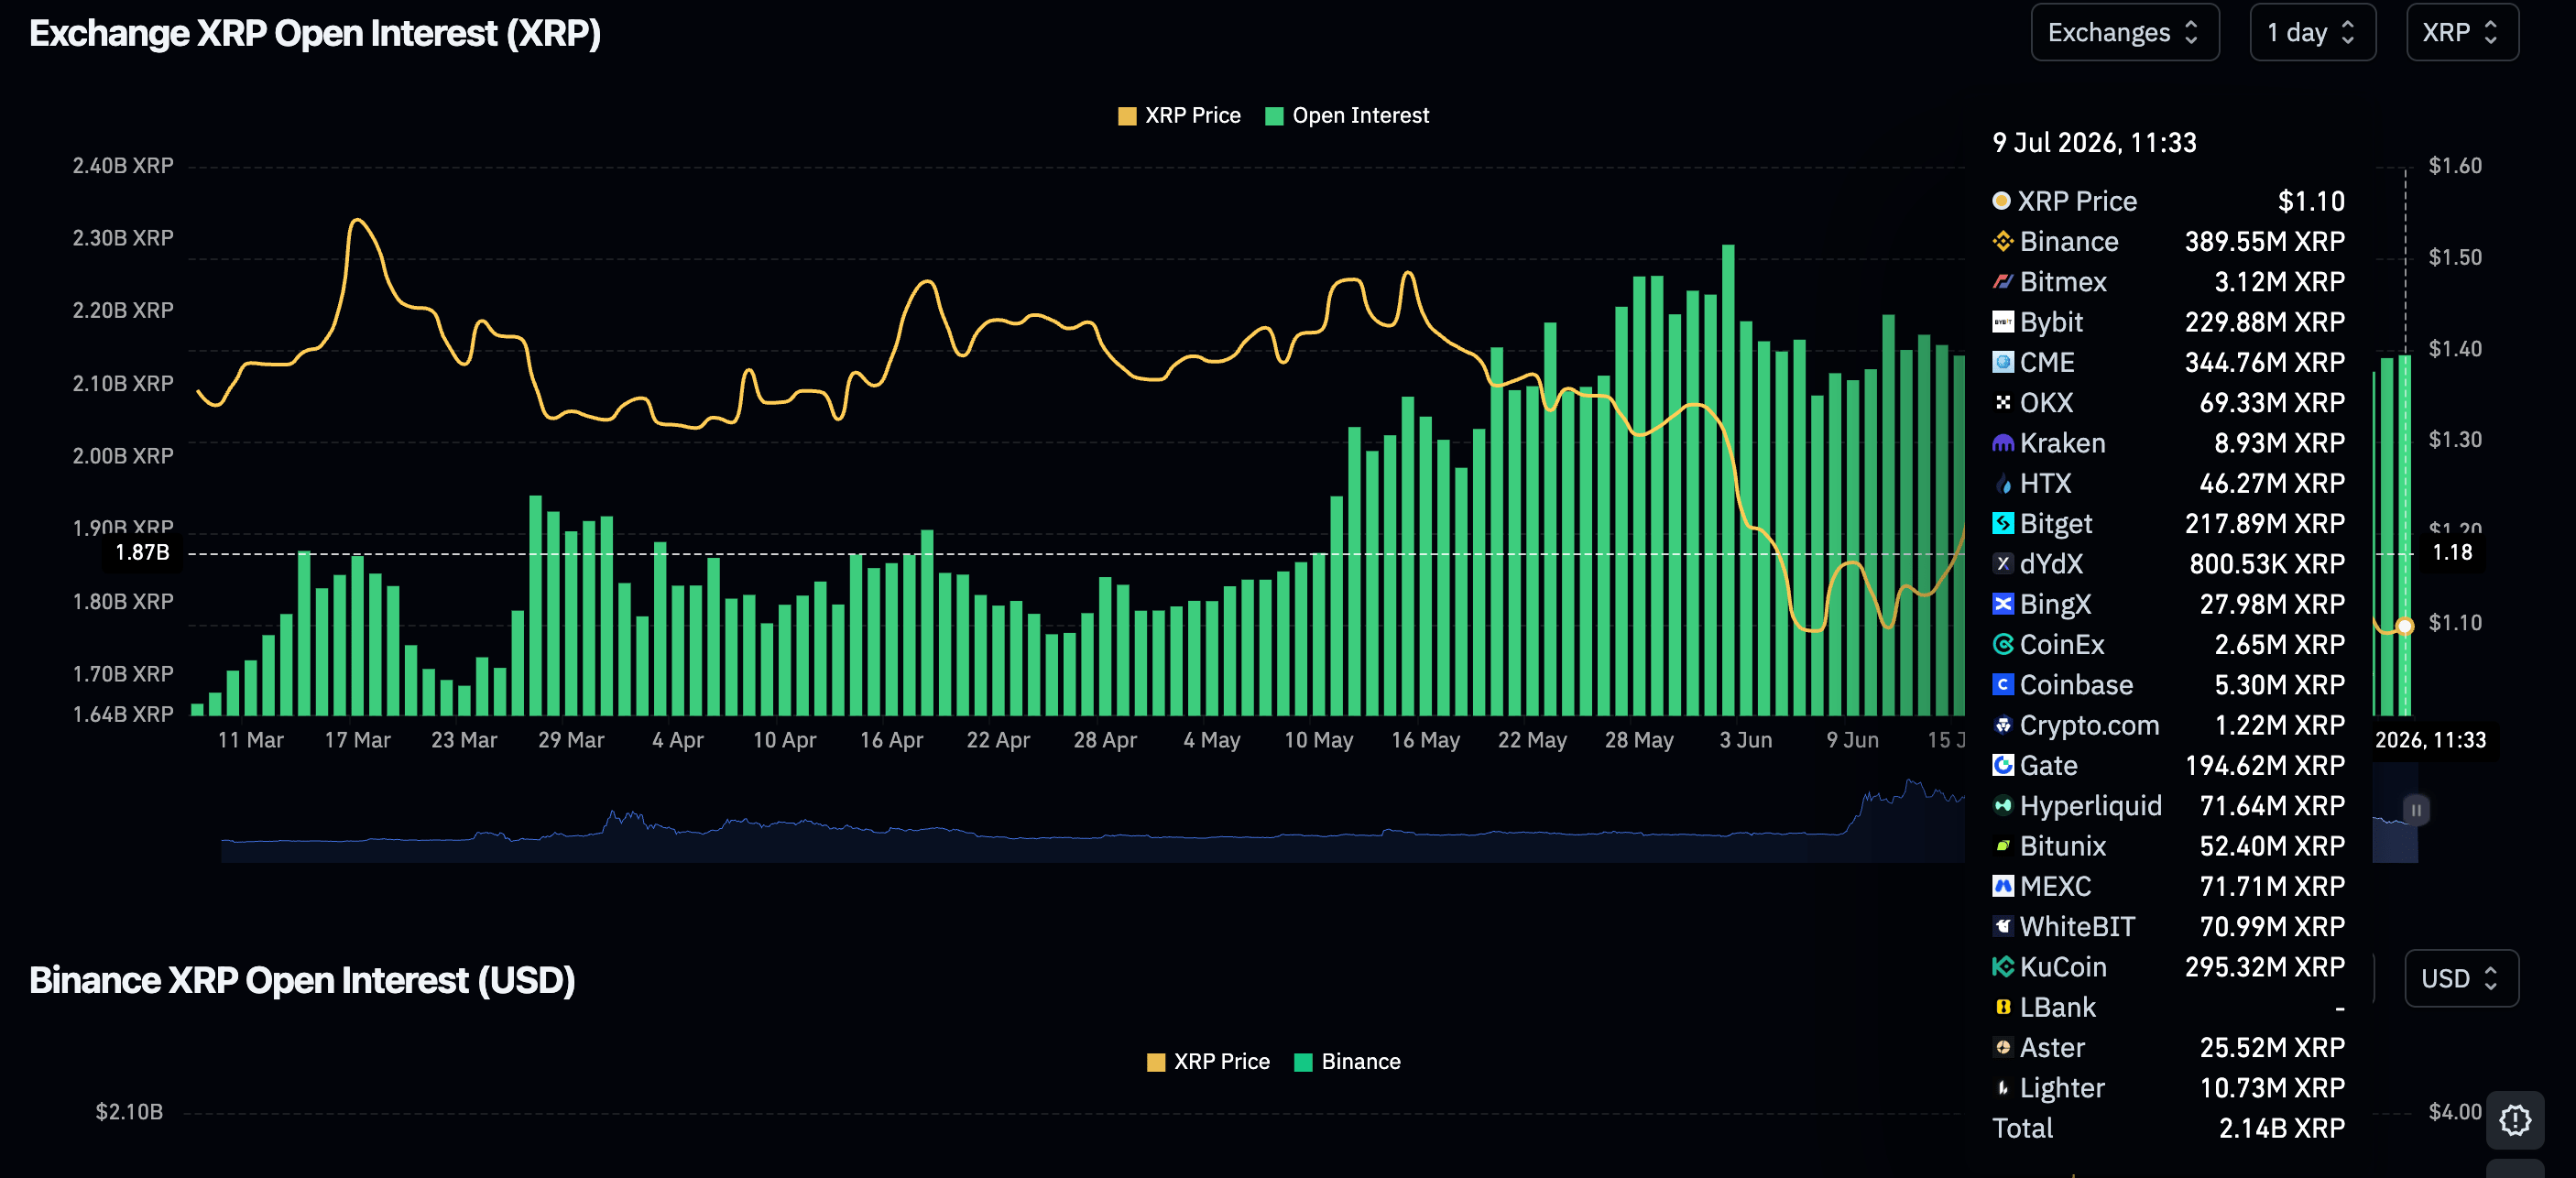
XRP continues to attract modest retail demand in the derivatives market. According to CoinGlass data, perpetual futures Open Interest (OI) holds steady around 2.14 billion XRP on Thursday. An expanded outlook shows that OI has risen from the 2.09 billion XRP recorded on Tuesday. If sustained, growing retail demand could back the ongoing rebound.
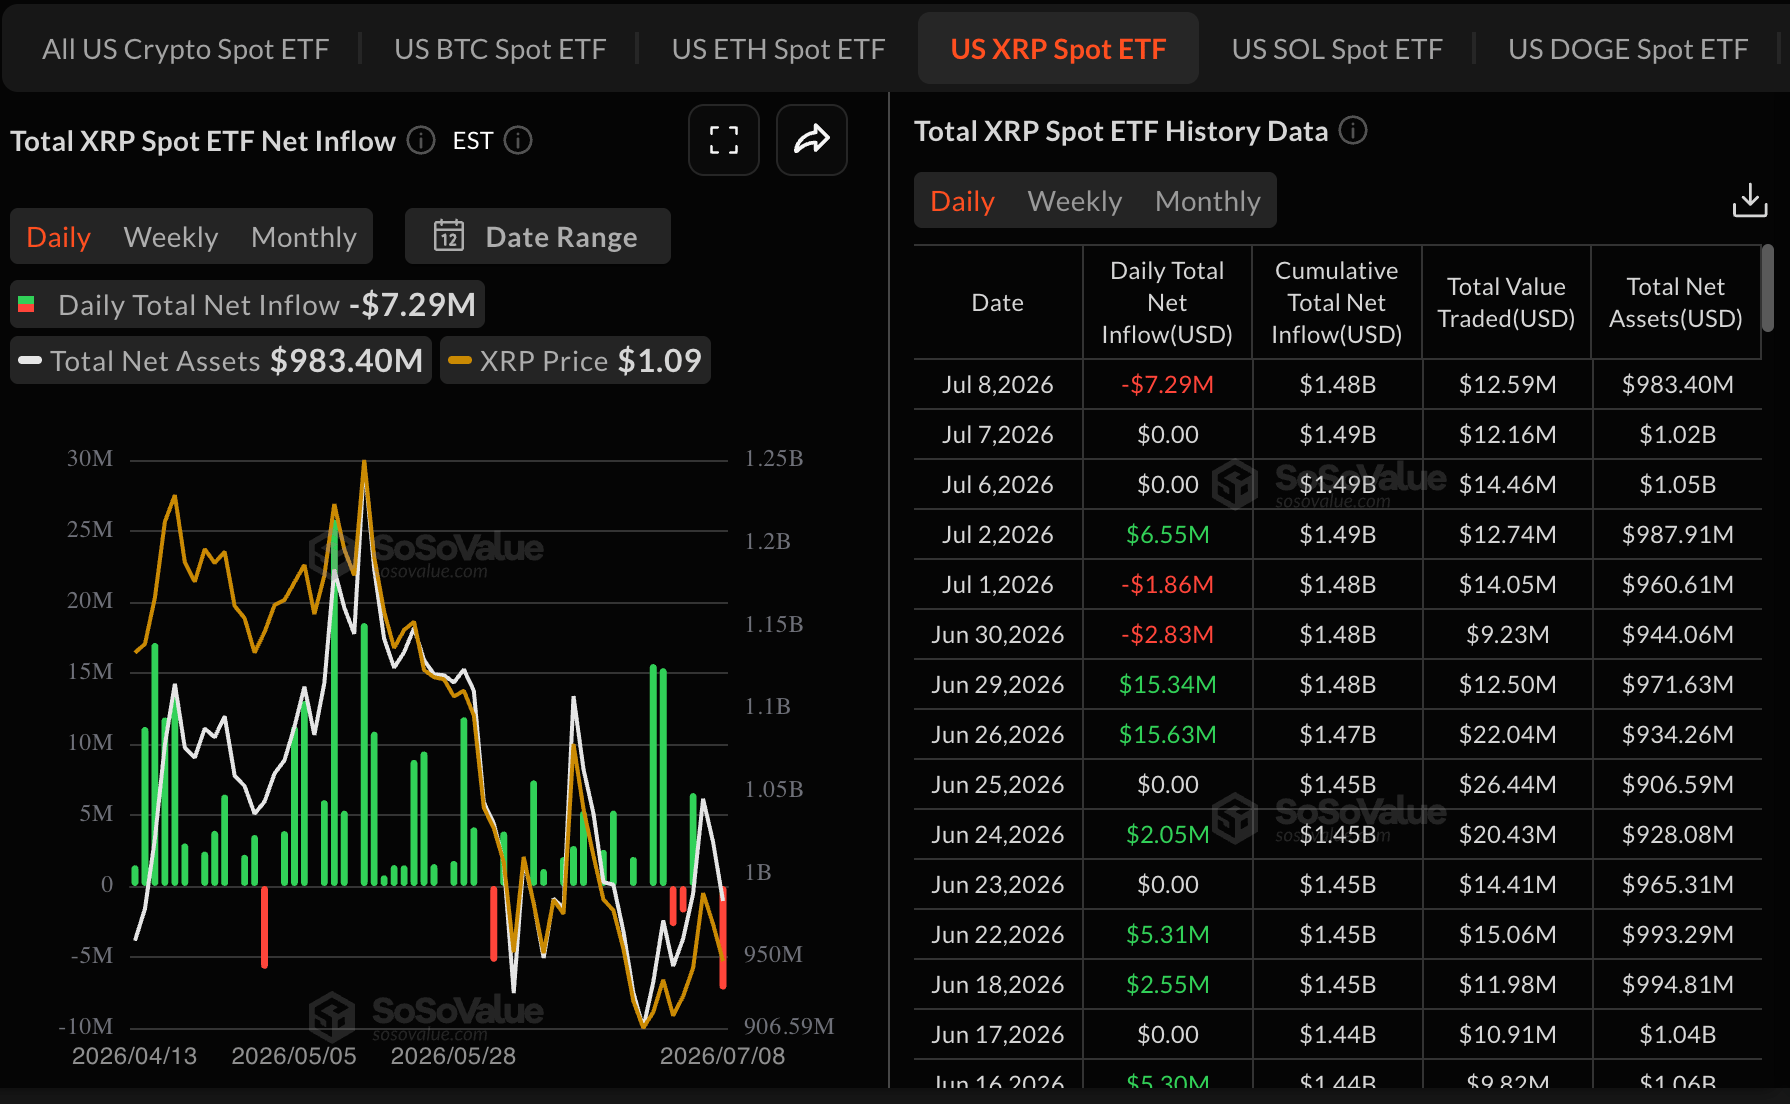
Nevertheless, institutional investors remain cautious, as reflected in XRP spot Exchange-Traded Funds (ETFs) outflows totaling roughly $7 billion on Wednesday, following muted activity on Tuesday and Monday.
Price analysis: XRP pares losses as bulls eye short-term recovery
XRP maintains a bearish near-term bias as the pair holds well below the 50-day, 100-day and 200-day Exponential Moving Averages (EMAs). The downward-sloping resistance trendline remains dominant, with its break price at $1.15 now acting as an immediate cap.
Momentum is relatively constructive but not decisive, as the Relative Strength Index (RSI) hovering near 45 stays below the midline on the daily chart while the Moving Average Convergence Divergence (MACD) histogram shows a positive outlook, hinting at a tentative recovery within a broader capped structure.
-1783590806114.png)
Initial resistance is seen at the descending trendline break level near $1.14, followed by the 50-day EMA at $1.17 as the next barrier. Above that, the 100-day EMA at $1.28 would be a stronger obstacle, while the 200-day EMA at $1.49 marks a major structural ceiling. With no clearly defined structural support levels on the daily chart, the pair remains vulnerable to further downside as long as it trades under this dense EMA stack. A key psychological area of interest for traders is the demand zone between $0.05 and $0.07.
(The technical analysis of this story was written with the help of an AI tool. Know more.)
Open Interest, funding rate FAQs
Higher Open Interest is associated with higher liquidity and new capital inflow to the market. This is considered the equivalent of increase in efficiency and the ongoing trend continues. When Open Interest decreases, it is considered a sign of liquidation in the market, investors are leaving and the overall demand for an asset is on a decline, fueling a bearish sentiment among investors.
Funding fees bridge the difference between spot prices and prices of futures contracts of an asset by increasing liquidation risks faced by traders. A consistently high and positive funding rate implies there is a bullish sentiment among market participants and there is an expectation of a price hike. A consistently negative funding rate for an asset implies a bearish sentiment, indicating that traders expect the cryptocurrency’s price to fall and a bearish trend reversal is likely to occur.
บทความแนะนำ


