Litecoin Price Forecast: LTC rally extends with bulls eyeing $130

แหล่งที่มา Fxstreet
  • Litecoin price extends its gains on Thursday after rallying more than 10% so far this week.
  • On-chain and derivatives data indicate a bullish outlook, as trading volume and open interest for LTC are on the rise.
  • The technical outlook suggests a rally continuation, with bulls targeting $130. 

Litecoin (LTC) price continues to climb, trading above $118 on Thursday, extending gains of over 10% so far this week. The bullish momentum is further supported by rising Open Interest (OI) and trading volume in the LTC token. Meanwhile, technical analysis suggests an upward leg targeting levels above $130.

On-chain data and derivatives show bullish bias for LTC

CoinGlass’s data show that the futures’ OI in Litecoin at exchanges rose from $797 million on Tuesday to $955 million on Thursday, the highest level since September 20. An increasing OI represents new or additional money entering the market and new buying, which could fuel the current Litecoin price rally.

Litecoin open interest chart. Source: Coinglass

Litecoin open interest chart. Source: Coinglass

Another aspect bolstering the platform’s bullish outlook is a recent surge in traders’ interest and liquidity in Litecoin. Santiment data shows that LTC’s trading volume rose from $286.70 million on Tuesday to $1.05 billion on Thursday, the highest since August 15.

LTC trading volume chart. Source: Santiment 

LTC trading volume chart. Source: Santiment 

Litecoin Price Forecast: LTC bulls aiming for $130 mark

Litecoin price found support around the 200-day Exponential Moving Average (EMA) at $103.61 on September 25 and rose 12.5% by Wednesday. This level roughly coincides with multiple support levels, such as the volume profile POC (Point of Control) is at $102.62, the price level with the highest traded volume since November 2024, the 50% retracement level is at $98.68, and the ascending trendline (drawn by connecting multiple lows since early April), making this a key support zone. At the time of writing on Thursday, LTC continues to trade higher above $118. 

If LTC continues its upward momentum, it could extend the rally toward the next resistance at $130.

The Relative Strength on the daily chart reads 61, above the neutral level of 50, indicating bullish momentum. The Moving Average Convergence Divergence (MACD) showed a bullish crossover on Wednesday, signaling a potential buy opportunity and indicating the possible start of an upward trend.
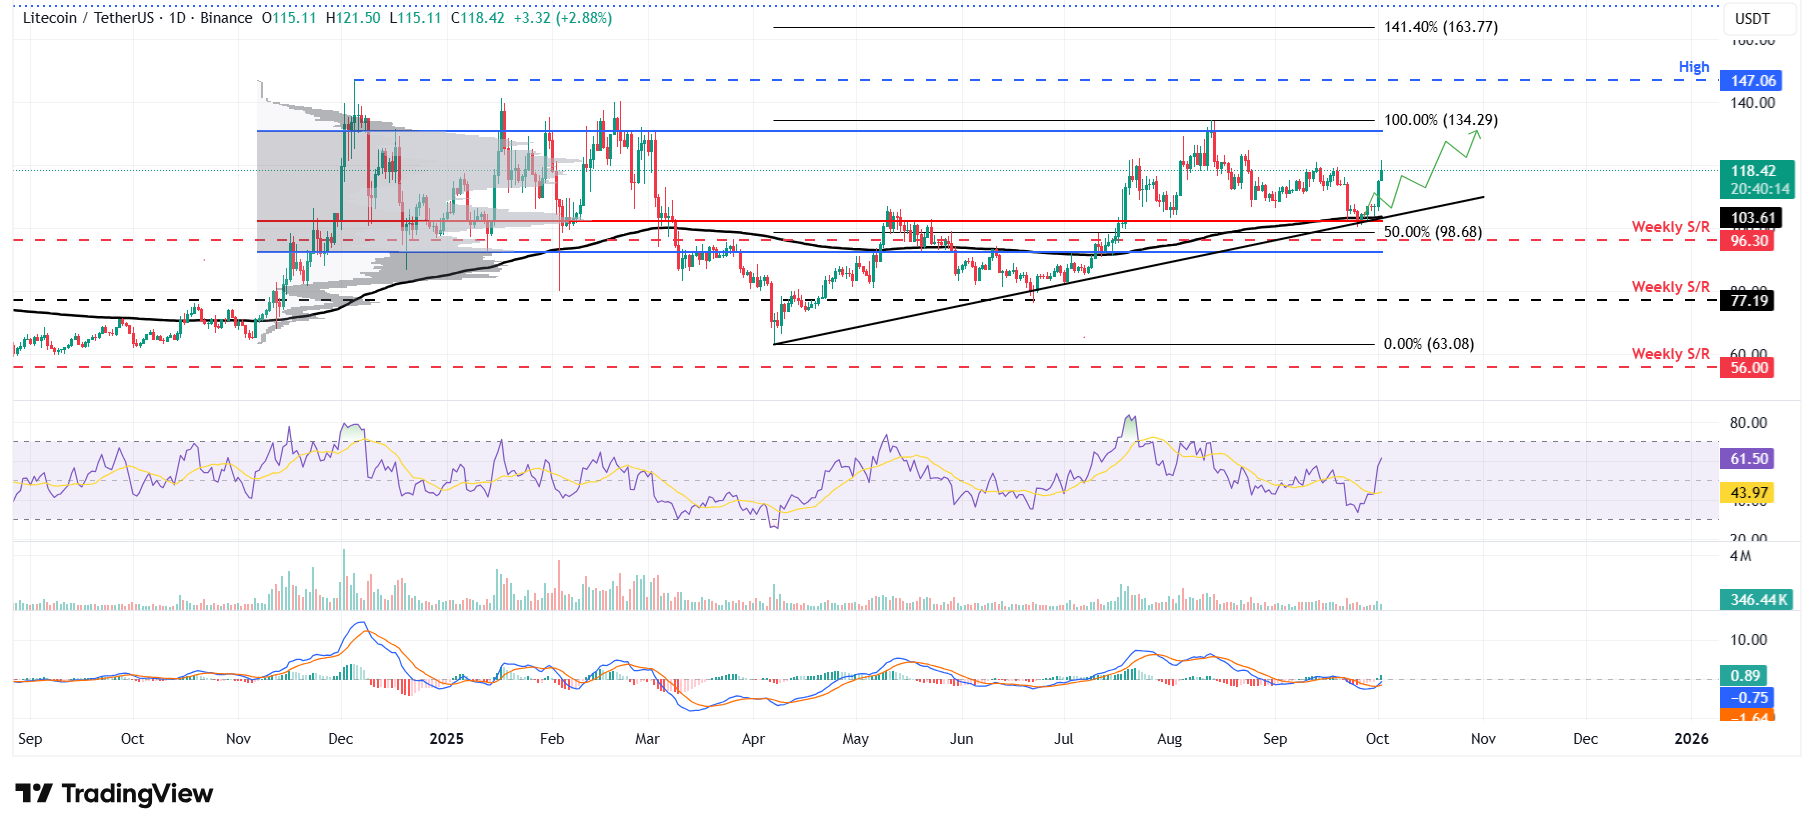
LTC/USDT daily chart

LTC/USDT daily chart

However, if LTC faces a correction, it could extend the decline toward the 200-day EMA at $103.61.

ข้อจำกัดความรับผิดชอบ: เพื่อการอ้างอิงเท่านั้น ผลการดำเนินงานในอดีตไม่ได้บ่งบอกถึงผลลัพธ์ในอนาคต
placeholder
หุ้นฟิวเจอร์สสหรัฐขยับขึ้นเล็กน้อย จับตาข้อมูลตลาดแรงงานหุ้นฟิวเจอร์สสหรัฐเปิดตลาดเพิ่มขึ้นเล็กน้อย โดย S&P 500 ฟิวเจอร์ส ขยับขึ้น 0.1% ขณะที่ Nasdaq 100 ฟิวเจอร์ส เพิ่มขึ้น 0.3%ดัชนียังคง ดาวโจนส์ ทรงตัวและ ดัชนีดอลลาร์สหรัฐ ก็ยังคงไม่เปลี่ยนแปลงเช่นกัน ใ
ผู้เขียน  Investing.com
วันที่ 03 ก.ย. 2024
หุ้นฟิวเจอร์สสหรัฐเปิดตลาดเพิ่มขึ้นเล็กน้อย โดย S&P 500 ฟิวเจอร์ส ขยับขึ้น 0.1% ขณะที่ Nasdaq 100 ฟิวเจอร์ส เพิ่มขึ้น 0.3%ดัชนียังคง ดาวโจนส์ ทรงตัวและ ดัชนีดอลลาร์สหรัฐ ก็ยังคงไม่เปลี่ยนแปลงเช่นกัน ใ
placeholder
การคาดการณ์ราคาน้ำมัน WTI: น้ำมันดิบท้าทาย SMA 50 วัน ขณะที่การคว่ำบาตรของสหรัฐฯ กระตุ้นขาขึ้นใหม่West Texas Intermediate (WTI) พุ่งขึ้นในวันพฤหัสบดี ขยายการปรับตัวขึ้นเป็นวันที่สามติดต่อกัน หลังจากที่สหรัฐฯ ได้กำหนดมาตรการลงโทษต่อบริษัทพลังงานขนาดใหญ่ของรัสเซีย Rosneft และ Lukoil ซึ่งกระตุ้นความกังวลเกี่ยวกับอุปทาน
ผู้เขียน  FXStreet
เมื่อวาน 02: 27
West Texas Intermediate (WTI) พุ่งขึ้นในวันพฤหัสบดี ขยายการปรับตัวขึ้นเป็นวันที่สามติดต่อกัน หลังจากที่สหรัฐฯ ได้กำหนดมาตรการลงโทษต่อบริษัทพลังงานขนาดใหญ่ของรัสเซีย Rosneft และ Lukoil ซึ่งกระตุ้นความกังวลเกี่ยวกับอุปทาน
placeholder
ทองคำปรับตัวลดลงจากความแข็งแกร่งของดอลลาร์สหรัฐ ข้อมูลเงินเฟ้อ CPI ของสหรัฐฯ กำลังจะมาถึงราคาทองคำ (XAU/USD) ขยับลดลงต่ำกว่า $4,150 ในช่วงเวลาการซื้อขายของเอเชียในวันศุกร์
ผู้เขียน  FXStreet
เมื่อวาน 05: 38
ราคาทองคำ (XAU/USD) ขยับลดลงต่ำกว่า $4,150 ในช่วงเวลาการซื้อขายของเอเชียในวันศุกร์
placeholder
USDJPY เริ่มมีโมเมนตัมก่อนการเปิดเผยข้อมูลอัตราเงินเฟ้อจากญี่ปุ่นและสหรัฐอเมริกาเงินเยนของญี่ปุ่น (JPY) ยังคงอ่อนค่าลงเมื่อเทียบกับดอลลาร์สหรัฐ (USD) ในวันพฤหัสบดี โดย USD/JPY ขยายการปรับตัวขึ้นเป็นวันที่ห้าติดต่อกัน
ผู้เขียน  FXStreet
เมื่อวาน 05: 57
เงินเยนของญี่ปุ่น (JPY) ยังคงอ่อนค่าลงเมื่อเทียบกับดอลลาร์สหรัฐ (USD) ในวันพฤหัสบดี โดย USD/JPY ขยายการปรับตัวขึ้นเป็นวันที่ห้าติดต่อกัน
placeholder
GBP/JPY ขยายการเพิ่มขึ้นใกล้ 204.00 หลังจากยอดค้าปลีกในสหราชอาณาจักรที่สดใสเงินปอนด์อังกฤษได้เร่งการขึ้นของแนวโน้มในวันศุกร์ โดยแตะระดับสูงสุดในรอบสองสัปดาห์ที่บริเวณ 203.90 ได้รับแรงหนุนจากการเพิ่มขึ้นที่ไม่คาดคิดของยอดค้าปลีกในสหราชอาณาจักรในเดือนกันยายน และกำลังมุ่งหน้าสู่การปิดสัปดาห์ด้วยการเพิ่มขึ้น 0.8% ซึ่งเป็นผลการดำเนินงานรายสัปดาห์ที่ดีที่สุดนับตั้งแต่เดือนกรกฎาคม
ผู้เขียน  FXStreet
เมื่อวาน 07: 50
เงินปอนด์อังกฤษได้เร่งการขึ้นของแนวโน้มในวันศุกร์ โดยแตะระดับสูงสุดในรอบสองสัปดาห์ที่บริเวณ 203.90 ได้รับแรงหนุนจากการเพิ่มขึ้นที่ไม่คาดคิดของยอดค้าปลีกในสหราชอาณาจักรในเดือนกันยายน และกำลังมุ่งหน้าสู่การปิดสัปดาห์ด้วยการเพิ่มขึ้น 0.8% ซึ่งเป็นผลการดำเนินงานรายสัปดาห์ที่ดีที่สุดนับตั้งแต่เดือนกรกฎาคม
ตราสารที่เกี่ยวข้อง
goTop
quote