

Polygon inflation ends, MATIC price primed for explosive growth?
- Polygon’s vesting contract released 273 million MATIC tokens on Wednesday.
- The unlock marks the end of inflation for holders, opening up unlimited upside potential for MATIC price.
- The lackluster performance of MATIC price thus far is likely to end, kick-starting an uptrend for Polygon.
Polygon’s Foundation contract shelled out the last remaining 273 million MATIC tokens on Wednesday, marking the end of the vesting period. This development means that there are no more tokens to unlock i.,e all of the MATIC tokens ever minted are now in circulation.
Also read: Polygon unveils AggLayer: A solution to long-standing Ethereum Layer 2 challenges
MATIC Unlock Ends Inflation Forever
According to Etherscan, Polygon’s vesting contract ended roughly 15 hours ago as it spits out the last 273 million MATIC tokens worth $253 million at the time of writing.
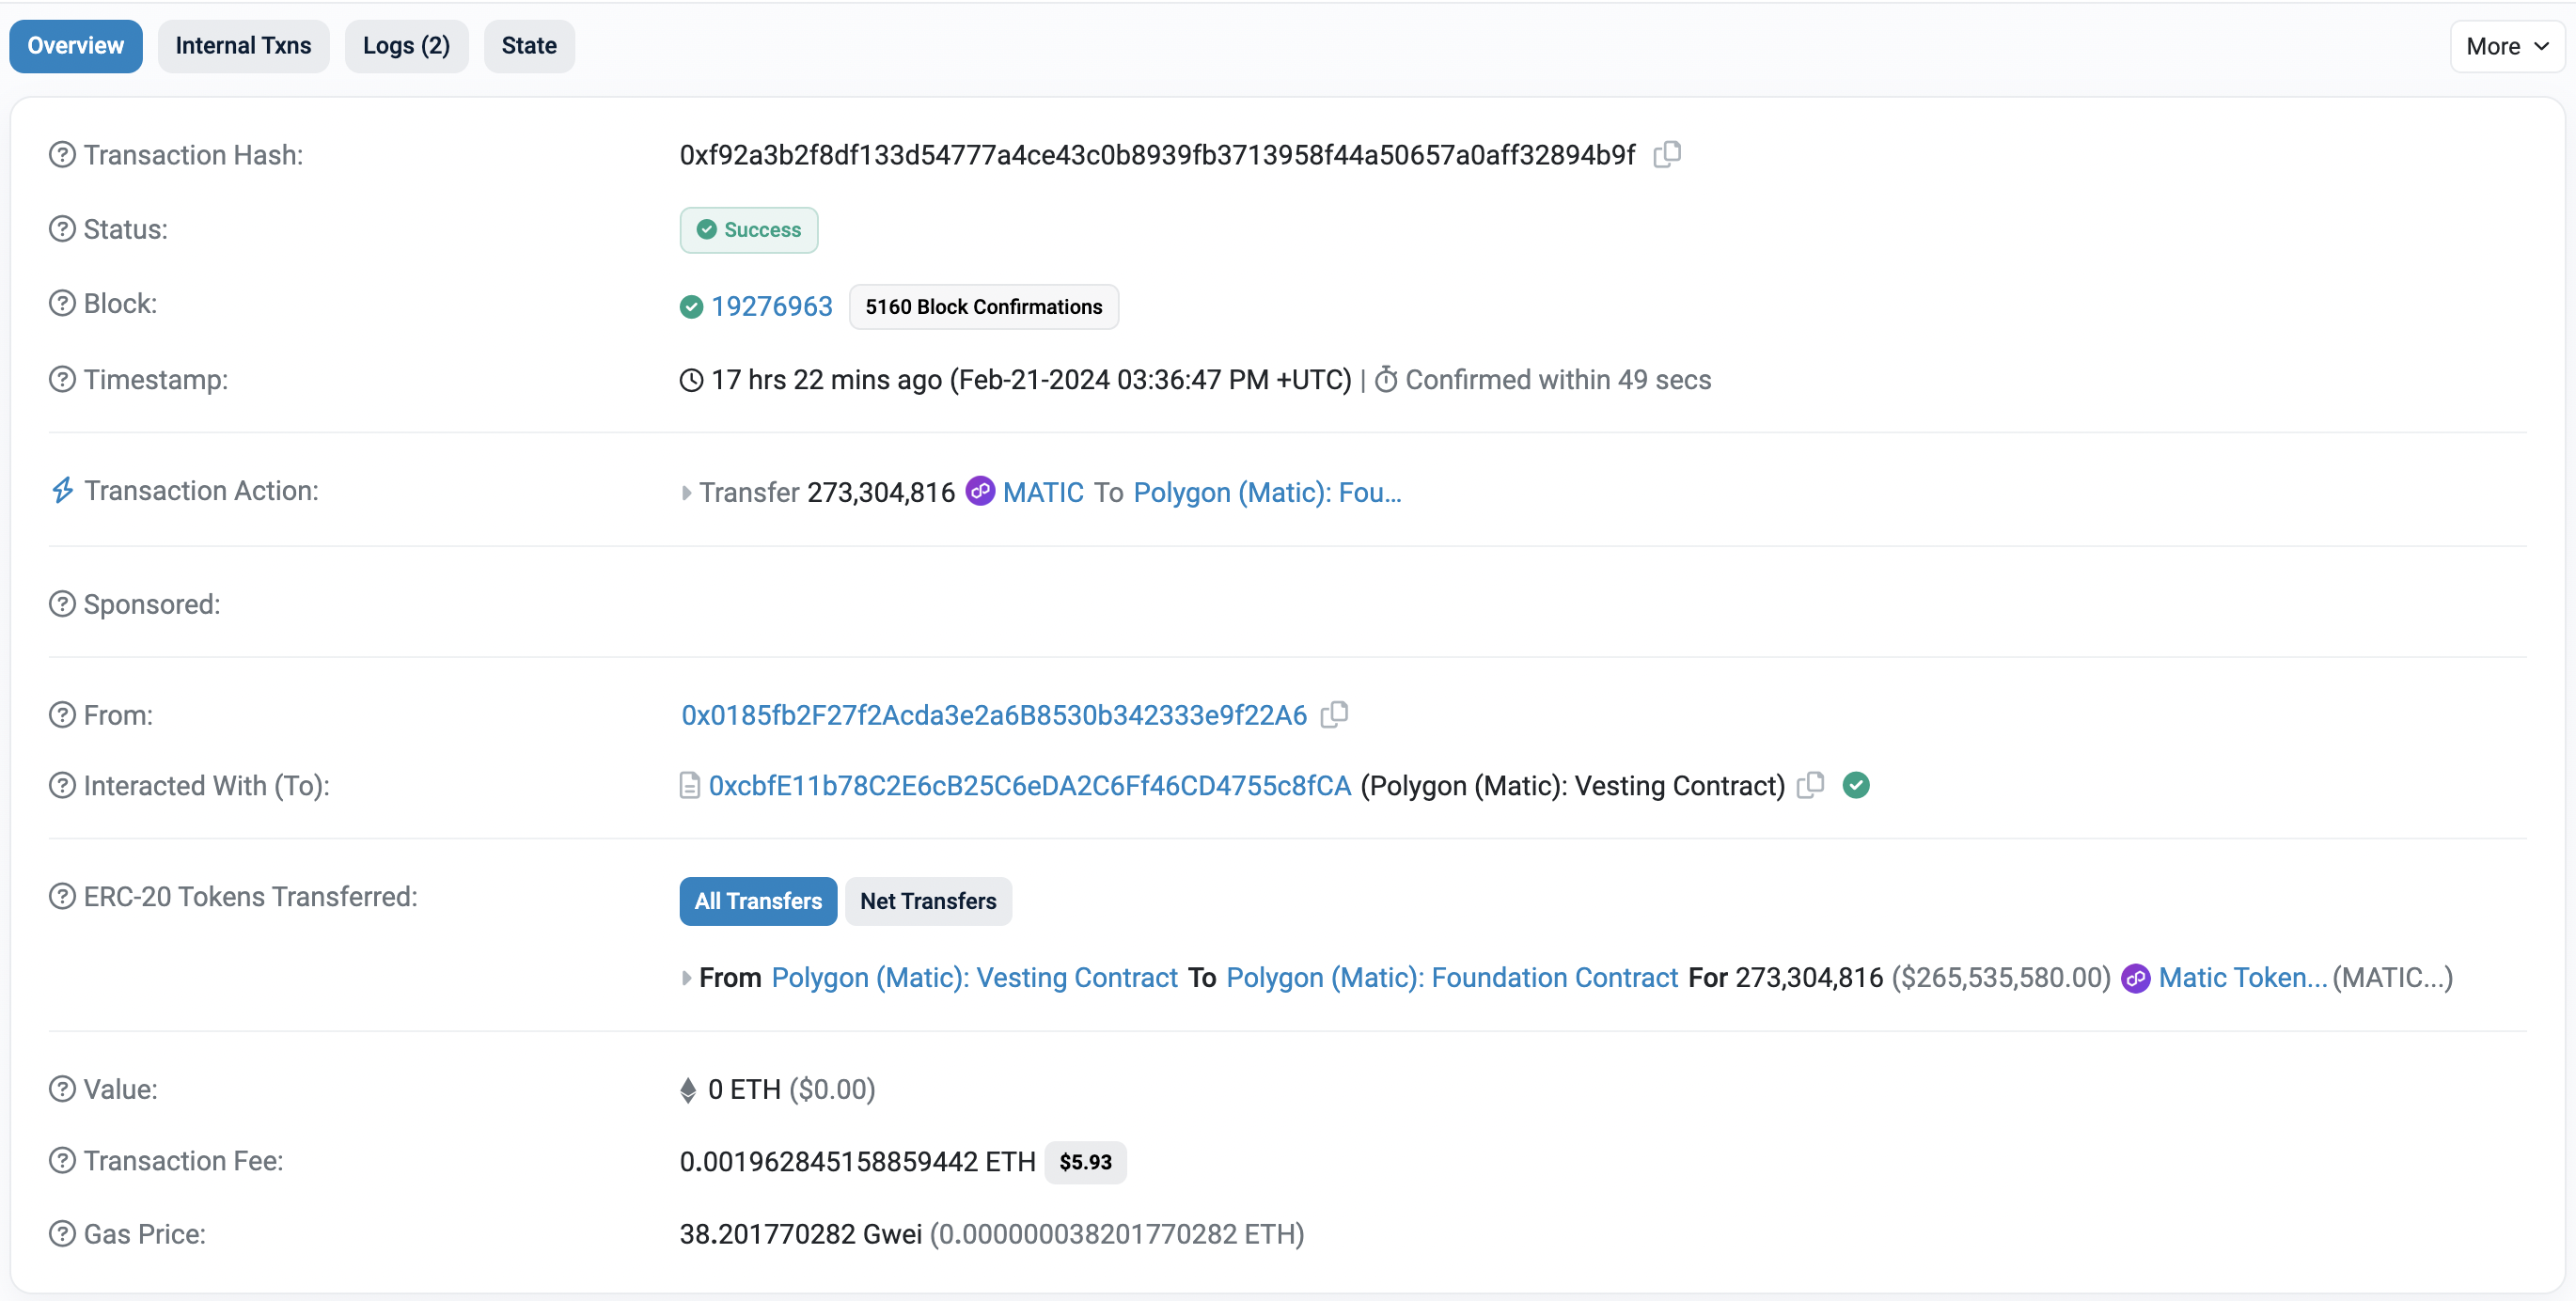
Etherscan: Polygon Vesting Contract Transaction Hash
Based on Coingecko data, MATIC is the 15th largest cryptocurrency by market capitalization and has 9.28 billion in circulating supply. Polygon price currently trades around $0.947, just above the $0.942 weekly support level. A bounce off this barrier could see a massive upswing in the near future for MATIC.
Also read: MATIC price maintains positive outlook, Humanity Protocol launches on Polygon CDK
Polygon price eyes near-30% rally
Polygon price has set up two critical lower highs in the last 700 days, but the swing lows are stabilizing, indicating a potential bottom formation and squeezing. As MATIC bounced off the $0.782 weekly barrier, it produced a three-day and weekly close above the immediate resistance level at $0.942. This bullish development could extend into a full-blown rally for MATIC if the $0.942 level holds.
In such a case, Polygon price could see a near-30% rally that retests the declining trendline connecting the aforementioned lower highs and the horizontal daily resistance level at $1.22.
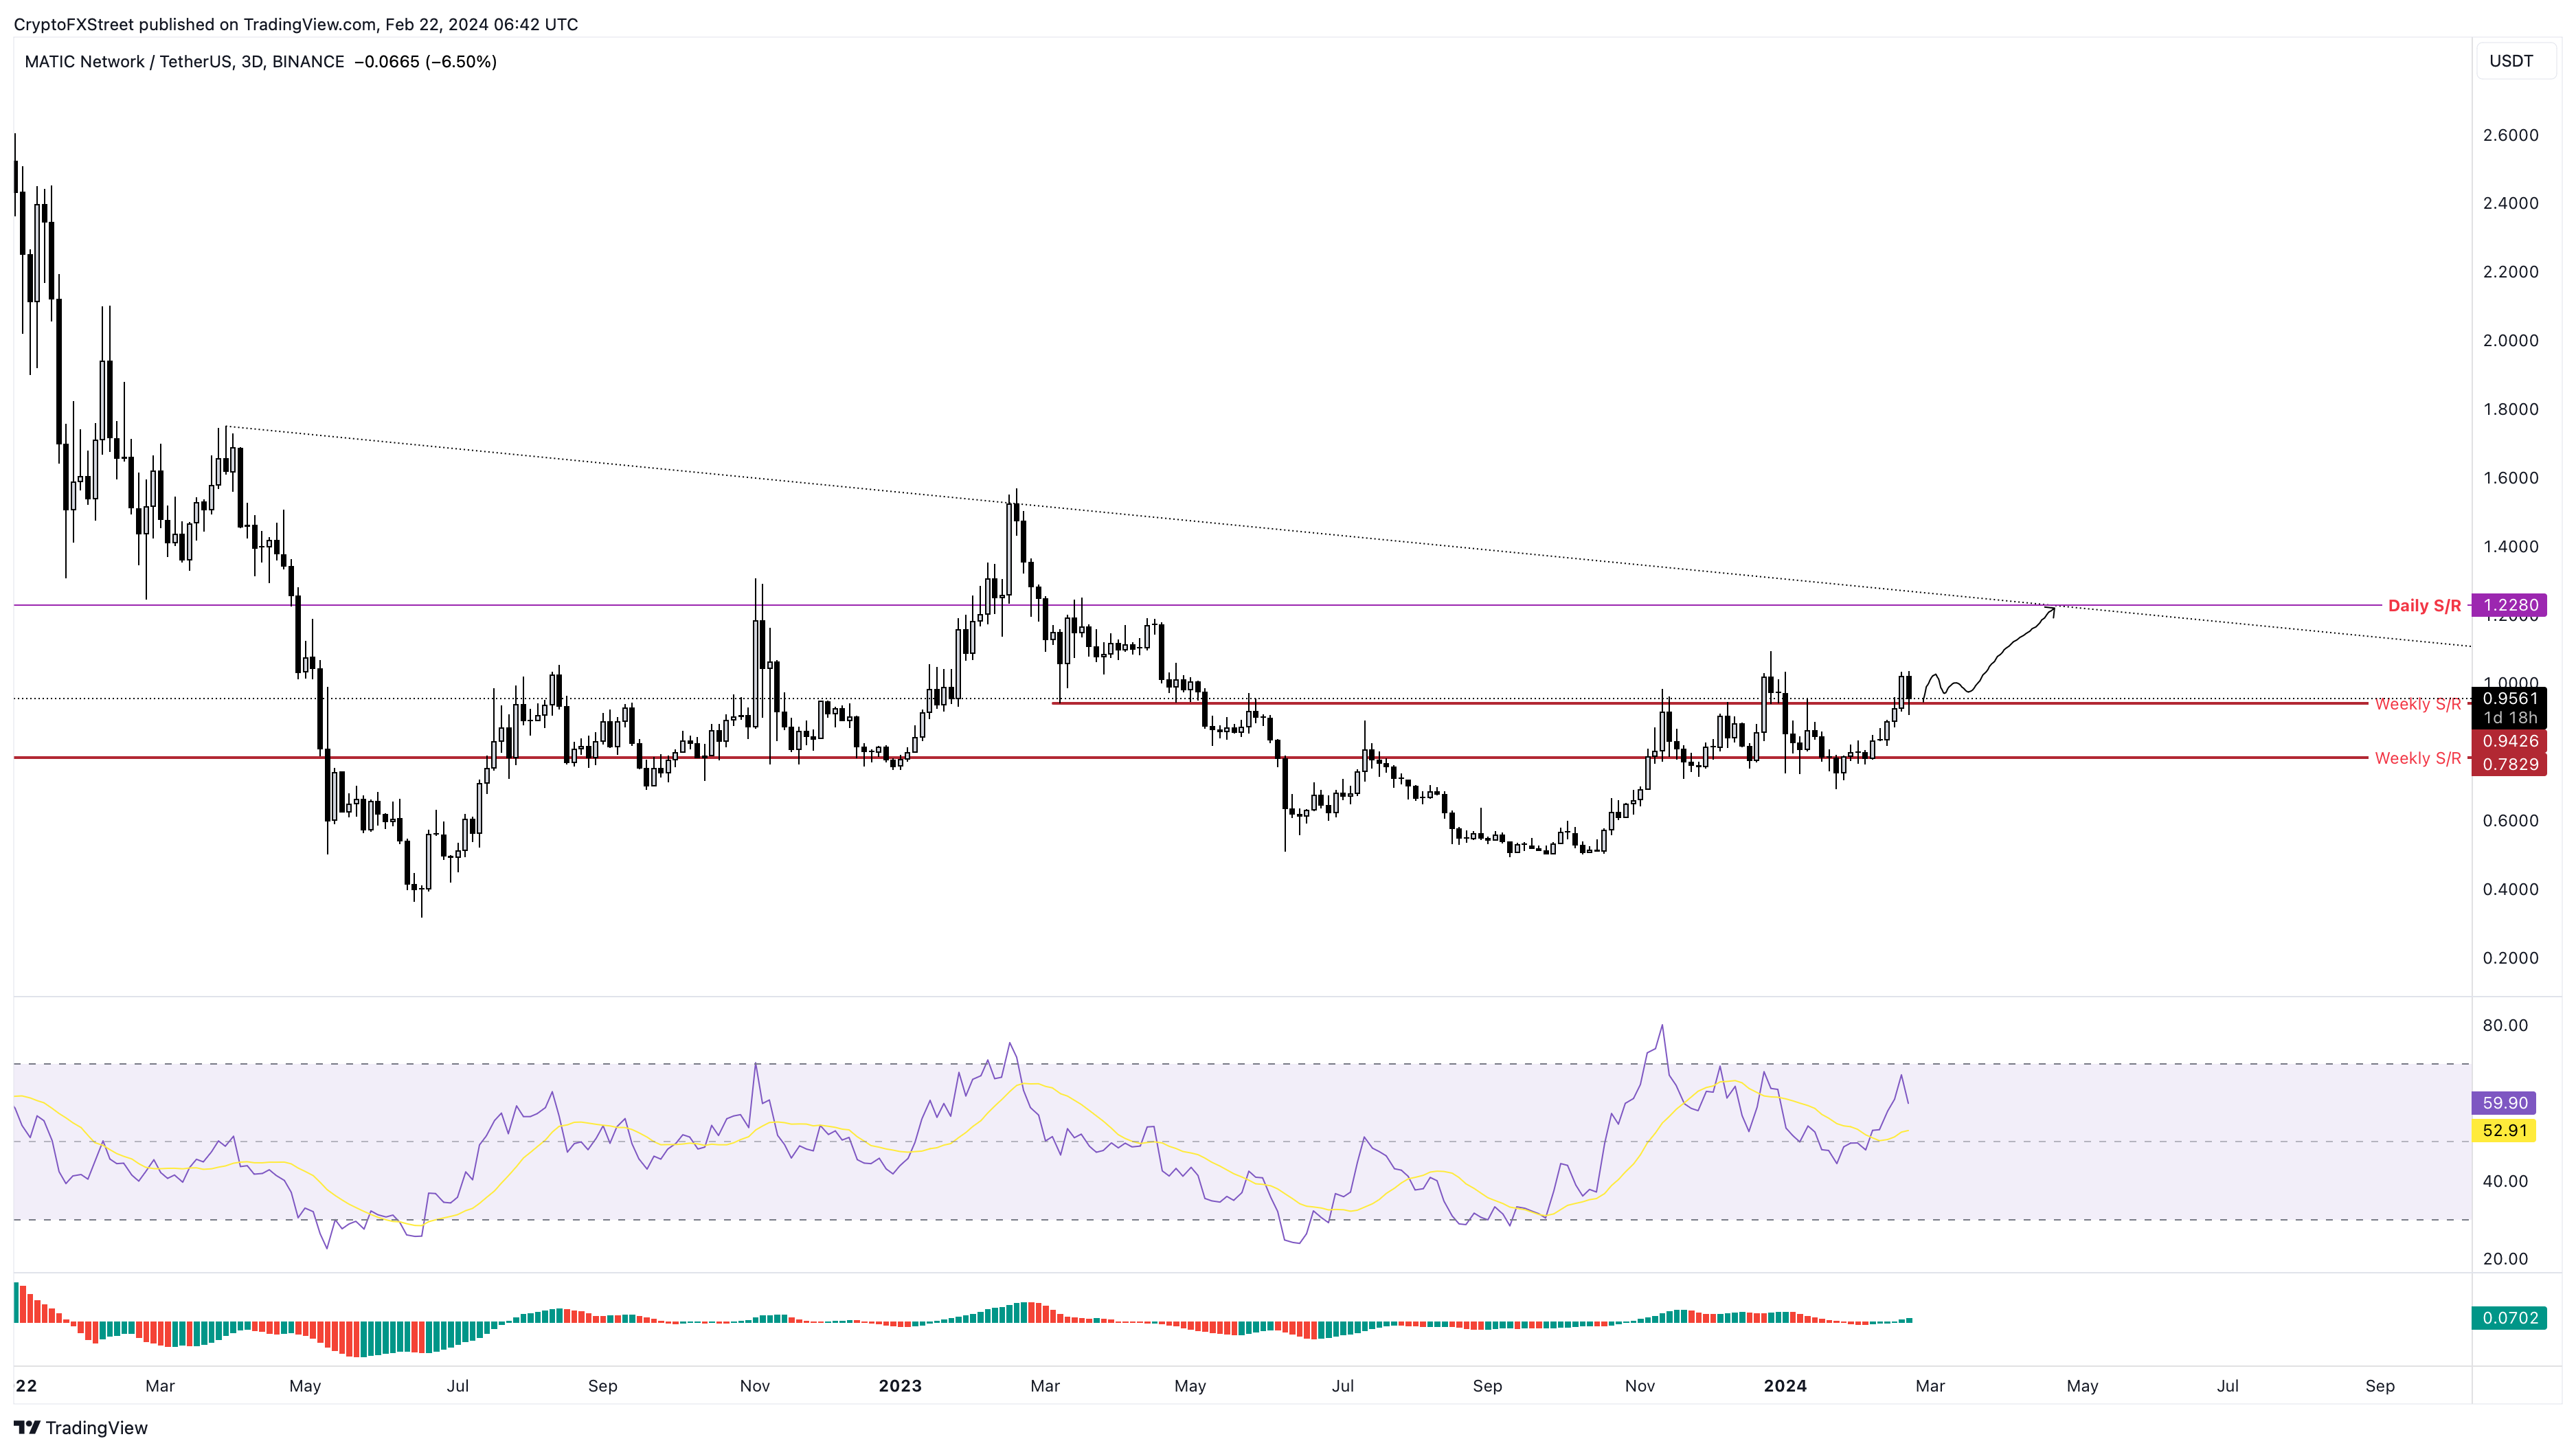
MATIC/USDT 3-day chart
On the other hand, a breakdown of $0.942 could send MATIC price crashing by 15% to $0.782. A decisive flip of this level will invalidate the bullish thesis and potentially trigger a 11% crash to sweep the January 22 swing low at $0.691.
Also read: Uniswap launches v2 on Arbitrum, Polygon, Optimism, Base, Binance Smart Chain and Avalanche
บทความแนะนำ


