COTI price Forecast: 30% rally possible after forming bullish technical pattern

แหล่งที่มา Fxstreet
  • COTI price action is about to break out after forming a bullish double-bottom formation.
  • On-chain data shows a positive trend as COTI’s open interest and daily active addresses are rising.
  • A daily candlestick close below $0.082 would invalidate the bullish thesis.


COTI (COTI), the native token from the privacy-centric layer on the Ethereum network, is approaching the breakout level of the double-bottom technical pattern formation on Friday. This pattern breakout signals a reversal favoring bulls, with the possibility of a 30% rally from the current price levels. This bullish projection is further supported by COTI’s rising open interest and daily active addresses. 


COTI looks set to extend recent rally

COTI price rose and closed at $0.102 in mid-August after bouncing off from $0.073. From early August to early September, it formed a W-like structure known as a double-bottom technical pattern, which often signals a potential trend reversal favoring the bulls. At the time of writing on Friday, it is nearing the breakout level of $0.101, also known as the neckline.

If COTI breaks decisively and closes above the $0.101 level, it could rally 29% to restest its July 27 high of $0.132. This level also broadly aligns with the height of the double-bottom pattern extrapolated higher. 

The Moving Average Convergence Divergence (MACD) indicator, which shows a bullish crossover on the daily chart, further supports this bullish outlook. Its MACD line (blue line) trades above the signal line (yellow line), suggesting that the bulls are buying. Additionally, it shows rising green histogram bars above its neutral line zero, indicating bullish momentum. 
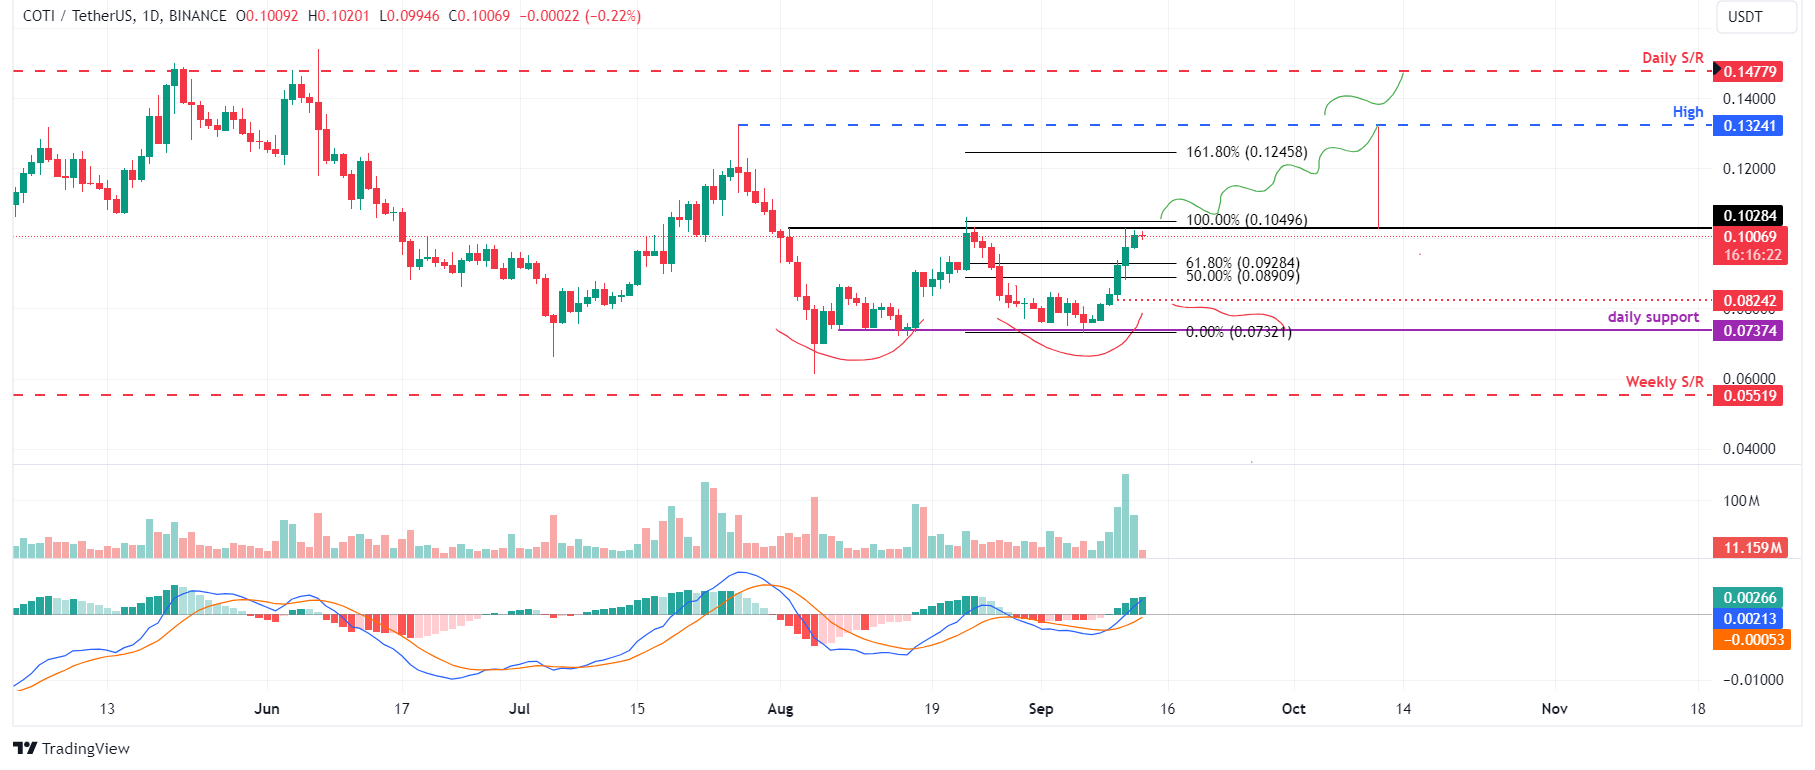
COTI/USDT daily chart

COTI/USDT daily chart

The on-chain data further supports the bullish outlook. Data from CoinGlass futures shows that Open Interest (OI) in COTI at exchanges is rising. The OI indicates the total number of outstanding derivative contracts that have not been settled (offset by delivery) and whether money flows into the contract are increasing or decreasing.

Increasing OI represents new or additional money entering the market and new buying, which suggests a bullish trend. When OI decreases, it is usually a sign that the market is liquidating, more investors are leaving, and the current price trend is ending.

The graph below shows that COTI’s OI increased from $10.31 million on Tuesday to $17.54 on Thursday, reaching the highest level since July 28. This indicates that new buying is occurring.

COTI Open Interest chart

COTI Open Interest chart

Santiment’s Daily Active Addresses metric, which tracks network activity over time, is positive too. A rise in the index signals greater blockchain usage while declining addresses point to lower demand for the network.

In COTI’s case, the index rose 23% from Monday to Wednesday and is at the highest since July 24, indicating that demand for COTI’s blockchain usage is increasing.

COTI Daily Active Addresses chart

COTI Daily Active Addresses chart

Despite the bullish outlook projected by the technical analysis and on-chain data, the outlook would turn bearish if COTI’s daily candlestick fails to break above the $0.102 level and closes below the September 10 low of $0.082. This development would lead to an 11% crash in COTI’s price to restest its daily support level at $0.073.

ข้อจำกัดความรับผิดชอบ: เพื่อการอ้างอิงเท่านั้น ผลการดำเนินงานในอดีตไม่ได้บ่งบอกถึงผลลัพธ์ในอนาคต
placeholder
AUDUSD ปรับตัวสูงขึ้นอยู่ที่ประมาณ 0.6550 ก่อนการประกาศนโยบายการเงินของ RBAในช่วงเซสชันการซื้อขายยุโรปวันจันทร์ คู่ AUDUSD เคลื่อนไหวสูงขึ้น 0.11% ที่บริเวณ 0.6555 คู่เงินออสซี่ปรับตัวขึ้นเนื่องจากดอลลาร์ออสเตรเลีย (AUD) ทำผลงานได้ดีกว่าสกุลเงินคู่แข่งก่อนการประกาศนโยบายการเงินของธนาคารกลางออสเตรเลีย (RBA) ในวันอังคาร
ผู้เขียน  FXStreet
11 เดือน 03 วัน จันทร์
ในช่วงเซสชันการซื้อขายยุโรปวันจันทร์ คู่ AUDUSD เคลื่อนไหวสูงขึ้น 0.11% ที่บริเวณ 0.6555 คู่เงินออสซี่ปรับตัวขึ้นเนื่องจากดอลลาร์ออสเตรเลีย (AUD) ทำผลงานได้ดีกว่าสกุลเงินคู่แข่งก่อนการประกาศนโยบายการเงินของธนาคารกลางออสเตรเลีย (RBA) ในวันอังคาร
placeholder
EUR/USD ปรับตัวลดลงใกล้ 1.1550 ขณะที่การปิดรัฐบาลสหรัฐใกล้จะมีการแก้ไขEUR/USD ปรับตัวลดลงหลังจากการร่วงลงสามวันติดต่อกัน ราคาเคลื่อนไหวอยู่ที่ประมาณ 1.1550 ในช่วงตลาดลงทุนเอเชียวันจันทร์ คู่เงินนี้ร่วงลงเนื่องจากสกุลเงินดอลลาร์สหรัฐ (USD) ได้รับแรงหนุนหลังจากที่ Bloomberg รายงานว่าการปิดรัฐบาลสหรัฐฯ ที่ทำลายสถิติใกล้จะสิ้นสุดลง
ผู้เขียน  FXStreet
เมื่อวาน 06: 04
EUR/USD ปรับตัวลดลงหลังจากการร่วงลงสามวันติดต่อกัน ราคาเคลื่อนไหวอยู่ที่ประมาณ 1.1550 ในช่วงตลาดลงทุนเอเชียวันจันทร์ คู่เงินนี้ร่วงลงเนื่องจากสกุลเงินดอลลาร์สหรัฐ (USD) ได้รับแรงหนุนหลังจากที่ Bloomberg รายงานว่าการปิดรัฐบาลสหรัฐฯ ที่ทำลายสถิติใกล้จะสิ้นสุดลง
placeholder
GBP/USD ยังคงเคลื่อนไหวในกรอบขณะที่ความหวังในการปิดรัฐบาลสหรัฐและข้อมูลจาก BoE ส่งผลต่อความเชื่อมั่นGBPUSD ไซด์เวย์ในช่วงเซสชันอเมริกาเหนือในวันจันทร์ โดยยังคงทรงตัวอยู่ที่ประมาณ 1.3150 ท่ามกลางการคาดเดาที่เพิ่มขึ้นว่าการปิดหน่วยงานของรัฐบาลสหรัฐอาจสิ้นสุดลงในเร็ว ๆ นี้ ซึ่งเป็นแรงหนุนให้กับดอลลาร์สหรัฐ (USD) ที่ลดการขาดทุนบางส่วนในช่วงก่อนหน้านี้
ผู้เขียน  FXStreet
9 ชั่วโมงที่แล้ว
GBPUSD ไซด์เวย์ในช่วงเซสชันอเมริกาเหนือในวันจันทร์ โดยยังคงทรงตัวอยู่ที่ประมาณ 1.3150 ท่ามกลางการคาดเดาที่เพิ่มขึ้นว่าการปิดหน่วยงานของรัฐบาลสหรัฐอาจสิ้นสุดลงในเร็ว ๆ นี้ ซึ่งเป็นแรงหนุนให้กับดอลลาร์สหรัฐ (USD) ที่ลดการขาดทุนบางส่วนในช่วงก่อนหน้านี้
placeholder
คาดการณ์ XAUUSD: ราคาทองคำยังคงอยู่ในระดับบวกเหนือ $4,100 ขณะที่ความคาดหวังการลดดอกเบี้ยของเฟดเพิ่มขึ้นในช่วงเช้าของตลาดลงทุนเอเชียวันอังคาร ราคาทองคํา (XAUUSD) ยืนอยู่ในระดับบวกใกล้ $4,120 ทองคำปรับตัวสูงขึ้นหลังจากทำสถิติสูงสุดในรอบสองสัปดาห์ในเซสชันก่อนหน้า ท่ามกลางความเป็นไปได้ในการปรับลดอัตราดอกเบี้ยโดยธนาคารกลางสหรัฐฯ (เฟด) ในเดือนธันวาคม และค่าเงินดอลลาร์สหรัฐ (USD) ที่อ่อนค่าลง
ผู้เขียน  FXStreet
8 ชั่วโมงที่แล้ว
ในช่วงเช้าของตลาดลงทุนเอเชียวันอังคาร ราคาทองคํา (XAUUSD) ยืนอยู่ในระดับบวกใกล้ $4,120 ทองคำปรับตัวสูงขึ้นหลังจากทำสถิติสูงสุดในรอบสองสัปดาห์ในเซสชันก่อนหน้า ท่ามกลางความเป็นไปได้ในการปรับลดอัตราดอกเบี้ยโดยธนาคารกลางสหรัฐฯ (เฟด) ในเดือนธันวาคม และค่าเงินดอลลาร์สหรัฐ (USD) ที่อ่อนค่าลง
placeholder
WTI ปรับตัวลดลงต่ำกว่า $60.00 จากการแข็งค่าของดอลลาร์สหรัฐน้ำมันดิบเวสต์เทกซัสอินเตอร์มีเดียต (WTI) ซึ่งเป็นเกณฑ์มาตรฐานน้ำมันดิบของสหรัฐฯ ซื้อขายอยู่ที่ประมาณ 59.90 ดอลลาร์ในช่วงเช้าของตลาดลงทุนเอเชียวันอังคาร ราคาน้ำมัน WTI ปรับตัวลดลงท่ามกลางค่าเงินดอลลาร์สหรัฐ (USD) ที่แข็งค่าขึ้นและความกังวลเกี่ยวกับความต้องการพลังงานทั่วโลก
ผู้เขียน  FXStreet
4 ชั่วโมงที่แล้ว
น้ำมันดิบเวสต์เทกซัสอินเตอร์มีเดียต (WTI) ซึ่งเป็นเกณฑ์มาตรฐานน้ำมันดิบของสหรัฐฯ ซื้อขายอยู่ที่ประมาณ 59.90 ดอลลาร์ในช่วงเช้าของตลาดลงทุนเอเชียวันอังคาร ราคาน้ำมัน WTI ปรับตัวลดลงท่ามกลางค่าเงินดอลลาร์สหรัฐ (USD) ที่แข็งค่าขึ้นและความกังวลเกี่ยวกับความต้องการพลังงานทั่วโลก
goTop
quote