AAVE could see a massive rally if it completes key bullish move

แหล่งที่มา Fxstreet
  • AAVE's price is showing strength again after potentially washing away weak hands following price dips in mid-July and August 2.
  • On-chain metrics show long-term holders are unwilling to sell despite recent price rally.
  • AAVE could rally above its yearly high of $154.86 if it breaks above the horizontal line of an ascending triangle.
  • A daily candlestick close below the support around $84 will invalidate the bullish thesis.

AAVE is up more than 2% on Friday after seeing a slight correction from a rally earlier in the day. The move follows key on-chain metrics and an ascending triangle pattern, indicating AAVE's potential to see a massive rally in the coming days.

AAVE's on-chain metrics shows long-term holders anticipate higher price increase

The Realized Capitalization values each coin based on its last transacted price. AAVE's Realized Cap shows its capitulation event occurred on July 16, when investors sold off their tokens. This occurred after AAVE rallied nearly 40% between July 5 - 15.

After a brief correction, AAVE rallied until August 2, when the market dip saw most investors realizing profits and losses.

The recent price movements may have washed away weak hands as the 365-day Market Value to Realized Value (MVRV) Ratio shows most long-term holders are 17.5% in profits.

The 365-day Market Value to Realized Value (MVRV) Ratio measures the profits or losses of all coins purchased within the last year. An increase in this metric above 0 indicates LTHs are in profit and vice versa if it decreases.

AAVE MVRV (365d), Dormant Circulation (365d)

AAVE MVRV (365d), Dormant Circulation (365d)

Despite the recent price rise, AAVE's 365-day Dormant Circulation, which measures the movement of coins last transacted in the past year, is at low levels, indicating unwillingness from long-term holders to sell. This indicates anticipation of future price increases from this cohort.

AAVE is forming an ascending triangle

On the daily chart, AAVE seems to be forming an ascending triangle pattern after making a series of higher lows based on the rising trendline starting from July 5. The only outlier was the wider crypto market crash on August 5.
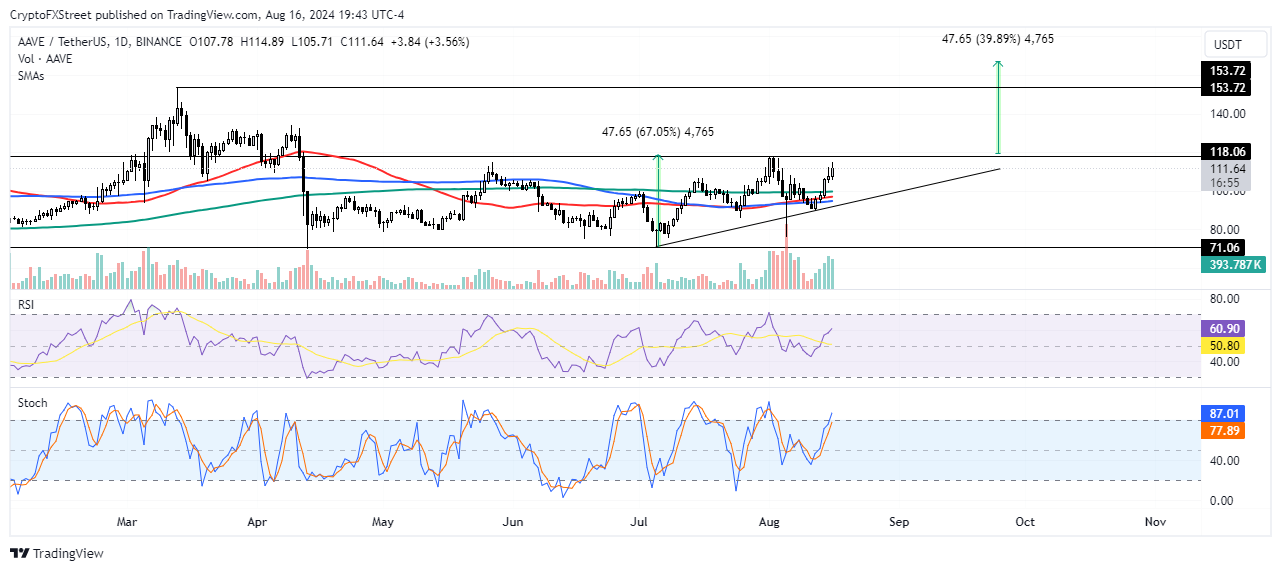
AAVE/USDT Daily chart

AAVE/USDT Daily chart

However, it has continued the move and is attempting to break out of the horizontal line resistance at $118.71. A successful move above this level could see AAVE rise above its yearly high resistance of $154.86 on March 13. AAVE could rise as high as $167.82 if it completes this move.

The Relative Strength Index (RSI) which has risen above its midpoint and its moving average could provide tailwinds for this move.

However, the Stochastic Oscillator is in the oversold region, indicating that AAVE could see a correction.

A daily candlestick close below the support around $84 will invalidate the bullish thesis.

ข้อจำกัดความรับผิดชอบ: เพื่อการอ้างอิงเท่านั้น ผลการดำเนินงานในอดีตไม่ได้บ่งบอกถึงผลลัพธ์ในอนาคต
placeholder
หุ้นฟิวเจอร์สสหรัฐขยับขึ้นเล็กน้อย จับตาข้อมูลตลาดแรงงานหุ้นฟิวเจอร์สสหรัฐเปิดตลาดเพิ่มขึ้นเล็กน้อย โดย S&P 500 ฟิวเจอร์ส ขยับขึ้น 0.1% ขณะที่ Nasdaq 100 ฟิวเจอร์ส เพิ่มขึ้น 0.3%ดัชนียังคง ดาวโจนส์ ทรงตัวและ ดัชนีดอลลาร์สหรัฐ ก็ยังคงไม่เปลี่ยนแปลงเช่นกัน ใ
ผู้เขียน  Investing.com
วันที่ 03 ก.ย. 2024
หุ้นฟิวเจอร์สสหรัฐเปิดตลาดเพิ่มขึ้นเล็กน้อย โดย S&P 500 ฟิวเจอร์ส ขยับขึ้น 0.1% ขณะที่ Nasdaq 100 ฟิวเจอร์ส เพิ่มขึ้น 0.3%ดัชนียังคง ดาวโจนส์ ทรงตัวและ ดัชนีดอลลาร์สหรัฐ ก็ยังคงไม่เปลี่ยนแปลงเช่นกัน ใ
placeholder
คาดการณ์ XAUUSD: ราคาทองคำยังคงอยู่ในระดับบวกเหนือ $4,100 ขณะที่ความคาดหวังการลดดอกเบี้ยของเฟดเพิ่มขึ้นในช่วงเช้าของตลาดลงทุนเอเชียวันอังคาร ราคาทองคํา (XAUUSD) ยืนอยู่ในระดับบวกใกล้ $4,120 ทองคำปรับตัวสูงขึ้นหลังจากทำสถิติสูงสุดในรอบสองสัปดาห์ในเซสชันก่อนหน้า ท่ามกลางความเป็นไปได้ในการปรับลดอัตราดอกเบี้ยโดยธนาคารกลางสหรัฐฯ (เฟด) ในเดือนธันวาคม และค่าเงินดอลลาร์สหรัฐ (USD) ที่อ่อนค่าลง
ผู้เขียน  FXStreet
เมื่อวาน 03: 04
ในช่วงเช้าของตลาดลงทุนเอเชียวันอังคาร ราคาทองคํา (XAUUSD) ยืนอยู่ในระดับบวกใกล้ $4,120 ทองคำปรับตัวสูงขึ้นหลังจากทำสถิติสูงสุดในรอบสองสัปดาห์ในเซสชันก่อนหน้า ท่ามกลางความเป็นไปได้ในการปรับลดอัตราดอกเบี้ยโดยธนาคารกลางสหรัฐฯ (เฟด) ในเดือนธันวาคม และค่าเงินดอลลาร์สหรัฐ (USD) ที่อ่อนค่าลง
placeholder
WTI ปรับตัวลดลงต่ำกว่า $60.00 จากการแข็งค่าของดอลลาร์สหรัฐน้ำมันดิบเวสต์เทกซัสอินเตอร์มีเดียต (WTI) ซึ่งเป็นเกณฑ์มาตรฐานน้ำมันดิบของสหรัฐฯ ซื้อขายอยู่ที่ประมาณ 59.90 ดอลลาร์ในช่วงเช้าของตลาดลงทุนเอเชียวันอังคาร ราคาน้ำมัน WTI ปรับตัวลดลงท่ามกลางค่าเงินดอลลาร์สหรัฐ (USD) ที่แข็งค่าขึ้นและความกังวลเกี่ยวกับความต้องการพลังงานทั่วโลก
ผู้เขียน  FXStreet
เมื่อวาน 06: 12
น้ำมันดิบเวสต์เทกซัสอินเตอร์มีเดียต (WTI) ซึ่งเป็นเกณฑ์มาตรฐานน้ำมันดิบของสหรัฐฯ ซื้อขายอยู่ที่ประมาณ 59.90 ดอลลาร์ในช่วงเช้าของตลาดลงทุนเอเชียวันอังคาร ราคาน้ำมัน WTI ปรับตัวลดลงท่ามกลางค่าเงินดอลลาร์สหรัฐ (USD) ที่แข็งค่าขึ้นและความกังวลเกี่ยวกับความต้องการพลังงานทั่วโลก
placeholder
สหรัฐฯ จ่อจบ Shutdown ตลาดหุ้น ทอง ดีดรับข่าว แต่คริปโตยังโดนกดดันหนักทันทุกกระแสการเงิน สรุปข่าวเด่น Forex หุ้น ทองคำ คริปโตฯ และเศรษฐกิจรอบวัน วิเคราะห์แนวโน้มตลาดด้วยข้อมูลเชิงลึก อ่านง่าย เข้าใจไว อัปเดตล่าสุดที่นี่
ผู้เขียน  Mitrade
9 ชั่วโมงที่แล้ว
ทันทุกกระแสการเงิน สรุปข่าวเด่น Forex หุ้น ทองคำ คริปโตฯ และเศรษฐกิจรอบวัน วิเคราะห์แนวโน้มตลาดด้วยข้อมูลเชิงลึก อ่านง่าย เข้าใจไว อัปเดตล่าสุดที่นี่
placeholder
SoftBank เทขายหุ้น Nvidia 5.8 พันล้านดอลล์ มุ่งสู่การลงทุนใน OpenAI อย่างเต็มตัวTradingKey - กำไรสุทธิของ SoftBank Group เพิ่มขึ้นกว่าเท่าตัวในไตรมาส 3 ปี 2568 โดยได้รับแรงหนุนจากผลตอบแทนมหาศาลจากการลงทุนใน OpenAI การเพิ่มขึ้นอย่างก้าวกระโดดนี้เกิดขึ้นหลังจากการตัดสินใจของกลุ่มบร
ผู้เขียน  TradingKey
8 ชั่วโมงที่แล้ว
TradingKey - กำไรสุทธิของ SoftBank Group เพิ่มขึ้นกว่าเท่าตัวในไตรมาส 3 ปี 2568 โดยได้รับแรงหนุนจากผลตอบแทนมหาศาลจากการลงทุนใน OpenAI การเพิ่มขึ้นอย่างก้าวกระโดดนี้เกิดขึ้นหลังจากการตัดสินใจของกลุ่มบร
ตราสารที่เกี่ยวข้อง
goTop
quote