


Bitcoin Weekly Forecast: Hormuz uncertainty clouds BTC outlook
- Bitcoin trades around $62,900 on Friday, down over 3% so far this week, but signs of stabilization are emerging.
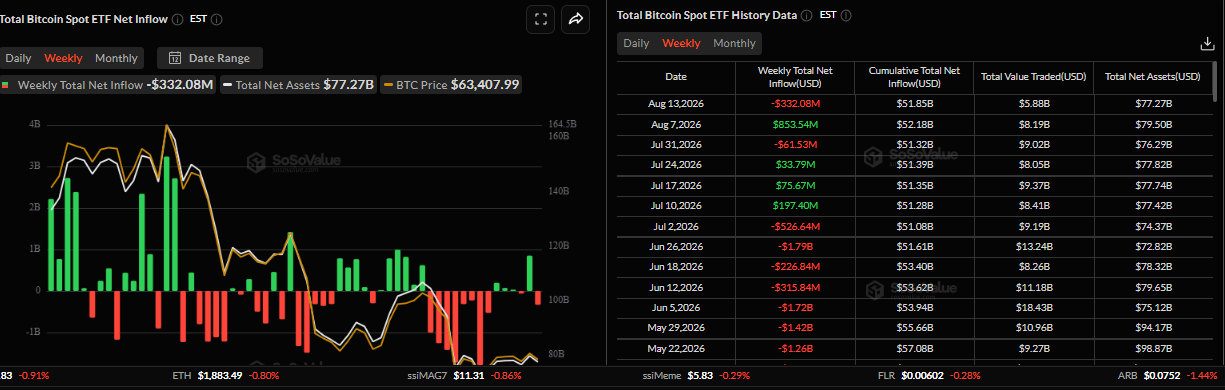
- US-listed BTC spot ETFs recorded $332.08 million in outflows through Thursday, signaling cautious institutional sentiment.
- Tensions in the Strait of Hormuz are keeping Oil prices and the war-risk premium elevated, supporting the US Dollar and weighing on BTC.
Bitcoin (BTC) trades around $62,900 at the time of writing on Friday, down over 3% so far this week amid cautious institutional demand and persistent geopolitical uncertainty. While BTC shows signs of stabilization, elevated Oil prices and tensions in the Strait of Hormuz continue to weigh on risk sentiment, keeping the Crypto King’s near-term outlook under pressure.
Middle East tension keeps BTC cap
The US-Iran standoff remains elevated, keeping risk sentiment capped so far this week. US Treasury Secretary Scott Bessent said on Thursday that the United States is going to apply measures that have "never been seen" on Iran.
“Watch this space for more announcements coming next week because we are going to apply measures like have never been seen in the history of economic isolation on a country," Bessent said in an interview reported by Reuters.
On the Iran side, a senior Islamic Revolutionary Guard Corps (IRGC) adviser, Mohammad Reza Naqdi, said that Tehran's strategy is to make any conflict so costly that future US administrations think twice before taking military action against Iran.
US President Donald Trump again claimed that the US has "total control" over the strategic waterway, while Iran pledged to keep the strait closed until all its demands are met. Moreover, the Iran-backed Houthis in Yemen escalated attacks on vessels in the Red Sea and Bab el-Mandeb Strait, and also claimed a drone strike on a Saudi Aramco refinery. This raises the risk of a broader regional conflict.
These developments are increasing uncertainty and tensions over the Strait of Hormuz, which keep the war-risk premium in play, support the US Dollar (USD), dampen risk appetite and weigh on BTC.
Institutional demand shows cautious signs
Institutional demand has failed to lift BTC price so far this week. SoSoValue data shows that spot BTC ETFs recorded an outflow of $332.02 million through Thursday. Depending on Friday's flows, Bitcoin could post weekly net withdrawals, indicating weakening institutional demand and cautious investor sentiment.
US inflation cools, but rising oil prices weigh on BTC
On the macroeconomic front, this week's US economic data showed signs of easing inflation, giving the Federal Reserve (Fed) more room to keep interest rates steady, which keeps US Dollar (USD) bulls on the defensive but failed to lift BTC prices.
The US Bureau of Labor Statistics reported on Wednesday that the headline US Consumer Price Index (CPI) eased in line with market expectations, to 3.4% YoY in July from 3.5% previously. Adding to this, the core CPI gauge, which excludes volatile food and energy prices, rose 0.2% and 2.5% on a monthly and yearly basis, respectively, matching consensus estimates. Later on Thursday, data showed that the US Producer Price Index (PPI) was unchanged in July, falling short of expectations for a 0.2% rise. Additionally, the yearly rate decelerated from 5.5% in June to 4.7%, also coming in below the 4.9% estimate.
Combined with last week’s weaker-than-expected Nonfarm Payrolls (NFP) report, the data gives the Fed more room to maintain its current policy rate unchanged in September. A less hawkish Fed could support risk-sensitive assets such as BTC by reducing pressure from higher interest rates and yields.
Adding to this, mixed comments from influential FOMC members forced traders to scale back expectations for an immediate policy tightening. Chicago Fed President Austan Goolsbee pointed out that recent price spikes are largely driven by temporary tariff and energy-related factors, favoring patience over aggressive monetary tightening. However, Cleveland Fed President Beth Hammack argued that progress on inflation remains insufficient and that further rate increases may be needed to secure price stability.
Despite the softer inflation data, Fed funds futures indicate just over a 65% probability of a rate hike by year-end, down from nearly 85% a week earlier. While the decline in rate-hike expectations could offer some relief, persistent geopolitical risks and higher Oil prices could support safe-haven demand for the USD and limit Bitcoin’s upside.
What's there in the second half of August for BTC?
In an exclusive interview with Simon-Peter Massabni, Head of Business Development at XS.com, FXStreet was told that Bitcoin is entering the second half of August in a critical phase of rebuilding momentum rather than starting a new downtrend. BTC has recently traded in a volatile $63,000–$65,000 range, repeatedly failing to break decisively above $65,000.
Despite pressure from rising bond yields and broader market uncertainty, Massabni noted that Bitcoin has shown resilience. “To me, this suggests that buyers have not abandoned the market; rather, they have become more selective, waiting for a stronger catalyst before committing to fresh positions.”
When asked why Bitcoin is correcting despite softer US inflation data? Massabni explained that markets had already priced in much of the improvement in the inflation outlook. The latest inflation reading broadly matched expectations and therefore failed to provide the upside surprise needed to trigger another wave of buying.
He added that investors have shifted their focus from the inflation figures themselves to whether the data will translate into more accommodative monetary policy and improved liquidity conditions. As a result, Bitcoin’s muted reaction does not necessarily indicate that the inflation data were negative; instead, it reflects elevated market expectations and the need for a stronger catalyst to drive further gains.
Looking ahead, Massabni remains cautiously bullish on Bitcoin. He expects BTC to finish August in the $68,000–$72,000 range, with a base-case target of around $70,000. However, he does not anticipate a straight-line rally, instead expecting continued volatility with a gradual recovery bias, provided BTC can reclaim $67,000. A break below $61,000–$62,000, he warned, would likely delay this bullish end-of-month scenario.
Bitcoin technical outlook: Signs of stabilization are emerging
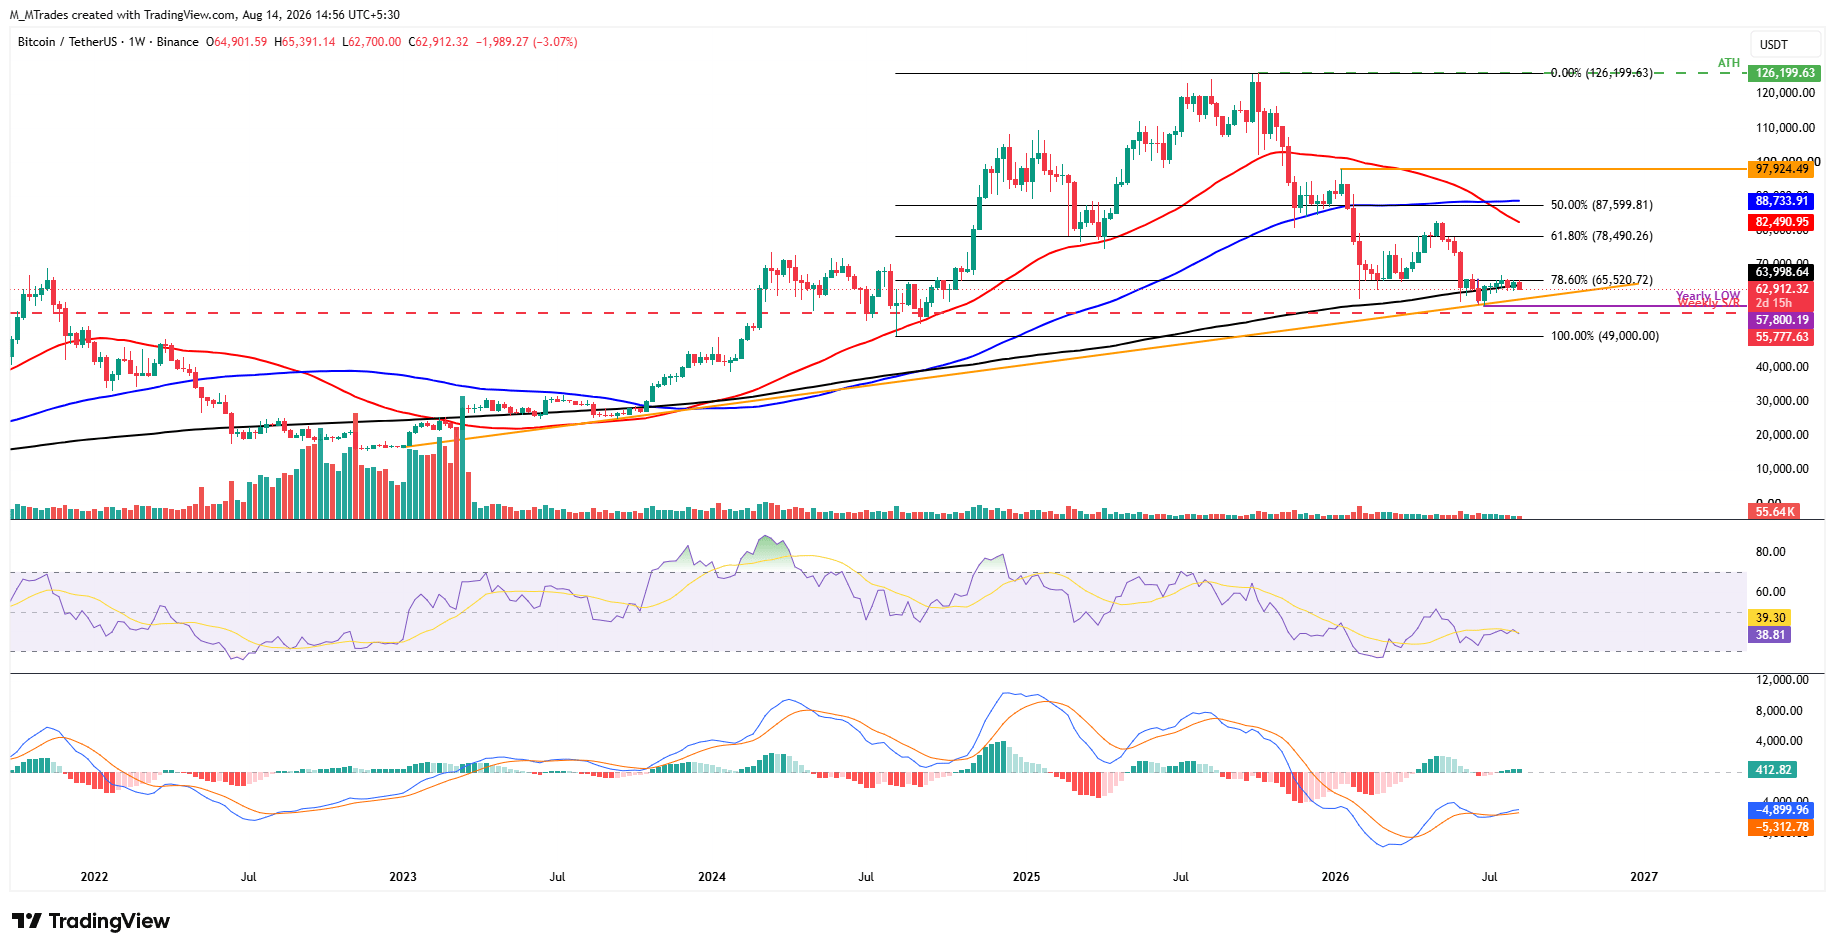
Bitcoin price has fallen slightly so far this week, trading around $62,912 at the time of writing on Friday after a mild recovery in the previous week. BTC has been consolidating between the 78.6% Fibonacci retracement level at $65,520 (drawn from the August 2024 low of $49,000 to the October 2025 record high of $126,199) and the 200-week Simple Moving Average (SMA) at $63,998 since mid-July.
If the Crypto King closes above the immediate resistance at the 78.6% Fibonacci retracement level at $65,520, then BTC could extend the recovery toward the 61.8% Fibonacci retracement level at $78,490.
Momentum indicators on the weekly chart show mild signs of easing bearish sentiment. The Relative Strength Index (RSI) is trending higher toward the neutral 50 level, with a reading of 38 on Friday. Meanwhile, the Moving Average Convergence Divergence (MACD) bullish crossover in mid-July remains intact, supporting a positive outlook.
However, if BTC fails to find support around the 200-week SMA at $63,998 and closes below it on a weekly basis, it could extend the losses toward the ascending trendline support, roughly around $60,000
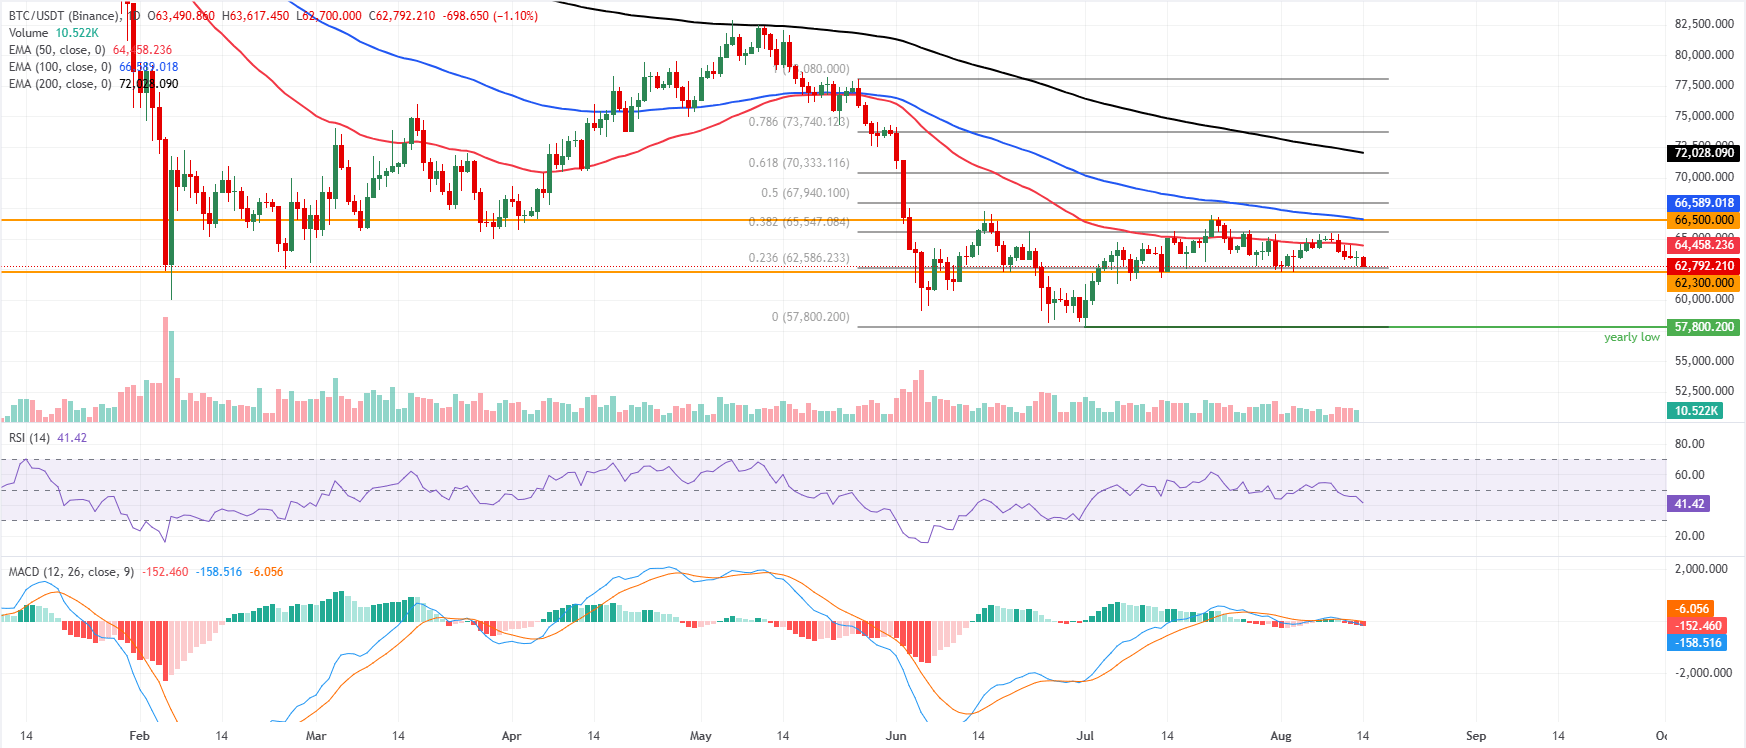
On the daily chart, BTC is holding a mild bearish bias as it remains below the key Exponential Moving Averages (EMAs). Moreover, the Crypto King has been in consolidation since mid-July, ranging between $62,300 and $66,500.
Momentum remains slightly weak on the daily chart, with the MACD histogram slightly negative and the RSI reading 41 on Friday. Both momentum indicators suggest sellers still control the near-term swings despite some stabilization around current levels.
On the downside, initial support is seen at the horizontal floor at $62,300, a break of which would extend losses toward the yearly low at $57,800 set on July 1.
On the topside, immediate resistance is seen at the 50-day EMA at $64,458, followed by the 100-day EMA at $66,589, which roughly coincides with the horizontal resistance at $66,500. As long as BTC trades below the 50-day EMA and the $66,500–$66,589 zone, rallies are likely to be sold, with bears retaining control unless daily closes reclaim the 50-day EMA and then the 100-day EMA, easing the current pressure.
(The technical analysis of this story was written with the help of an AI tool. Know more.)
บทความแนะนำ


