Solana Price Forecast: SOL risks a steeper decline below $70 despite steady ETF inflows

แหล่งที่มา Fxstreet
  • Solana edges lower on Monday, facing downside pressure with the price capped below its 50-day EMA at $75.68.
  • Institutional demand shows resilience with five consecutive weekly inflows totaling $14.62 million in July.
  • Retail demand eases as trading volume declines and the funding rate turns negative. 

Solana (SOL) is trading in the red on Monday, losing bullish momentum and remaining capped below its 50-day Exponential Moving Average (EMA) at $75.68. SOL-focused Exchange Traded Funds (ETFs) show resilience with a monthly inflow of $14.62 million in July, while the near-term retail support wanes with the funding rate turning negative. The technical outlook for SOL is mildly bearish as downside momentum gains traction. 

Solana loses retail strength despite resilient ETF inflows

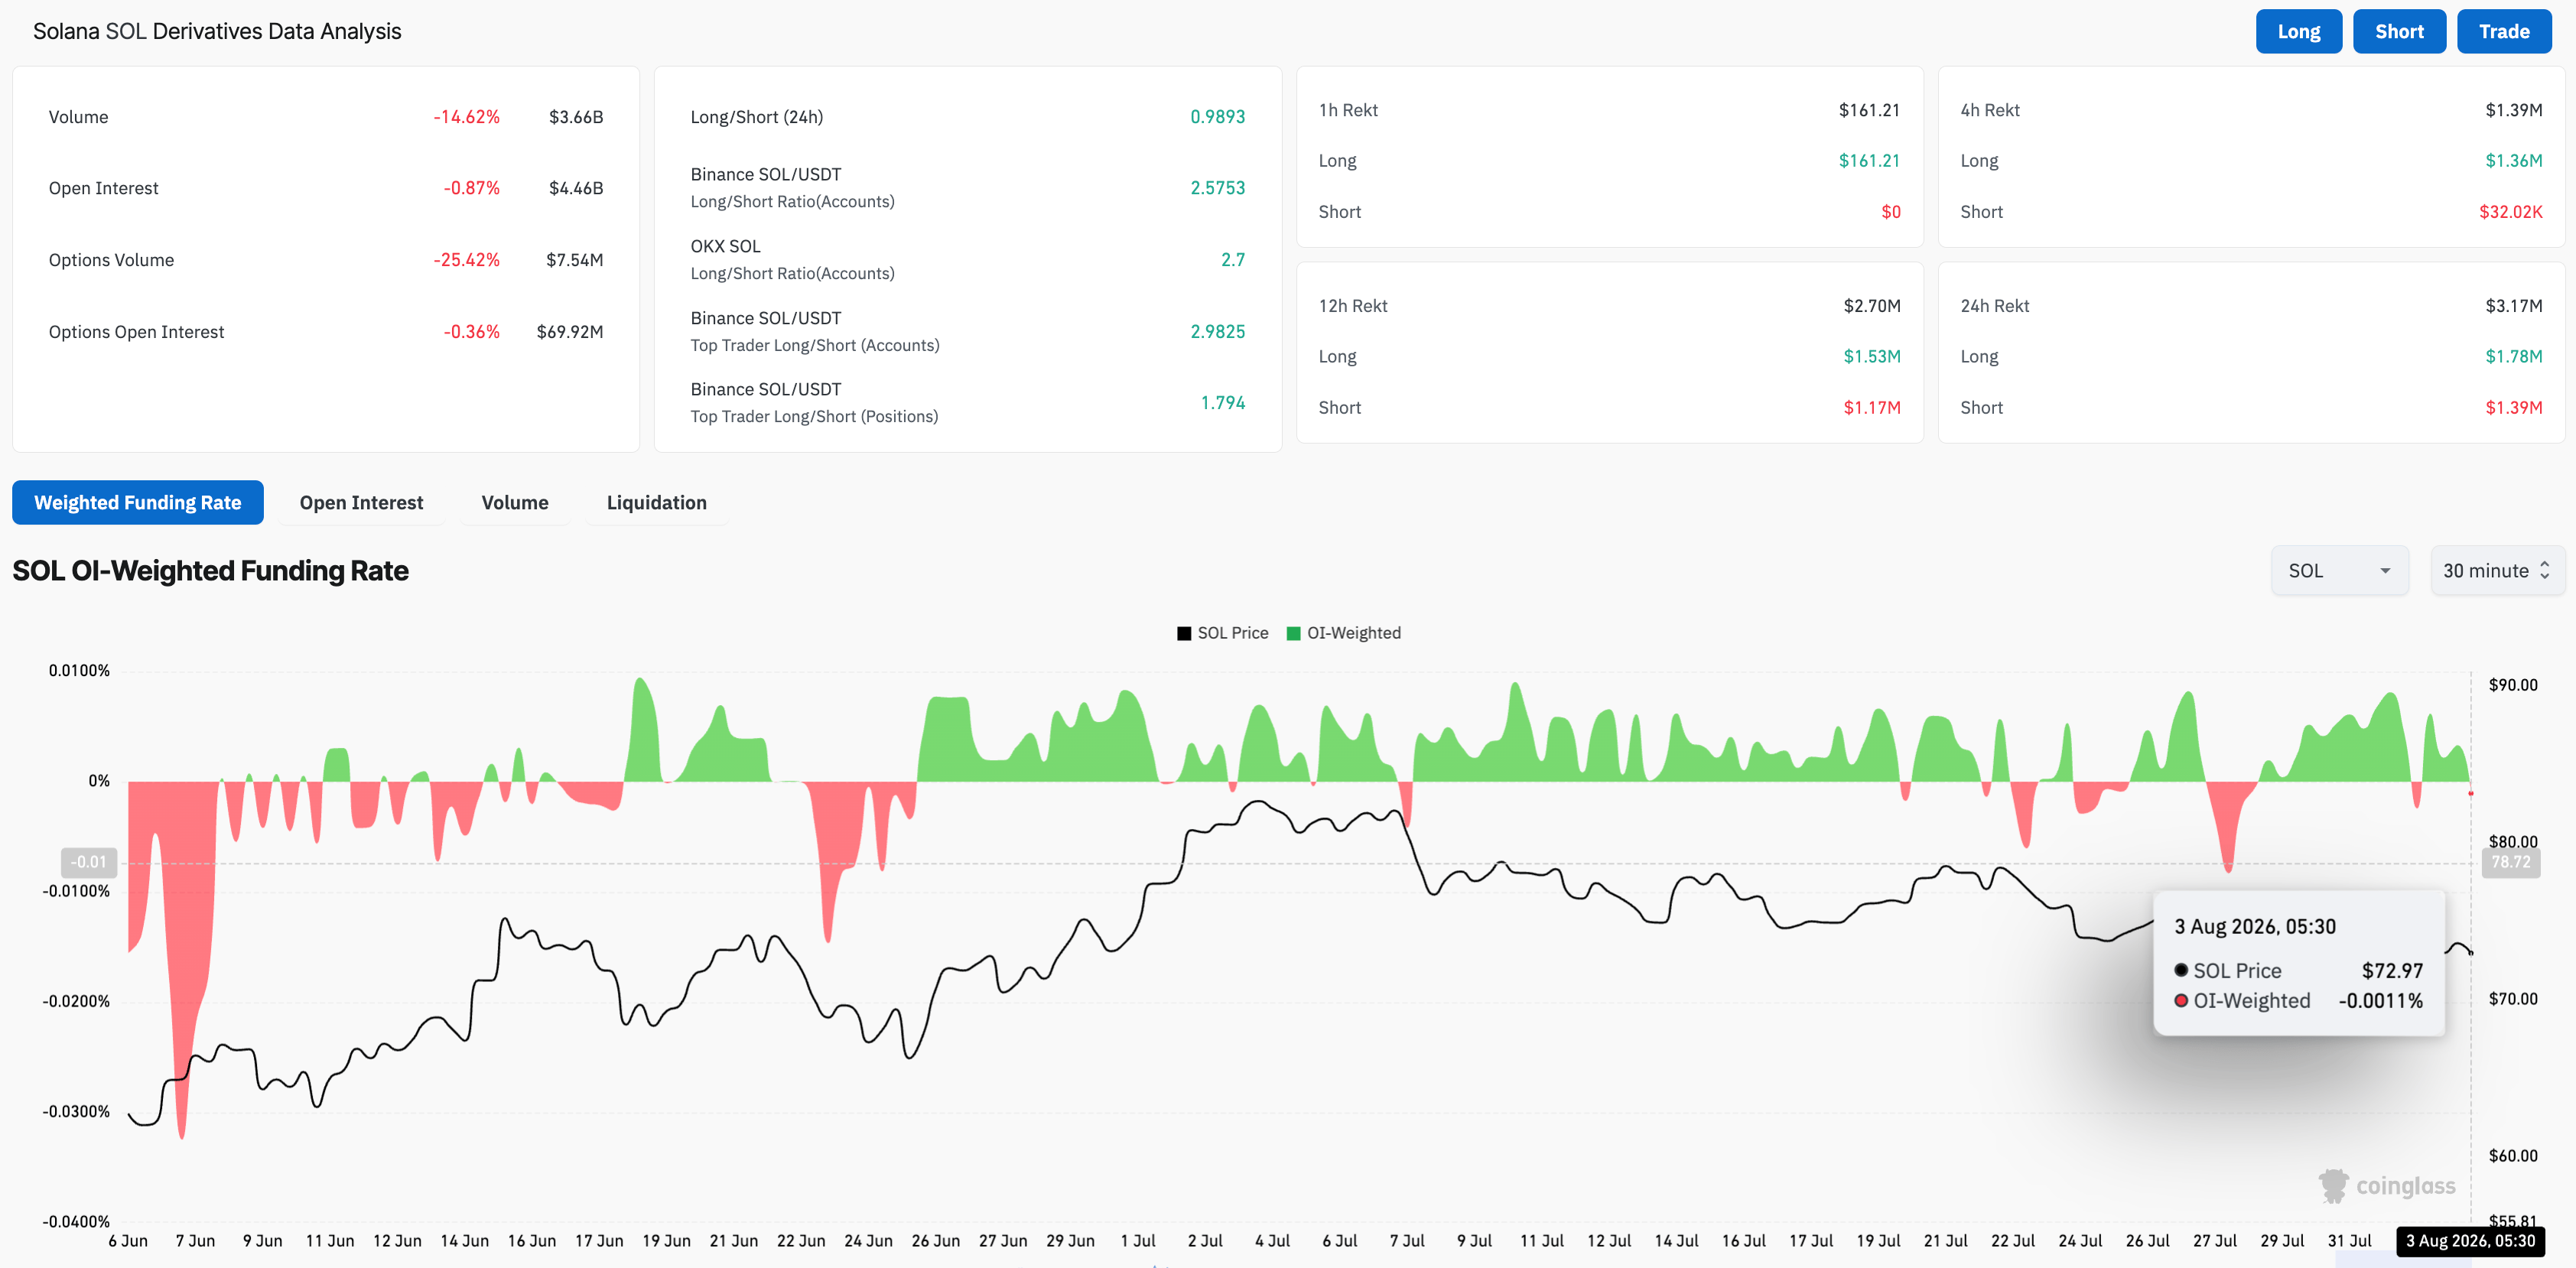
Solana is facing reduced speculative demand as broader crypto market sentiment weakens, while institutional investors remain resilient. CoinGlass data shows that SOL futures trading volume fell 14% over the last 24 hours to $3.66 billion, indicating reduced retail activity. Meanwhile, the funding rate – the premium traders are willing to pay to hold a position – has flipped negative to -0.0011% from a peak of 0.0062% on Sunday, pointing to a bearish bias. 

On the other hand, SOL ETFs recorded $2.82 million in inflows last week, extending a streak of five consecutive weekly inflows and bringing July inflows to $14.62 million. This marks the lowest monthly positive flow, up from $786,580 in outflows in May, which could be an early sign of renewed institutional demand. 
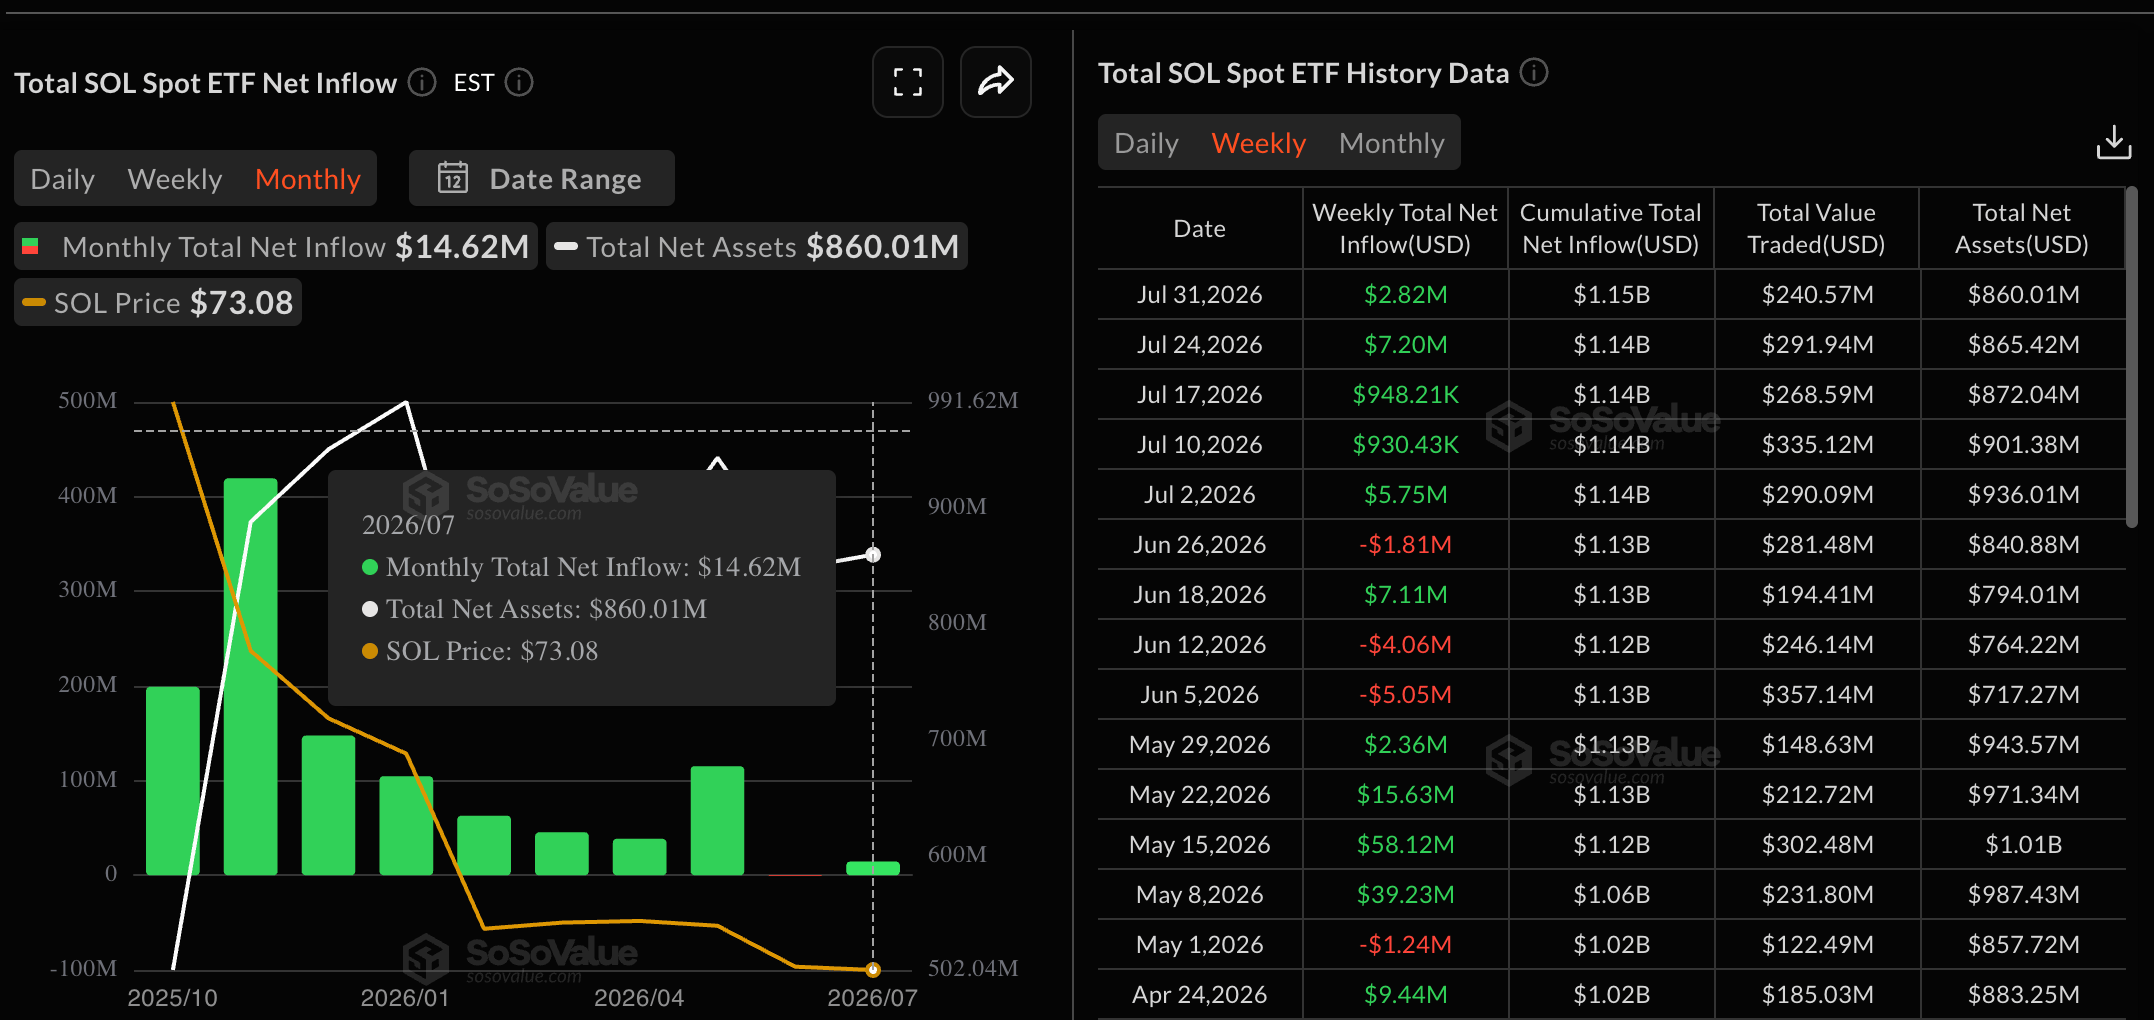
SOL ETFs data. Source: Sosovalue
SOL derivatives data. Source: CoinGlass

Technical outlook: Will Solana price drop below $70?

Solana maintains a bearish near-term tone, capped below its 50-day EMA at $75.68 and well under the 200-day EMA at $92.69. From a technical perspective, SOL trades below a descending trendline near $76.06 and is heading toward the support trendline near $71.30.

A decisive close below this zone could extend the decline toward the 78.6% Fibonacci retracement of the downswing from the $98.41 high to the $60.13 low, at $66.81

Momentum aligns with this capped structure, as the Relative Strength Index (RSI) at 43 hovers below the midline and the Moving Average Convergence Divergence (MACD) remains negative below the signal line, suggesting firm downside pressure.

Chart Analysis SOL/USDT (Binance)
SOL/USDT daily price chart.

On the topside, immediate resistance is clustered between the 50-day EMA at $75.68 and the trendline break level at $76.06. Further up, the 50% retracement at $79.27 defines a key barrier before the 23.6% retracement at $87.60 and the 200-day EMA at $92.69.

(The technical analysis of this story was written with the help of an AI tool. Know more.)

ข้อจำกัดความรับผิดชอบ: เพื่อการอ้างอิงเท่านั้น ผลการดำเนินงานในอดีตไม่ได้บ่งบอกถึงผลลัพธ์ในอนาคต
placeholder
ข่าวหุ้นวันนี้ Fed คงดอกเบี้ยแต่ตลาดสะดุ้ง หุ้นสหรัฐร่วง ทองพุ่ง และ SET เปิดลบแรงทันทุกกระแสการเงิน สรุปข่าวเด่น Forex หุ้น ทองคำ คริปโตฯ และเศรษฐกิจรอบวัน วิเคราะห์แนวโน้มตลาดด้วยข้อมูลเชิงลึก อ่านง่าย เข้าใจไว อัปเดตล่าสุดที่นี่
ผู้เขียน  Mitrade
7 เดือน 30 วัน พฤหัส
ทันทุกกระแสการเงิน สรุปข่าวเด่น Forex หุ้น ทองคำ คริปโตฯ และเศรษฐกิจรอบวัน วิเคราะห์แนวโน้มตลาดด้วยข้อมูลเชิงลึก อ่านง่าย เข้าใจไว อัปเดตล่าสุดที่นี่
placeholder
น้ำมันดิบ Brent (UKOIL) ร่วงลง ในวันที่ 31 ก.ค.: อะไรอยู่เบื้องหลังความเคลื่อนไหวนี้น้ำมันดิบ Brent (UKOIL) ปรับลง 2.02% ณ วันที่ 31 ก.ค. เวลา 00:25(ET) อยู่ที่ $85.08 โดยมีการเคลื่อนไหวในช่วง 7 วันที่ผ่านมา ปรับลง 8.13%อะไรเป็นแรงผลักดันให้ราคาหุ้น น้ำมันดิบ Brent (UKOIL) ปรับตัว ลง
ผู้เขียน  TradingKey
7 เดือน 31 วัน ศุกร์
น้ำมันดิบ Brent (UKOIL) ปรับลง 2.02% ณ วันที่ 31 ก.ค. เวลา 00:25(ET) อยู่ที่ $85.08 โดยมีการเคลื่อนไหวในช่วง 7 วันที่ผ่านมา ปรับลง 8.13%อะไรเป็นแรงผลักดันให้ราคาหุ้น น้ำมันดิบ Brent (UKOIL) ปรับตัว ลง
placeholder
ดอลลาร์ออสเตรเลียแข็งค่าขึ้นใกล้ระดับ 0.7050 ขณะที่ทรัมป์ยกเลิกการโจมตีอิหร่านในช่วงเช้าของตลาดลงทุนเอเชียวันจันทร์ คู่ AUDUSD ขยับขึ้นใกล้ 0.7040 ดอลลาร์ออสเตรเลีย (AUD) แข็งค่าขึ้นเมื่อเทียบกับดอลลาร์สหรัฐ (USD) จากความเชื่อมั่นในตลาดที่ดีขึ้นหลังรายงานว่าประธานาธิบดีสหรัฐฯ โดนัลด์ ทรัมป์ ระงับการโจมตีอิหร่าน
ผู้เขียน  FXStreet
6 ชั่วโมงที่แล้ว
ในช่วงเช้าของตลาดลงทุนเอเชียวันจันทร์ คู่ AUDUSD ขยับขึ้นใกล้ 0.7040 ดอลลาร์ออสเตรเลีย (AUD) แข็งค่าขึ้นเมื่อเทียบกับดอลลาร์สหรัฐ (USD) จากความเชื่อมั่นในตลาดที่ดีขึ้นหลังรายงานว่าประธานาธิบดีสหรัฐฯ โดนัลด์ ทรัมป์ ระงับการโจมตีอิหร่าน
placeholder
คาดการณ์ราคาน้ำมัน WTI: อาจเจ็บหนักขึ้นหากไม่สามารถรักษาระดับ 77 ดอลลาร์ได้ในตลาดลงทุนเอเชียวันจันทร์ ราคาน้ำมันดิบเวสต์เทกซัสอินเตอร์มีเดียต (WTI) ฟิวเจอร์สบนตลาด NYMEX ยังคงรักษาการขาดทุนในช่วงต้นไว้ โดยปรับตัวลดลง 7.6% อยู่ที่ประมาณ 78.60 ดอลลาร์
ผู้เขียน  FXStreet
1 ชั่วโมงที่แล้ว
ในตลาดลงทุนเอเชียวันจันทร์ ราคาน้ำมันดิบเวสต์เทกซัสอินเตอร์มีเดียต (WTI) ฟิวเจอร์สบนตลาด NYMEX ยังคงรักษาการขาดทุนในช่วงต้นไว้ โดยปรับตัวลดลง 7.6% อยู่ที่ประมาณ 78.60 ดอลลาร์
placeholder
ข่าวหุ้นวันนี้ สหรัฐฯ ร่วมญี่ปุ่นซื้อเยน ตลาด FX สะเทือน หุ้นสหรัฐฯ เด้ง แต่ SET เช้าแกว่งแรงทันทุกกระแสการเงิน สรุปข่าวเด่น Forex หุ้น ทองคำ คริปโตฯ และเศรษฐกิจรอบวัน วิเคราะห์แนวโน้มตลาดด้วยข้อมูลเชิงลึก อ่านง่าย เข้าใจไว อัปเดตล่าสุดที่นี่
ผู้เขียน  Mitrade
1 ชั่วโมงที่แล้ว
ทันทุกกระแสการเงิน สรุปข่าวเด่น Forex หุ้น ทองคำ คริปโตฯ และเศรษฐกิจรอบวัน วิเคราะห์แนวโน้มตลาดด้วยข้อมูลเชิงลึก อ่านง่าย เข้าใจไว อัปเดตล่าสุดที่นี่
ตราสารที่เกี่ยวข้อง
goTop
quote