

Solana Price Forecast: SOL risks further decline amid weak institutional, retail demand

แหล่งที่มา Fxstreet
  • Solana edges lower on Monday as an overhead trendline caps two previous days of recovery.
  • SOL ETFs recorded two consecutive weekly inflows of less than $1 million, indicating weak institutional demand.
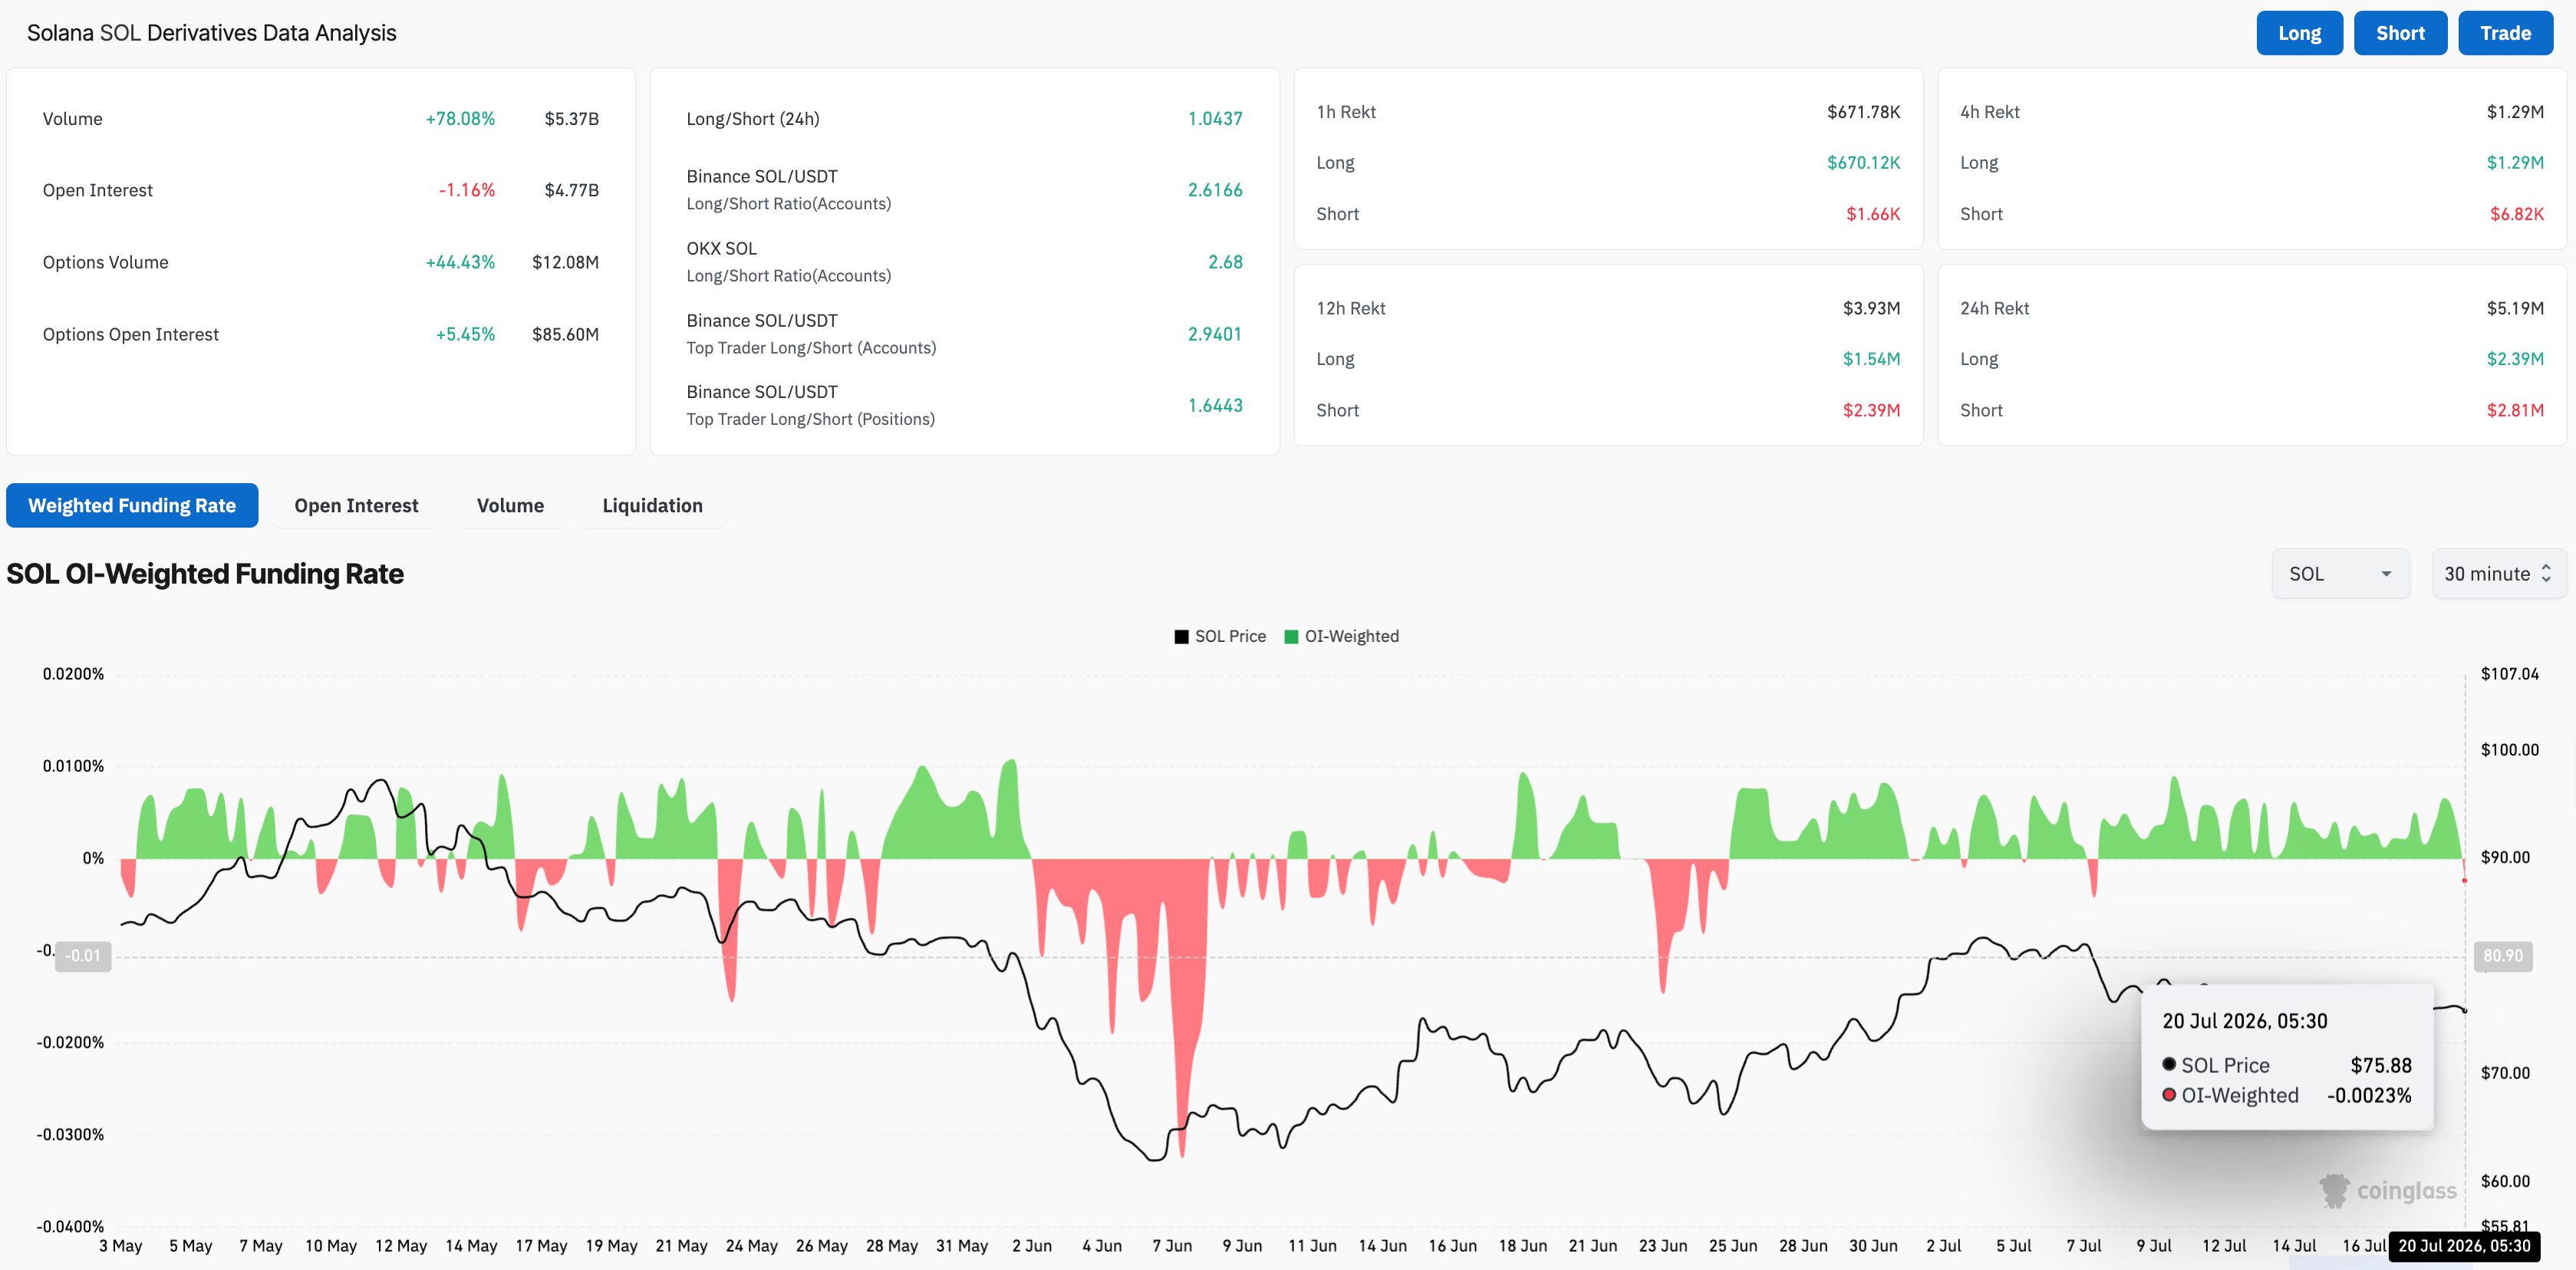
  • Declining Open Interest and funding rate imply a bearish retail bias, despite trading volume being up over 70% in 24 hours.

Solana (SOL) price edges lower on Monday, maintaining a corrective tone from early July. Institutional demand remains muted, with two consecutive weeks of inflows under $1 million, while declining Open Interest and the funding rate point to bearish retail interest, even as trading volume rises by over 70% in 24 hours. 

Institutional, retail signal further downside for Solana

Solana struggles to regain strength despite easing broader market risk-off sentiment. CoinGlass data show a minor contraction in SOL futures Open Interest (OI) over the last 24 hours, to $4.77 billion, despite a 78% increase in trading volume to $5.37 billion. Meanwhile, the funding rate has slipped below zero to 0.0023%, indicating that traders are willing to buy short positions at a premium. 

On the institutional side, the SOL-focused Exchange Traded Funds (ETFs) recorded $948,210 in inflows last week, following the previous week’s inflow of $930,430. This points to institutional interest shifting from SOL to other blue-chip crypto assets like Bitcoin (BTC) and Ethereum (ETH), with inflows of $75.67 million and $105.44 million last week.
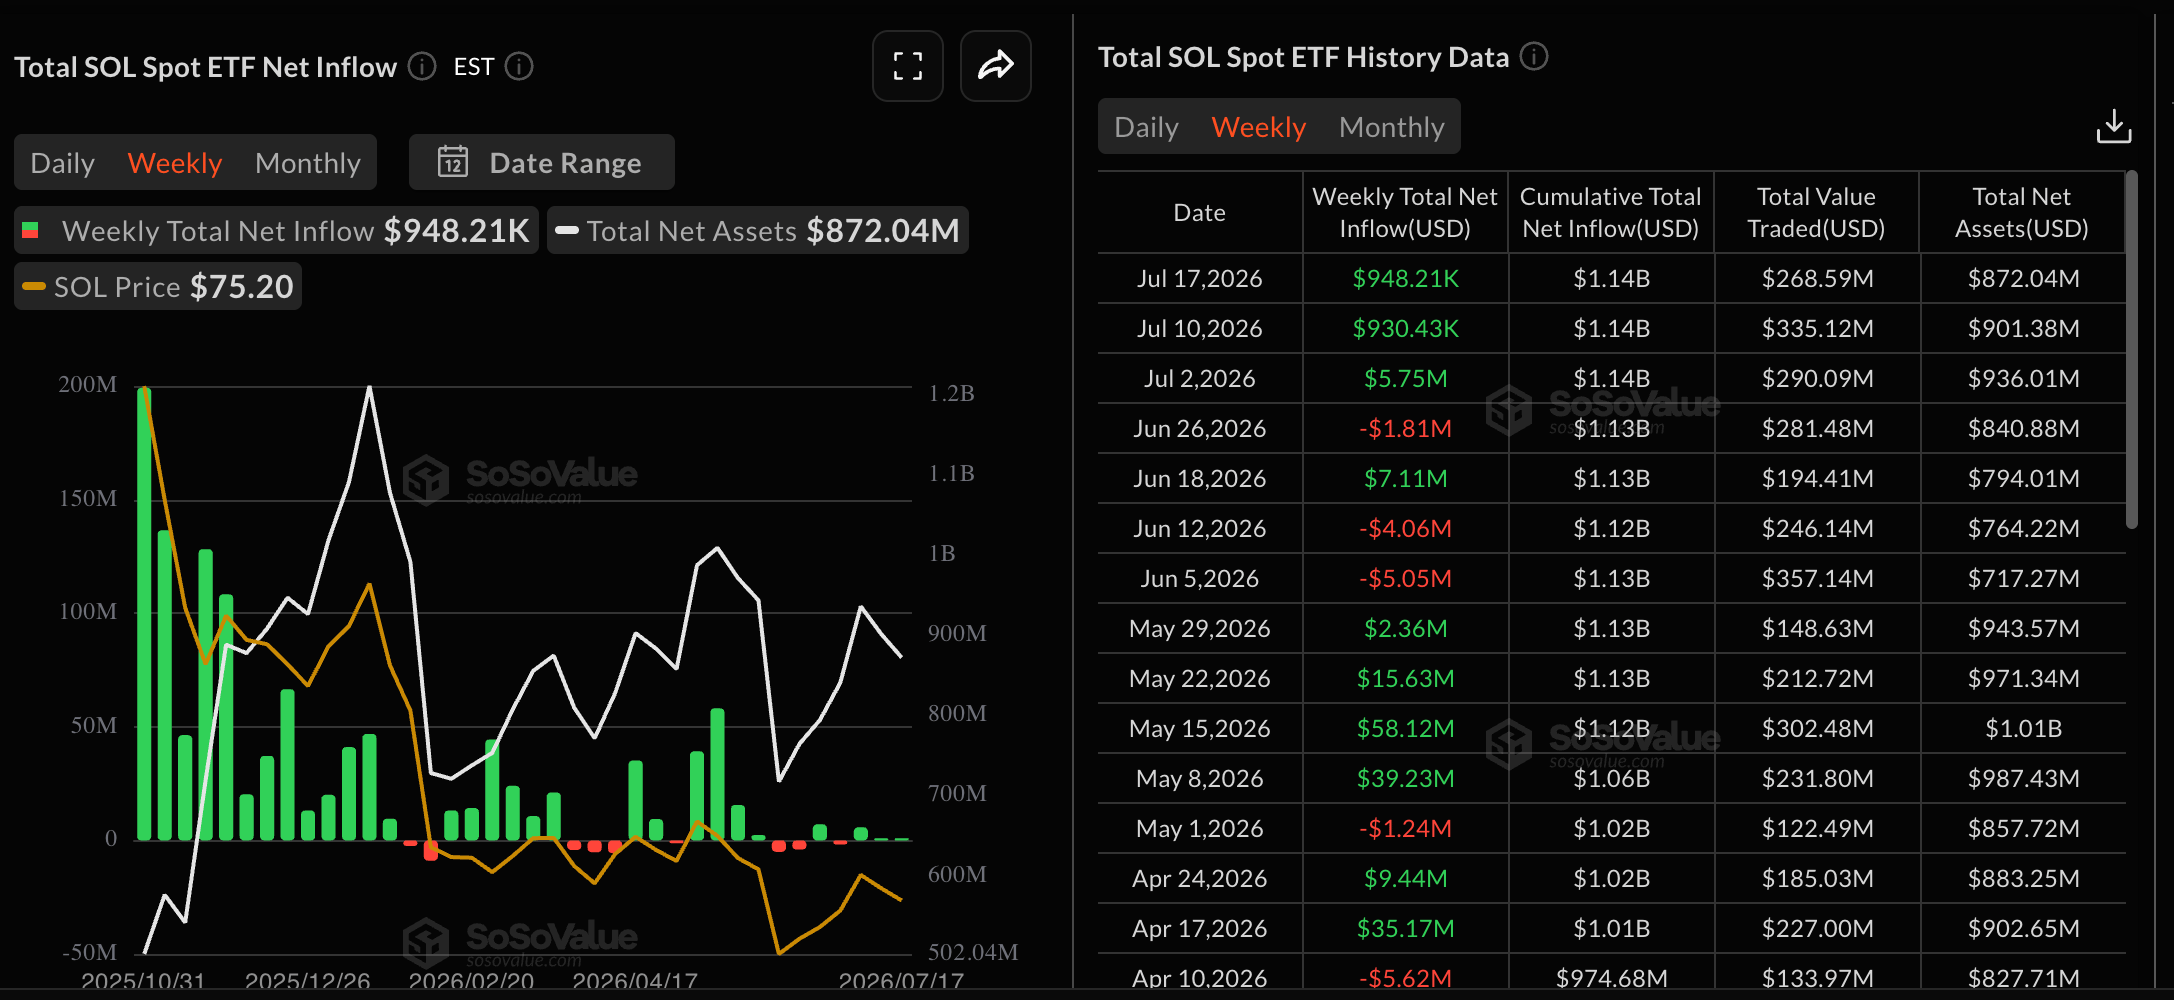
SOL ETFs data. Source: Sosovalue
SOL derivatives data. Source: CoinGlass

Will Solana price test $70?

Solana holds a mildly bearish near-term bias as price remains below a local resistance trendline on the 4-hour chart. At the time of writing, SOL trades in the red on Monday, under its 50-period Exponential Moving Average (EMA) at $76.32 and the 200-period EMA at $76.51.

The Relative Strength Index (RSI) around 49 on the 4-hour chart signals neutral momentum, while the Moving Average Convergence Divergence (MACD) and signal line hint at modest positive pressure that has yet to overcome structural resistance.

Looking down, the immediate support lies at the S1 Pivot level near $73.50, reinforced by a descending support trendline near $72.80. A slip below this zone could target the S2 Pivot level at $70.62.

Chart Analysis SOL/USDT (Binance)
SOL/USDT 4-hour price chart.

On the topside, a decisive close above the downward resistance trendline near $77.27 could confirm further upside for SOL. The R1 and R2 Pivot levels at $79.15 and $81.92 could cap the potential breakout rally.

(The technical analysis of this story was written with the help of an AI tool. Know more.)

ข้อจำกัดความรับผิดชอบ: เพื่อการอ้างอิงเท่านั้น ผลการดำเนินงานในอดีตไม่ได้บ่งบอกถึงผลลัพธ์ในอนาคต
placeholder
ข่าวหุ้นวันนี้ หุ้นเทคสะดุดทำตลาดระแวง Fed ยังไม่จบ น้ำมันกดทอง แต่ SET ยังมีเงินต่างชาติช่วยพยุงทันทุกกระแสการเงิน สรุปข่าวเด่น Forex หุ้น ทองคำ คริปโตฯ และเศรษฐกิจรอบวัน วิเคราะห์แนวโน้มตลาดด้วยข้อมูลเชิงลึก อ่านง่าย เข้าใจไว อัปเดตล่าสุดที่นี่
ผู้เขียน  Mitrade
7 เดือน 17 วัน ศุกร์
ทันทุกกระแสการเงิน สรุปข่าวเด่น Forex หุ้น ทองคำ คริปโตฯ และเศรษฐกิจรอบวัน วิเคราะห์แนวโน้มตลาดด้วยข้อมูลเชิงลึก อ่านง่าย เข้าใจไว อัปเดตล่าสุดที่นี่
placeholder
คาดการณ์ราคาโลหะเงิน: XAG/USD ปรับตัวขึ้นสู่ระดับ $57.00 แม้จะมีการเก็งการขึ้นดอกเบี้ยของ Fedราคาโลหะเงิน (XAG/USD) ปรับตัวเพิ่มขึ้นต่อเนื่องเป็นวันที่สอง โดยเทรดอยู่ที่ประมาณ $56.80 ต่อทรอยออนซ์ในช่วงชั่วโมงการซื้อขายเอเชียวันจันทร์
ผู้เขียน  FXStreet
22 ชั่วโมงที่แล้ว
ราคาโลหะเงิน (XAG/USD) ปรับตัวเพิ่มขึ้นต่อเนื่องเป็นวันที่สอง โดยเทรดอยู่ที่ประมาณ $56.80 ต่อทรอยออนซ์ในช่วงชั่วโมงการซื้อขายเอเชียวันจันทร์
placeholder
คาดการณ์ WTI: ขาขึ้นยังคุมใกล้ระดับสูงสุดในรอบหนึ่งเดือนที่ประมาณ $83.50 จากความเสี่ยงในอิหร่านราคาน้ำมันดิบเวสต์เทกซัสอินเตอร์มีเดียต (WTI) ซึ่งเป็นเกณฑ์มาตรฐานราคาน้ำมันดิบของสหรัฐฯ เริ่มต้นสัปดาห์ใหม่ด้วยสัญญาณขาขึ้น และแตะระดับสูงสุดใหม่ตั้งแต่วันที่ 12 มิถุนายน อยู่ในช่วงประมาณ 84.40-84.45 ดอลลาร์ในช่วงเซสชันเอเชีย นอกจากนี้ ความตึงเครียดที่เพิ่มขึ้นระหว่างสหรัฐฯ กับอิหร่านและการปิดช่องแ
ผู้เขียน  FXStreet
19 ชั่วโมงที่แล้ว
ราคาน้ำมันดิบเวสต์เทกซัสอินเตอร์มีเดียต (WTI) ซึ่งเป็นเกณฑ์มาตรฐานราคาน้ำมันดิบของสหรัฐฯ เริ่มต้นสัปดาห์ใหม่ด้วยสัญญาณขาขึ้น และแตะระดับสูงสุดใหม่ตั้งแต่วันที่ 12 มิถุนายน อยู่ในช่วงประมาณ 84.40-84.45 ดอลลาร์ในช่วงเซสชันเอเชีย นอกจากนี้ ความตึงเครียดที่เพิ่มขึ้นระหว่างสหรัฐฯ กับอิหร่านและการปิดช่องแ
placeholder
ข่าวหุ้นวันนี้ น้ำมัน-ยีลด์บีบตลาด แต่ SET ยังมีแรงพยุงจากพลังงานและหุ้นเลือกตัวทันทุกกระแสการเงิน สรุปข่าวเด่น Forex หุ้น ทองคำ คริปโตฯ และเศรษฐกิจรอบวัน วิเคราะห์แนวโน้มตลาดด้วยข้อมูลเชิงลึก อ่านง่าย เข้าใจไว อัปเดตล่าสุดที่นี่
ผู้เขียน  Mitrade
19 ชั่วโมงที่แล้ว
ทันทุกกระแสการเงิน สรุปข่าวเด่น Forex หุ้น ทองคำ คริปโตฯ และเศรษฐกิจรอบวัน วิเคราะห์แนวโน้มตลาดด้วยข้อมูลเชิงลึก อ่านง่าย เข้าใจไว อัปเดตล่าสุดที่นี่
placeholder
คาดการณ์ราคา EUR/USD: ปรับตัวขึ้นใกล้ 1.1450 แต่ยังถูกจำกัดให้อยู่ต่ำกว่าเส้นค่าเฉลี่ยเคลื่อนที่ 100 วันในช่วงเช้าของตลาดลงทุนยุโรปวันจันทร์ คู่ EUR/USD เคลื่อนไหวในแดนบวกที่ประมาณ 1.1445 ได้รับแรงหนุนจากโทนเสียงเชิงเข้มงวดของธนาคารกลางยุโรป (ECB)
ผู้เขียน  FXStreet
17 ชั่วโมงที่แล้ว
ในช่วงเช้าของตลาดลงทุนยุโรปวันจันทร์ คู่ EUR/USD เคลื่อนไหวในแดนบวกที่ประมาณ 1.1445 ได้รับแรงหนุนจากโทนเสียงเชิงเข้มงวดของธนาคารกลางยุโรป (ECB)
ตราสารที่เกี่ยวข้อง
goTop
quote