


Pi Network Price Forecast: Bulls attempt comeback as bearish strength fades
- Pi Network steadies at $0.120 on Friday after a slight rebound the previous day.
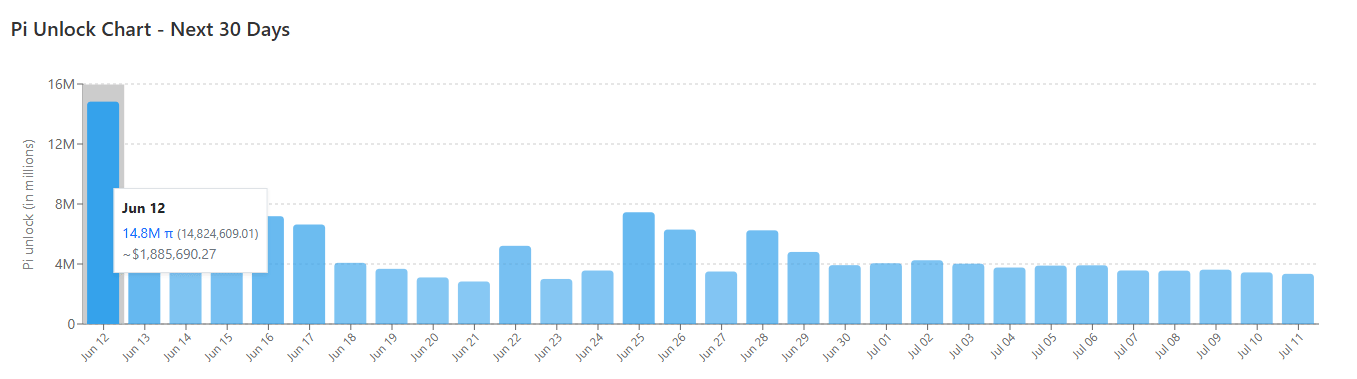
- On-chain data shows 14.8 million PI tokens to be unlocked on Friday, which could cap its potential recovery.
- The technical outlook suggests a possibility of a short-term recovery as momentum indicators show fading bearish strength.
Pi Network (PI) is trading at around $0.120 on Friday after a modest recovery the previous day. Despite this recent rebound, traders should be cautious as a scheduled unlock of 14.8 million PI tokens on Friday could limit the token's recovery potential by increasing market supply. Meanwhile, the technical outlook is showing early signs of fading bearish momentum, suggesting a short-term bounce.
Token unlock could cap PI recovery
Pi Scan data shows that 14.8 million PI tokens are scheduled to unlock on Friday. This token unlock could cap PI’s recovery potential by increasing market supply.
Pi Network Price Forecast: Fading bearish strength
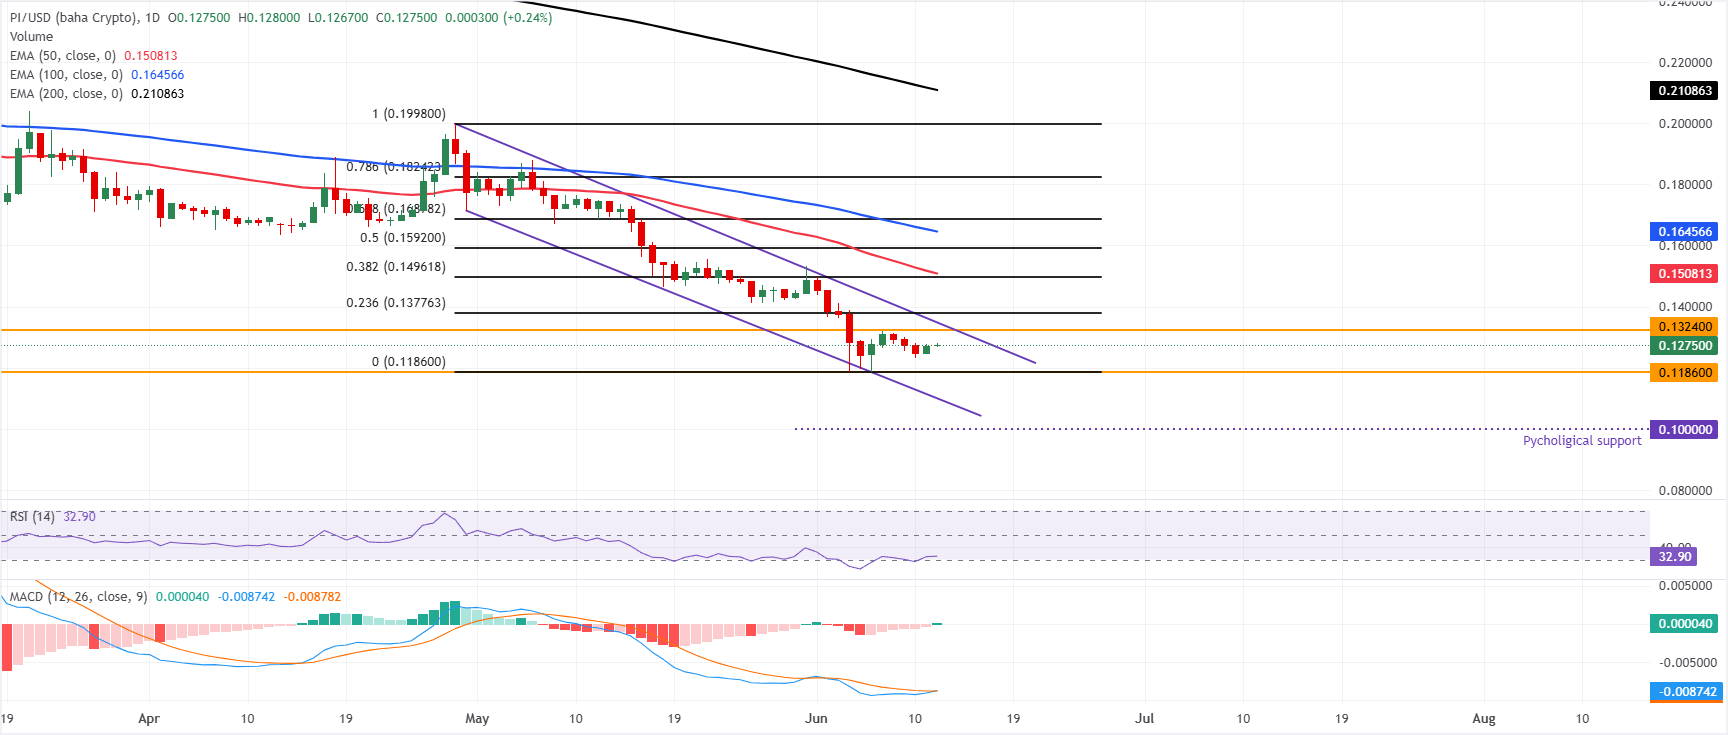
Pi Network trades at $0.120 on Friday after a mild rebound the previous day. However, the long-term bias is bearish, as PI is holding well below the 50-day, 100-day, and 200-day Exponential Moving Averages (EMAs), clustered between roughly $0.150 and $0.210.
PI remains trapped under a dense Fibonacci retracement band starting at the 23.6% level at $0.137. At the same time, the Relative Strength Index (RSI) near 33 only hints at mildly oversold conditions rather than a firm rebound. The Moving Average Convergence Divergence (MACD) line has flattened around the zero mark, suggesting downside pressure is easing but not yet reversing the broader downtrend.
On the topside, initial resistance emerges at the horizontal barrier of $0.132, followed by the broken descending trendline region near $0.134 and then the 23.6% Fibonacci retracement at $0.137. Above these, sellers are likely to reappear toward the 38.2% retracement at $0.149 and the 50-day EMA at $0.150, with subsequent caps at the 50% retracement at $0.159, the 100-day EMA at $0.164 and the 61.8% Fibonacci retracement level at $0.168.
On the downside, the main support remains the prior swing low and the Fibonacci anchor at $0.118; a sustained break below this floor would expose fresh downside and reinforce the prevailing bearish bias.
(The technical analysis of this story was written with the help of an AI tool.)
Cryptocurrency metrics FAQs
The developer or creator of each cryptocurrency decides on the total number of tokens that can be minted or issued. Only a certain number of these assets can be minted by mining, staking or other mechanisms. This is defined by the algorithm of the underlying blockchain technology. On the other hand, circulating supply can also be decreased via actions such as burning tokens, or mistakenly sending assets to addresses of other incompatible blockchains.
Market capitalization is the result of multiplying the circulating supply of a certain asset by the asset’s current market value.
Trading volume refers to the total number of tokens for a specific asset that has been transacted or exchanged between buyers and sellers within set trading hours, for example, 24 hours. It is used to gauge market sentiment, this metric combines all volumes on centralized exchanges and decentralized exchanges. Increasing trading volume often denotes the demand for a certain asset as more people are buying and selling the cryptocurrency.
Funding rates are a concept designed to encourage traders to take positions and ensure perpetual contract prices match spot markets. It defines a mechanism by exchanges to ensure that future prices and index prices periodic payments regularly converge. When the funding rate is positive, the price of the perpetual contract is higher than the mark price. This means traders who are bullish and have opened long positions pay traders who are in short positions. On the other hand, a negative funding rate means perpetual prices are below the mark price, and hence traders with short positions pay traders who have opened long positions.
บทความแนะนำ


