


Bitcoin Price Forecast: BTC reclaims $110,000 despite mixed ETF flows
- Bitcoin price recovers slightly on Thursday after failing to overcome the 50-day EMA on Tuesday.
- Copper Research highlights that the October setup aligns with BTC’s historical fear cycle pattern, suggesting a potential recovery.
- ETF flows remain indecisive, alternating inflows and outflows through the week.
Bitcoin (BTC) reclaims the $110,000 mark at the time of writing on Thursday after facing rejection from a key level earlier this week. While mixed spot Exchange Traded Funds (ETFs) flows highlight indecision among institutions, historical patterns suggest that the current setup could pave the way for a potential recovery in the weeks ahead.
Bitcoin could recover toward $130,000 by mid-December, reports Copper Research
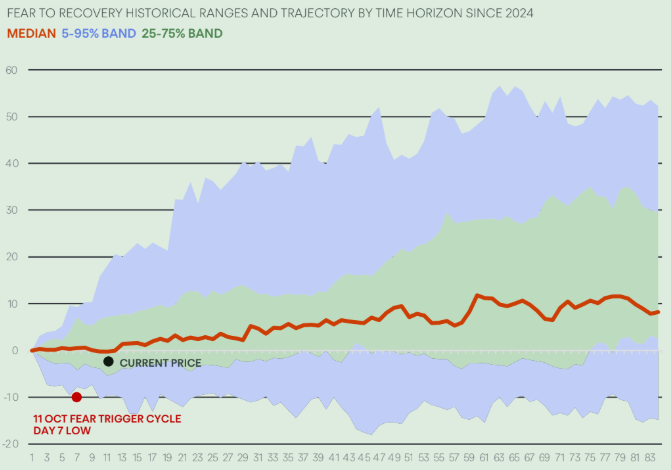
The Copper Research report, released on Wednesday, highlighted that the October setup aligns almost perfectly with BTC’s historical fear cycle pattern, suggesting that the recent low of $102,000 signals potential recovery toward $125,000 to $130,000 by mid-December.
The report analyzed dataset covers over 40 fear events since 2024, each normalized over an 84-day window to capture the full Fear-to-Recovery cycle. The October setup mirrors the historical template almost perfectly: a quick -10% correction, an 11-day consolidation, and a statistical bias toward a 15–30% recovery over the following 8–12 weeks. While short-term sentiment remains cautious, the data strongly indicate that fear still represents a reset, not a reversal.
In an exclusive interview, Fadi Aboualfa, Head of Research at Copper, told FXStreet that “Every time fear takes hold of the market, the data tells a similar story — Bitcoin tends to pull back sharply, then rebound harder.”
Aboualfa continued, “What we’re seeing right now fits that historical rhythm almost perfectly. This latest dip to around $103,000 looks very much like the exhaustion point we’ve seen in past cycles. If that holds, historical data suggests we could be in the early stages of a recovery phase, with prices trending back toward the $125,000 to $130,000 range before year-end.”
Indecisiveness among institutional investors
Institutional flows reflect a mixed sentiment so far this week, as Bitcoin spot ETFs saw alternating inflows and outflows — mild outflows of $40.47 million on Monday and $101.29 million on Wednesday contrast with the $477.19 million inflow on Tuesday, according to SoSoValue data. This highlights the indecisiveness among institutional investors, as fluctuating ETF flows suggest a cautious approach amid prevailing market uncertainty.
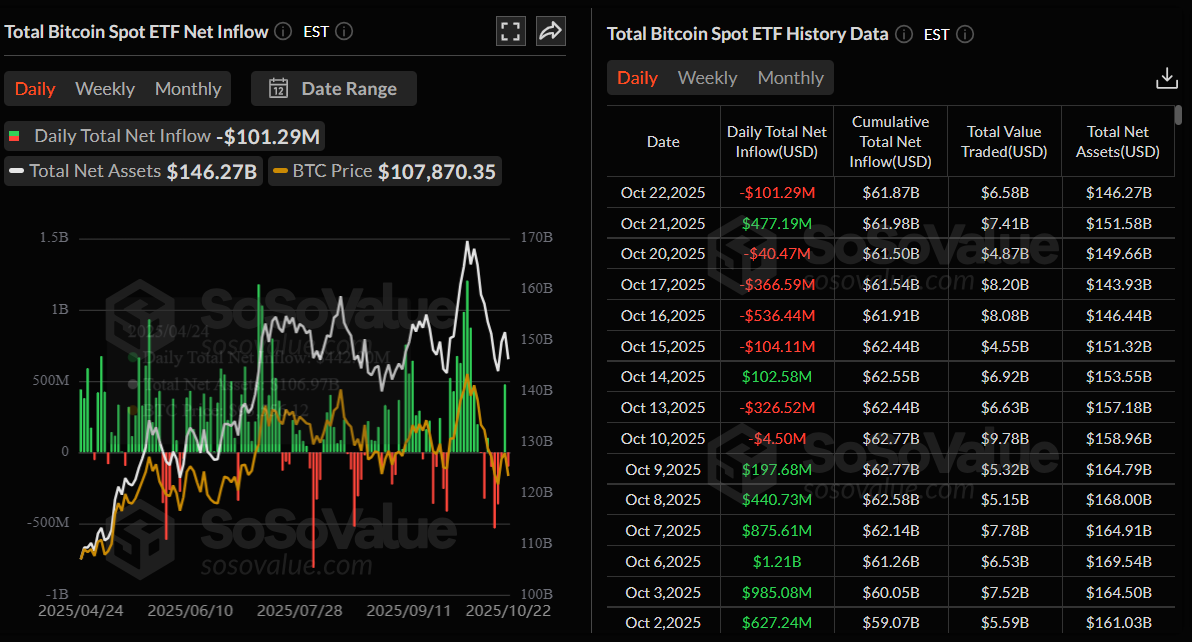
Total Bitcoin Spot ETF net inflow daily chart. Source: SoSoValue
Some signs of concern
Glassnode's weekly report highlighted on Wednesday that BTC has corrected below the short-term holders’ cost basis at $113,100. Also below, the 0.85 quantile at $108,600 indicates growing demand exhaustion, as the market struggles to attract new inflows while long-term holders continue to distribute their holdings.
This structural fatigue suggests that Bitcoin’s network may need an extended consolidation phase to restore market confidence. Moreover, if BTC corrects, it could revisit the 0.75 quantile level, currently around $97,500.
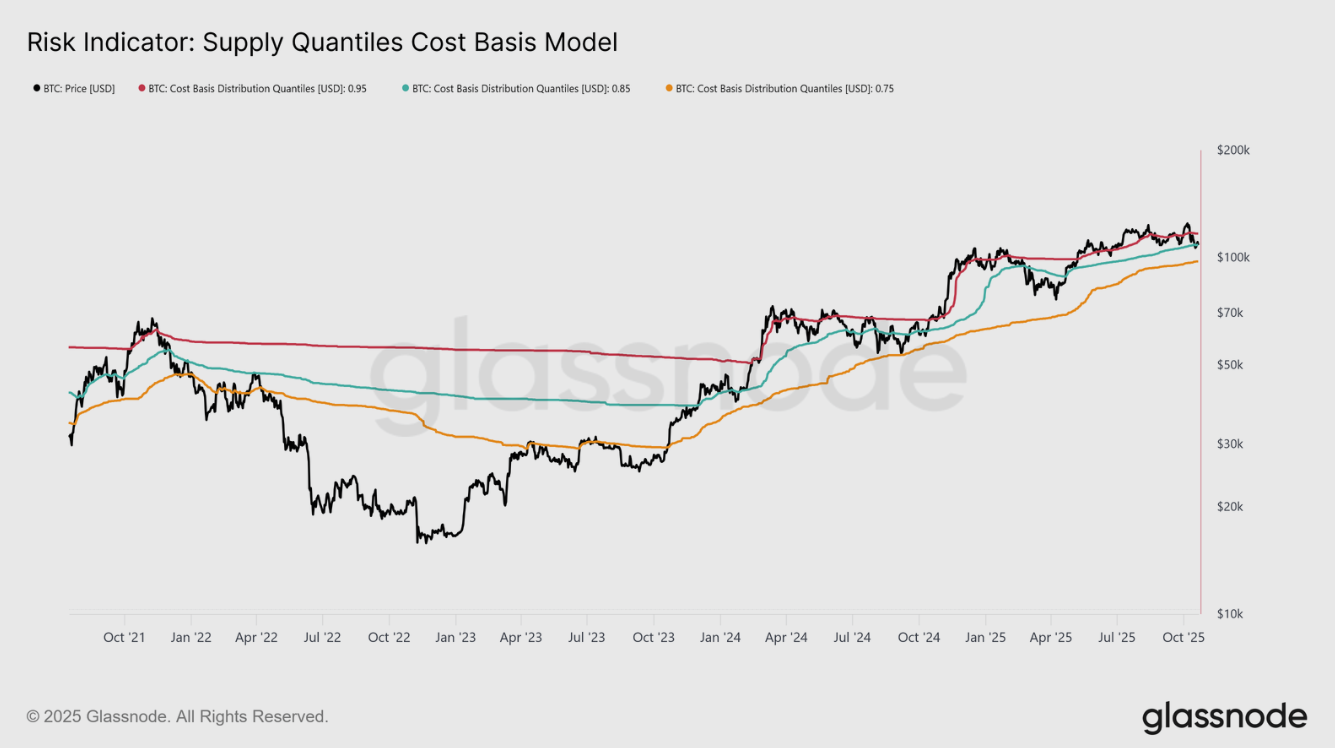
BTC cost basis model chart. Source: Glassnode
On the options market, the report explains that BTC has the same cautious structure. Despite record-high open interest, positioning leans defensive; put skew remains elevated, volatility sellers are under pressure, and short-term rallies are met with hedging rather than optimism.
“Together, these signals indicate a market in transition, one where exuberance has waned, structural risk-taking is subdued, and recovery will likely depend on restoring spot demand and mitigating volatility-driven flows,” said Glassnode analyst.
Bitcoin Price Forecast: BTC shows early signs of fading bearish momentum
Bitcoin faced rejection from the 50-day Exponential Moving Average (EMA) at $113,423 on Tuesday and declined by 2.68% the next day, retesting the 61.8% Fibonacci retracement level (drawn from the April low of $74,508 to the record high of $126,199) at $106,453. At the time of writing on Thursday, BTC trades slightly above $109,500.
If the 61.8% Fibonacci retracement at $106,453 holds as support, Bitcoin could extend the recovery toward the 50-day EMA at $113,423. A successful close above this level could extend the rally toward the 78.60% Fibonacci retracement level at $115,137.
The Relative Strength Index (RSI) indicator at 43 points upward on the daily chart, suggesting early signs of fading bearish momentum. For the recovery rally to be sustained, the RSI must move above the neutral level of 50. Moreover, the Moving Average Convergence Divergence (MACD) lines are converging to form a bullish crossover. If successful, this would further support a recovery ahead.
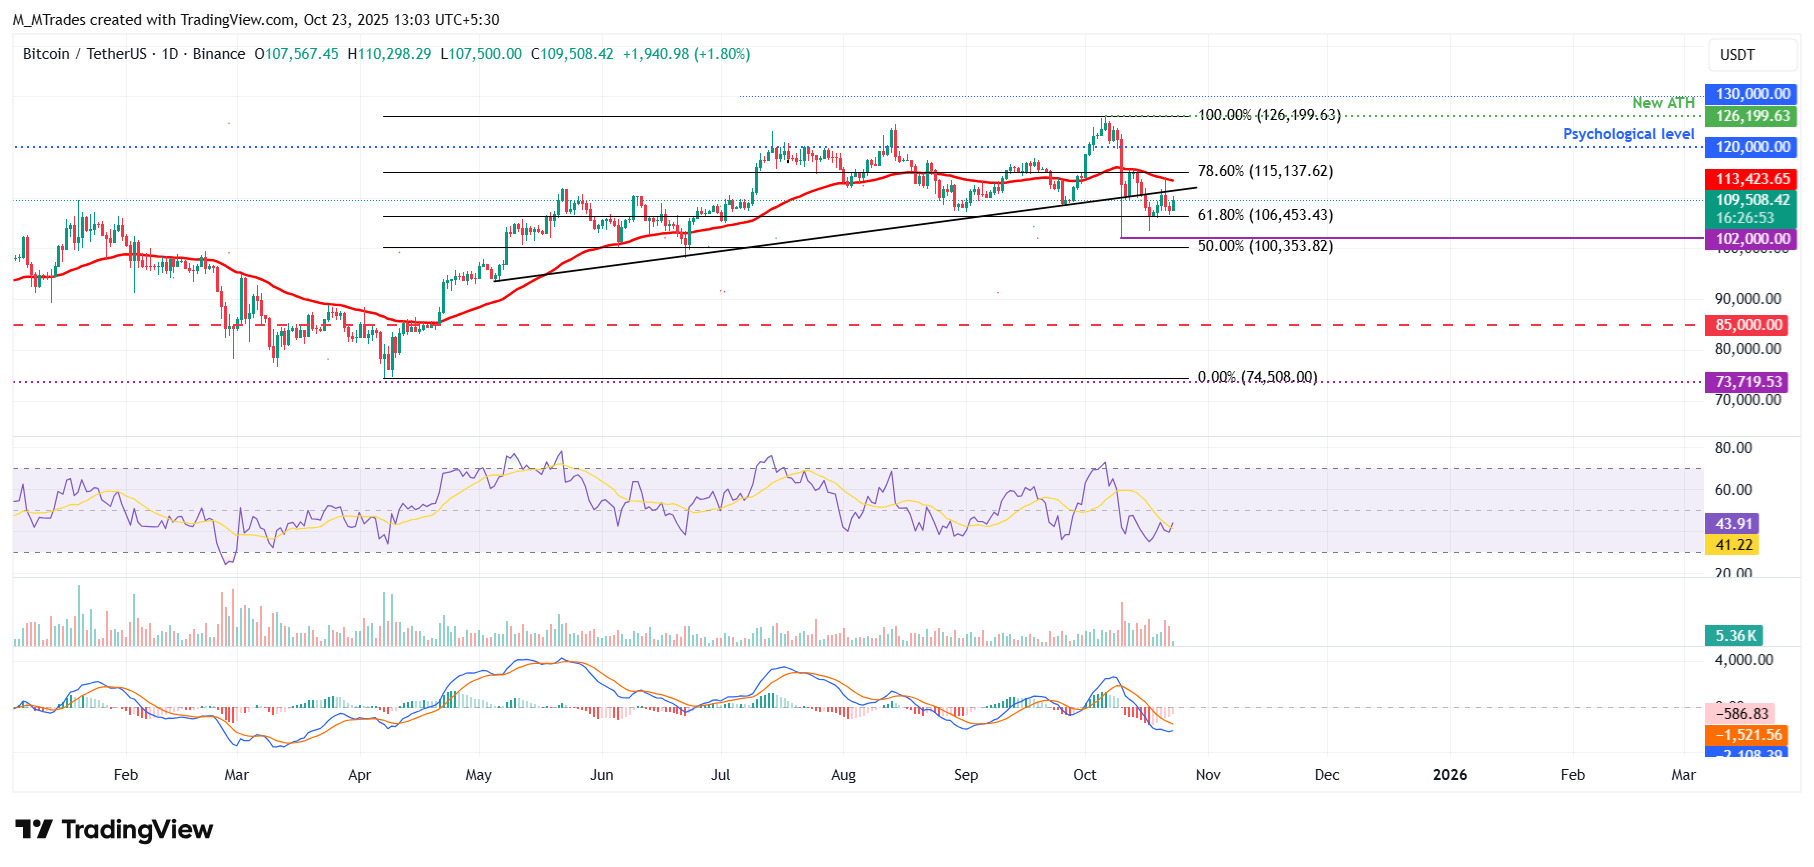
BTC/USDT daily chart
On the other hand, if BTC closes below the $106,453 support, it could extend additional losses toward the October 10 low of $102,000.
Bitcoin, altcoins, stablecoins FAQs
Bitcoin is the largest cryptocurrency by market capitalization, a virtual currency designed to serve as money. This form of payment cannot be controlled by any one person, group, or entity, which eliminates the need for third-party participation during financial transactions.
Altcoins are any cryptocurrency apart from Bitcoin, but some also regard Ethereum as a non-altcoin because it is from these two cryptocurrencies that forking happens. If this is true, then Litecoin is the first altcoin, forked from the Bitcoin protocol and, therefore, an “improved” version of it.
Stablecoins are cryptocurrencies designed to have a stable price, with their value backed by a reserve of the asset it represents. To achieve this, the value of any one stablecoin is pegged to a commodity or financial instrument, such as the US Dollar (USD), with its supply regulated by an algorithm or demand. The main goal of stablecoins is to provide an on/off-ramp for investors willing to trade and invest in cryptocurrencies. Stablecoins also allow investors to store value since cryptocurrencies, in general, are subject to volatility.
Bitcoin dominance is the ratio of Bitcoin's market capitalization to the total market capitalization of all cryptocurrencies combined. It provides a clear picture of Bitcoin’s interest among investors. A high BTC dominance typically happens before and during a bull run, in which investors resort to investing in relatively stable and high market capitalization cryptocurrency like Bitcoin. A drop in BTC dominance usually means that investors are moving their capital and/or profits to altcoins in a quest for higher returns, which usually triggers an explosion of altcoin rallies.
บทความแนะนำ


