
Top Crypto Gainers: Mantle, Zcash, Bittensor – Weekend rebound eyes further recovery
- Mantle eyes further recovery after bouncing off a key support over the weekend.
- Zcash recovery approaches a local resistance trendline near the $250 mark.
- Bittensor rebounds from the 200-day EMA to reclaim $400 as bullish momentum holds steady.
Mantle (MNT, Zcash (ZEC), and Bittensor (TAO) outpace the broader cryptocurrency market after a recovery on the weekend, nearly offsetting Friday’s decline. Technically, the recovery run in MNT, TAO, and ZEC is a rebound, keeping the price reaction on a knife-edge.
Mantle’s rebound targets $2
Mantle holds steady above $1.80 at press time on Monday, after two consecutive days of recovery. The MNT recovery marks a rebound from the $1.59 support zone, aligning with the centre Pivot Point level.
However, the recovery run facing overhead pressure risks a lower high formation as seen on October 12. The immediate resistance lies at the R1 Pivot Point level at $2.11.
Mantle’s recovery signals a decline in selling pressure as indicated by the Relative Strength Index (RSI) at 50 on the daily chart, going flat at the neutral line. Furthermore, the Moving Average Convergence Divergence (MACD) turns flat near the zero line, approaching its signal line for a potential crossover as selling fuel declines.
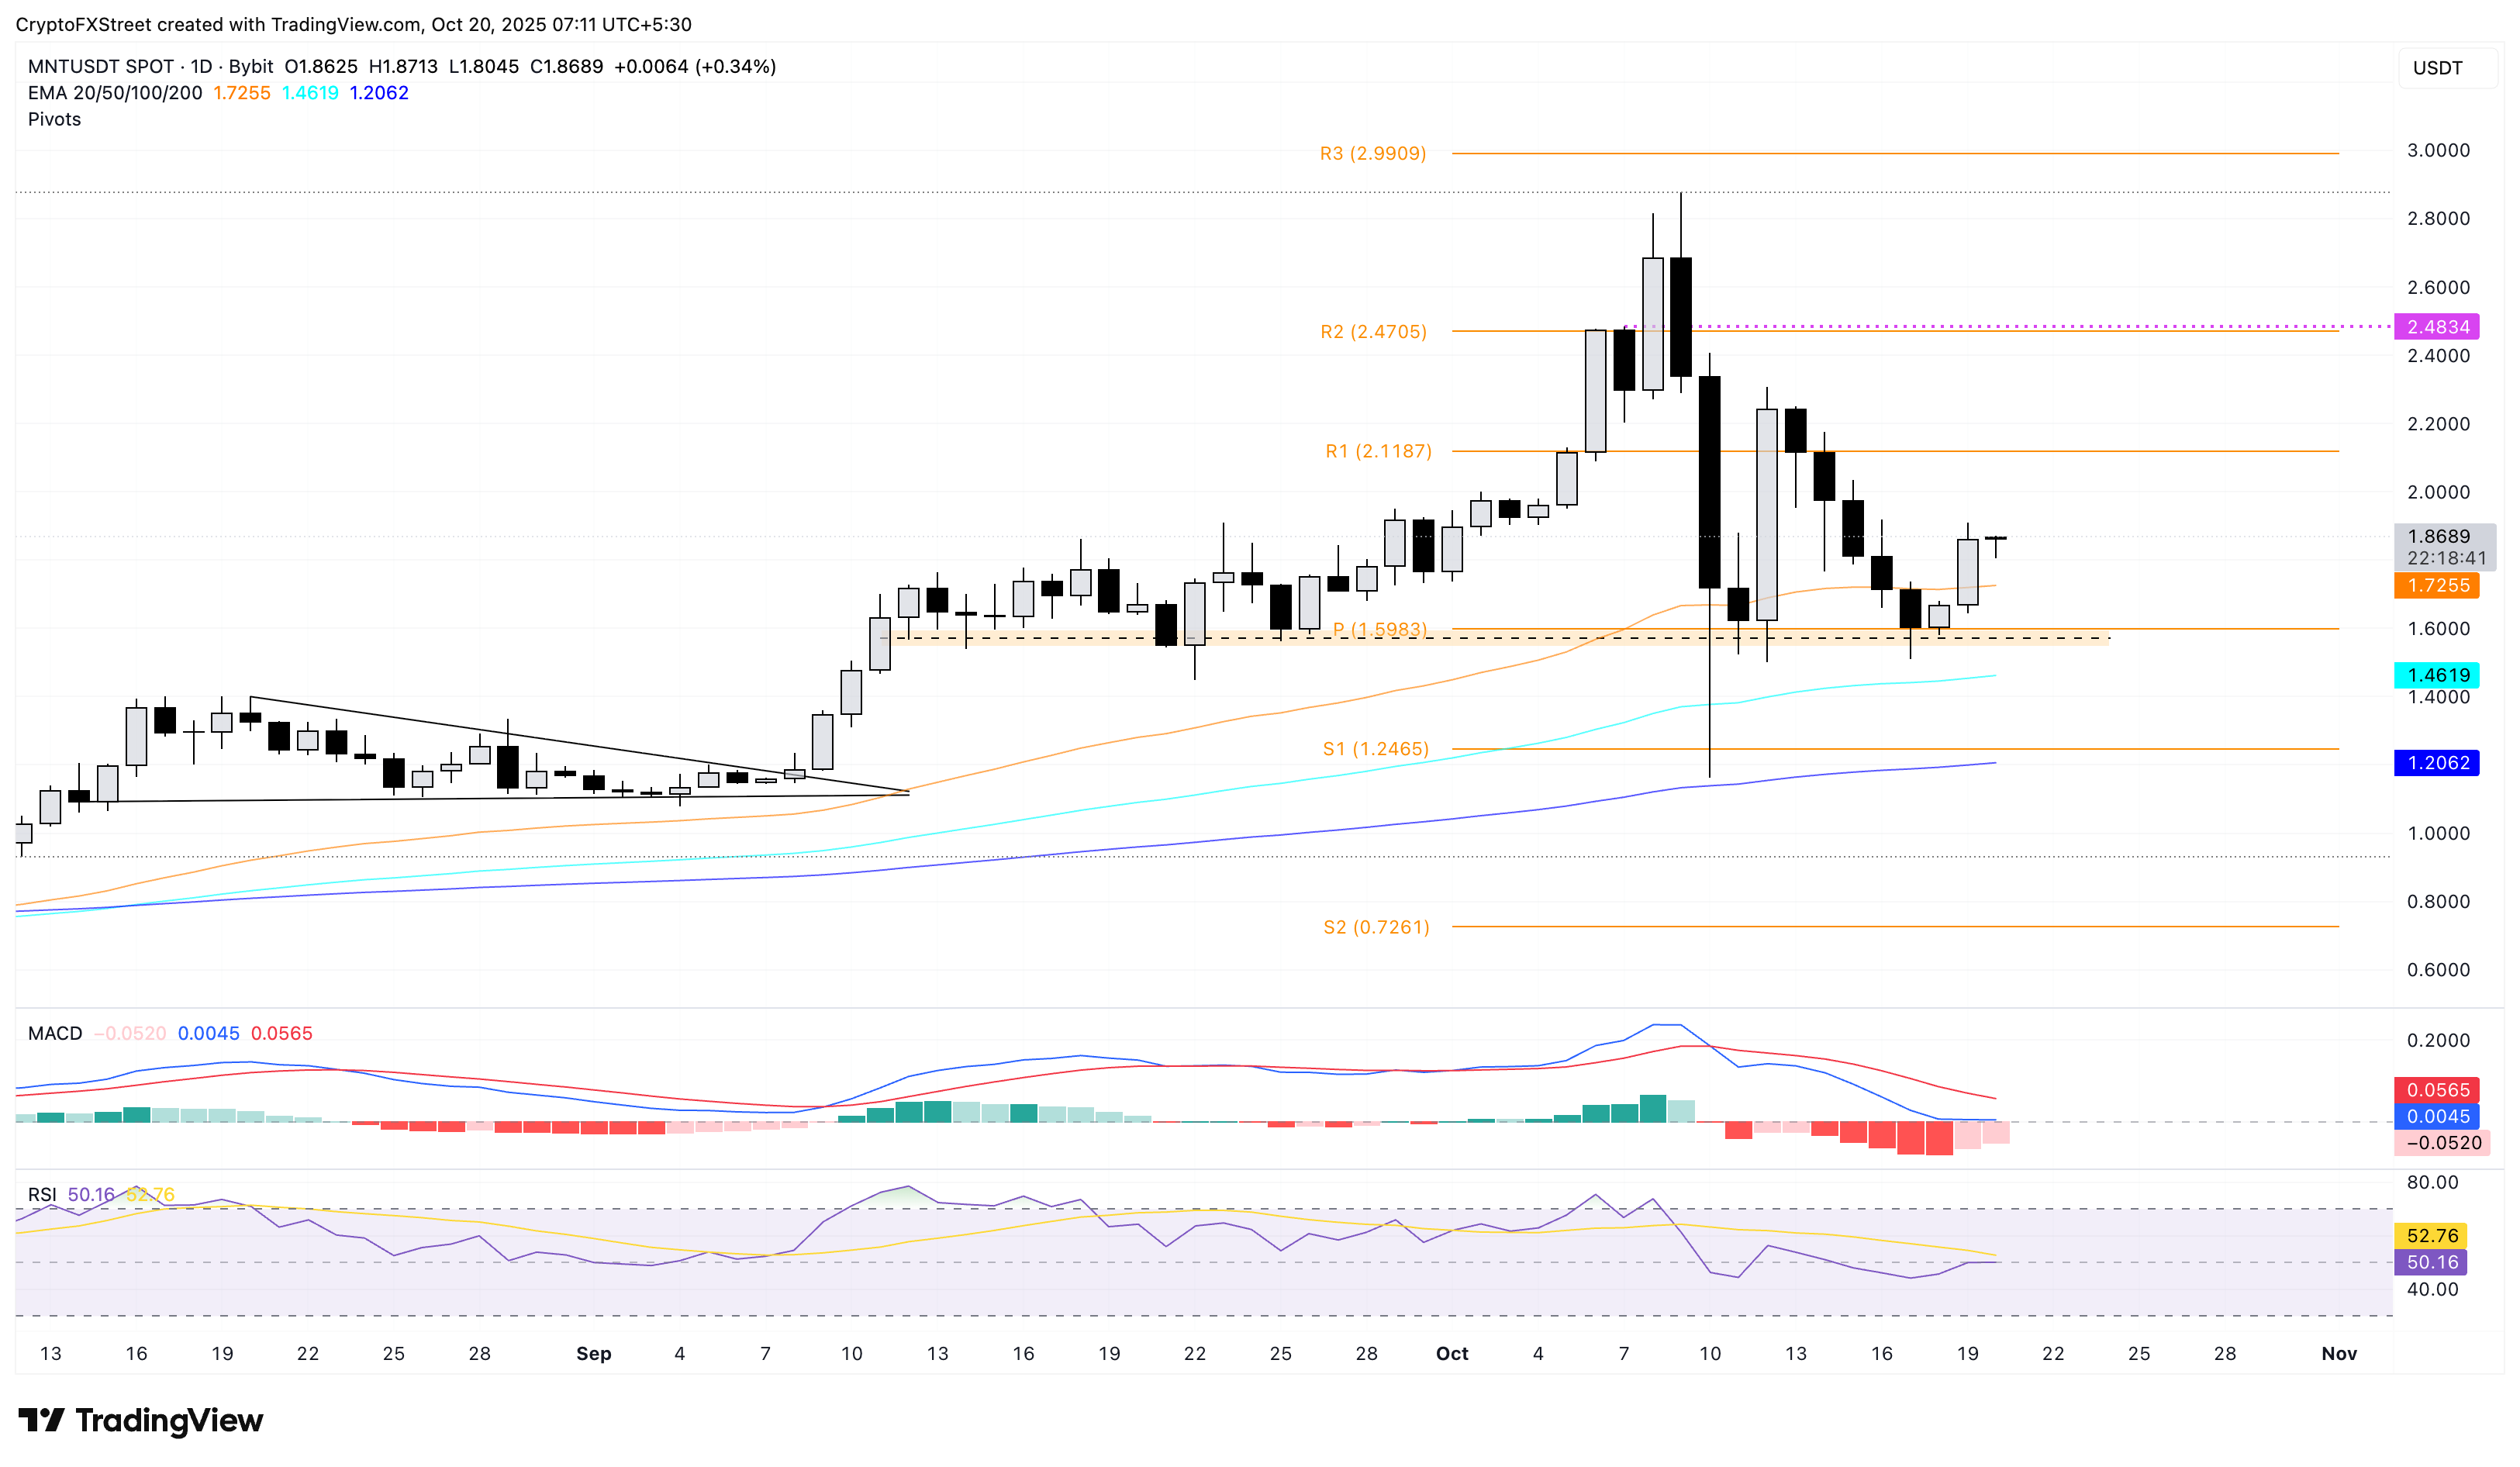
MNT/USDT daily price chart.
If Mantle flips back to the $1.59 level, a potential close below it could threaten the 100-day Exponential Moving Average (EMA) at $1.46.
Zcash recovery eyes $500
Zcash takes a breather after three consecutive days of uptrend, which marks a V-shaped recovery in the privacy coin. ZEC trades above $240 at press time, approaching a local resistance trendline at $250 on the 4-hour chart, formed by connecting the October 11 and October 13 peaks.
A decisive close above this level would confirm the trendline breakout, potentially targeting the R1 Pivot Point level at $288.
The uptrending MACD and signal line approach the zero line, nearing a bullish shift in momentum. Furthermore, the RSI at 58, pointing upward, surpasses the neutral zone, indicating a rise in buying pressure.
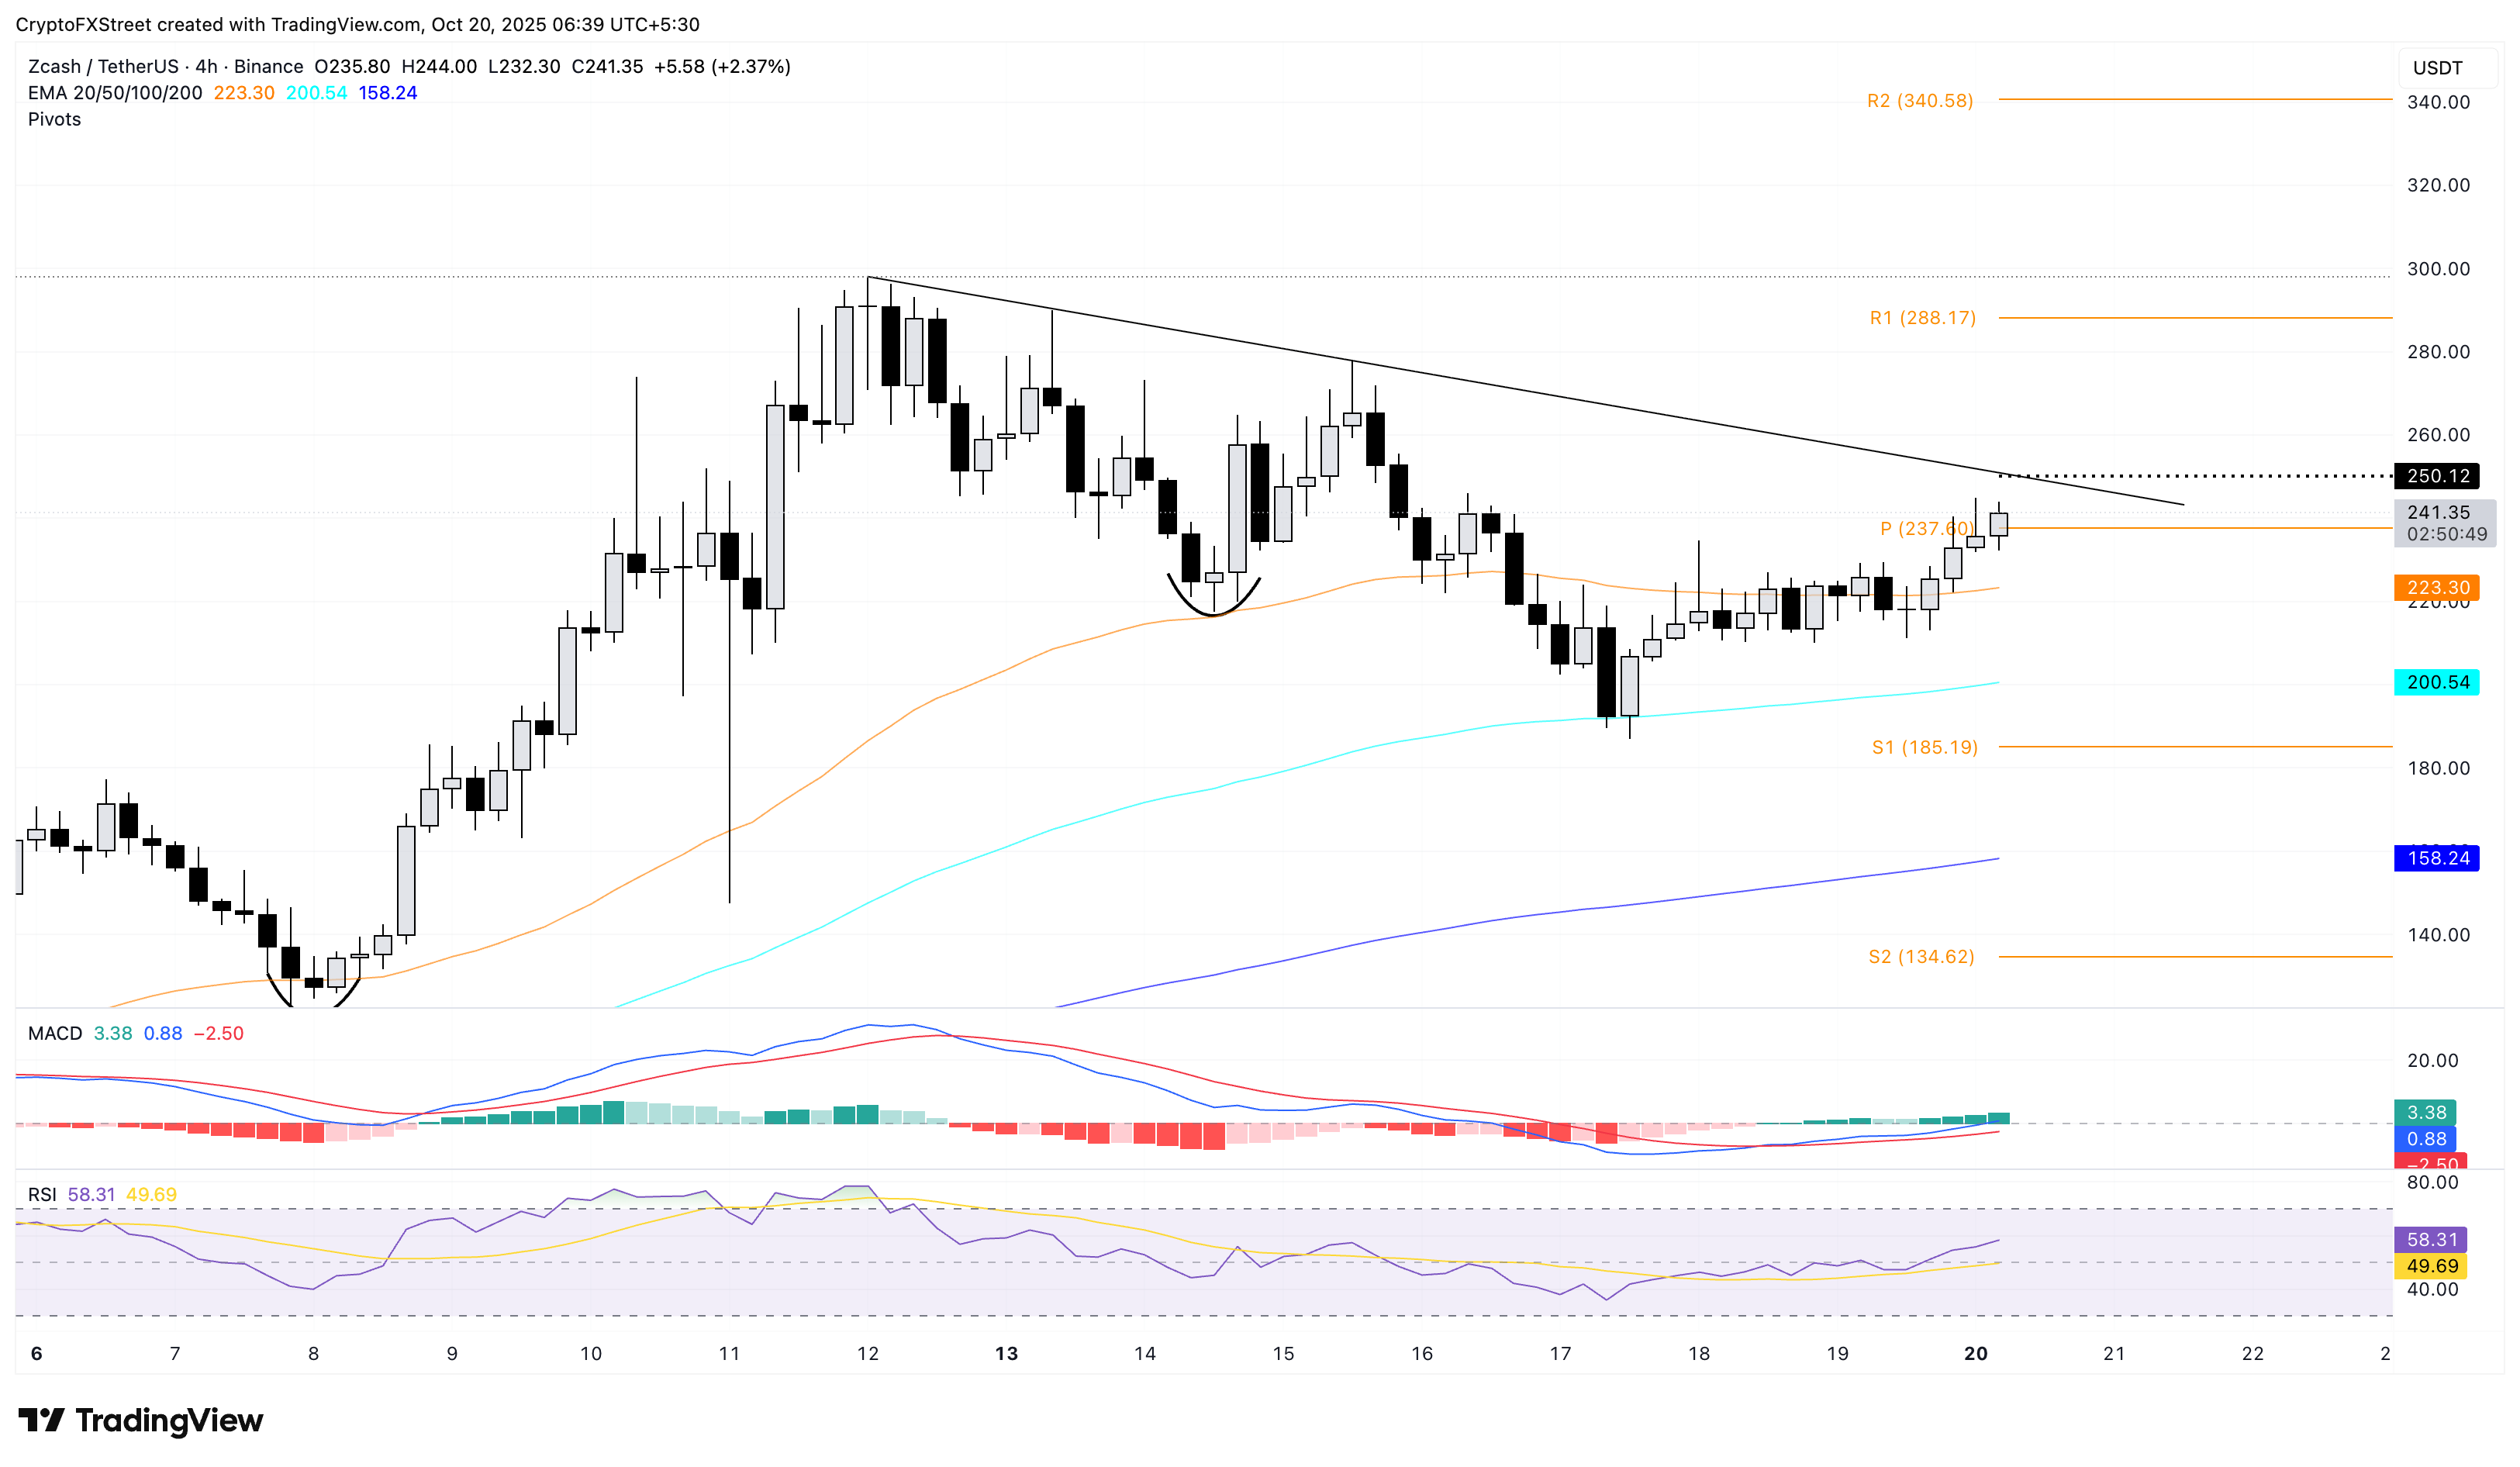
ZEC/USDT 4-hour price chart.
Looking down, a potential reversal in Zcash could test the 50-period and 100-period EMAs on the 4-hour chart at $223 and $200, respectively.
Bittensor approaches key resistance trendline at $250
Bittensor holds above the $400 psychological level as the rebound from Friday’s low at $342 fueled the weekend recovery. At the time of writing, TAO trades above $430 on Monday, edging lower by 1% on the day.
If TAO flips the intraday pullback, it could extend the recovery for the fourth consecutive day, targeting the $500 milestone.
Technical indicators on the daily chart display steady bullish momentum as the MACD rises with its signal line while the RSI rebounds to 62 from the neutral region.
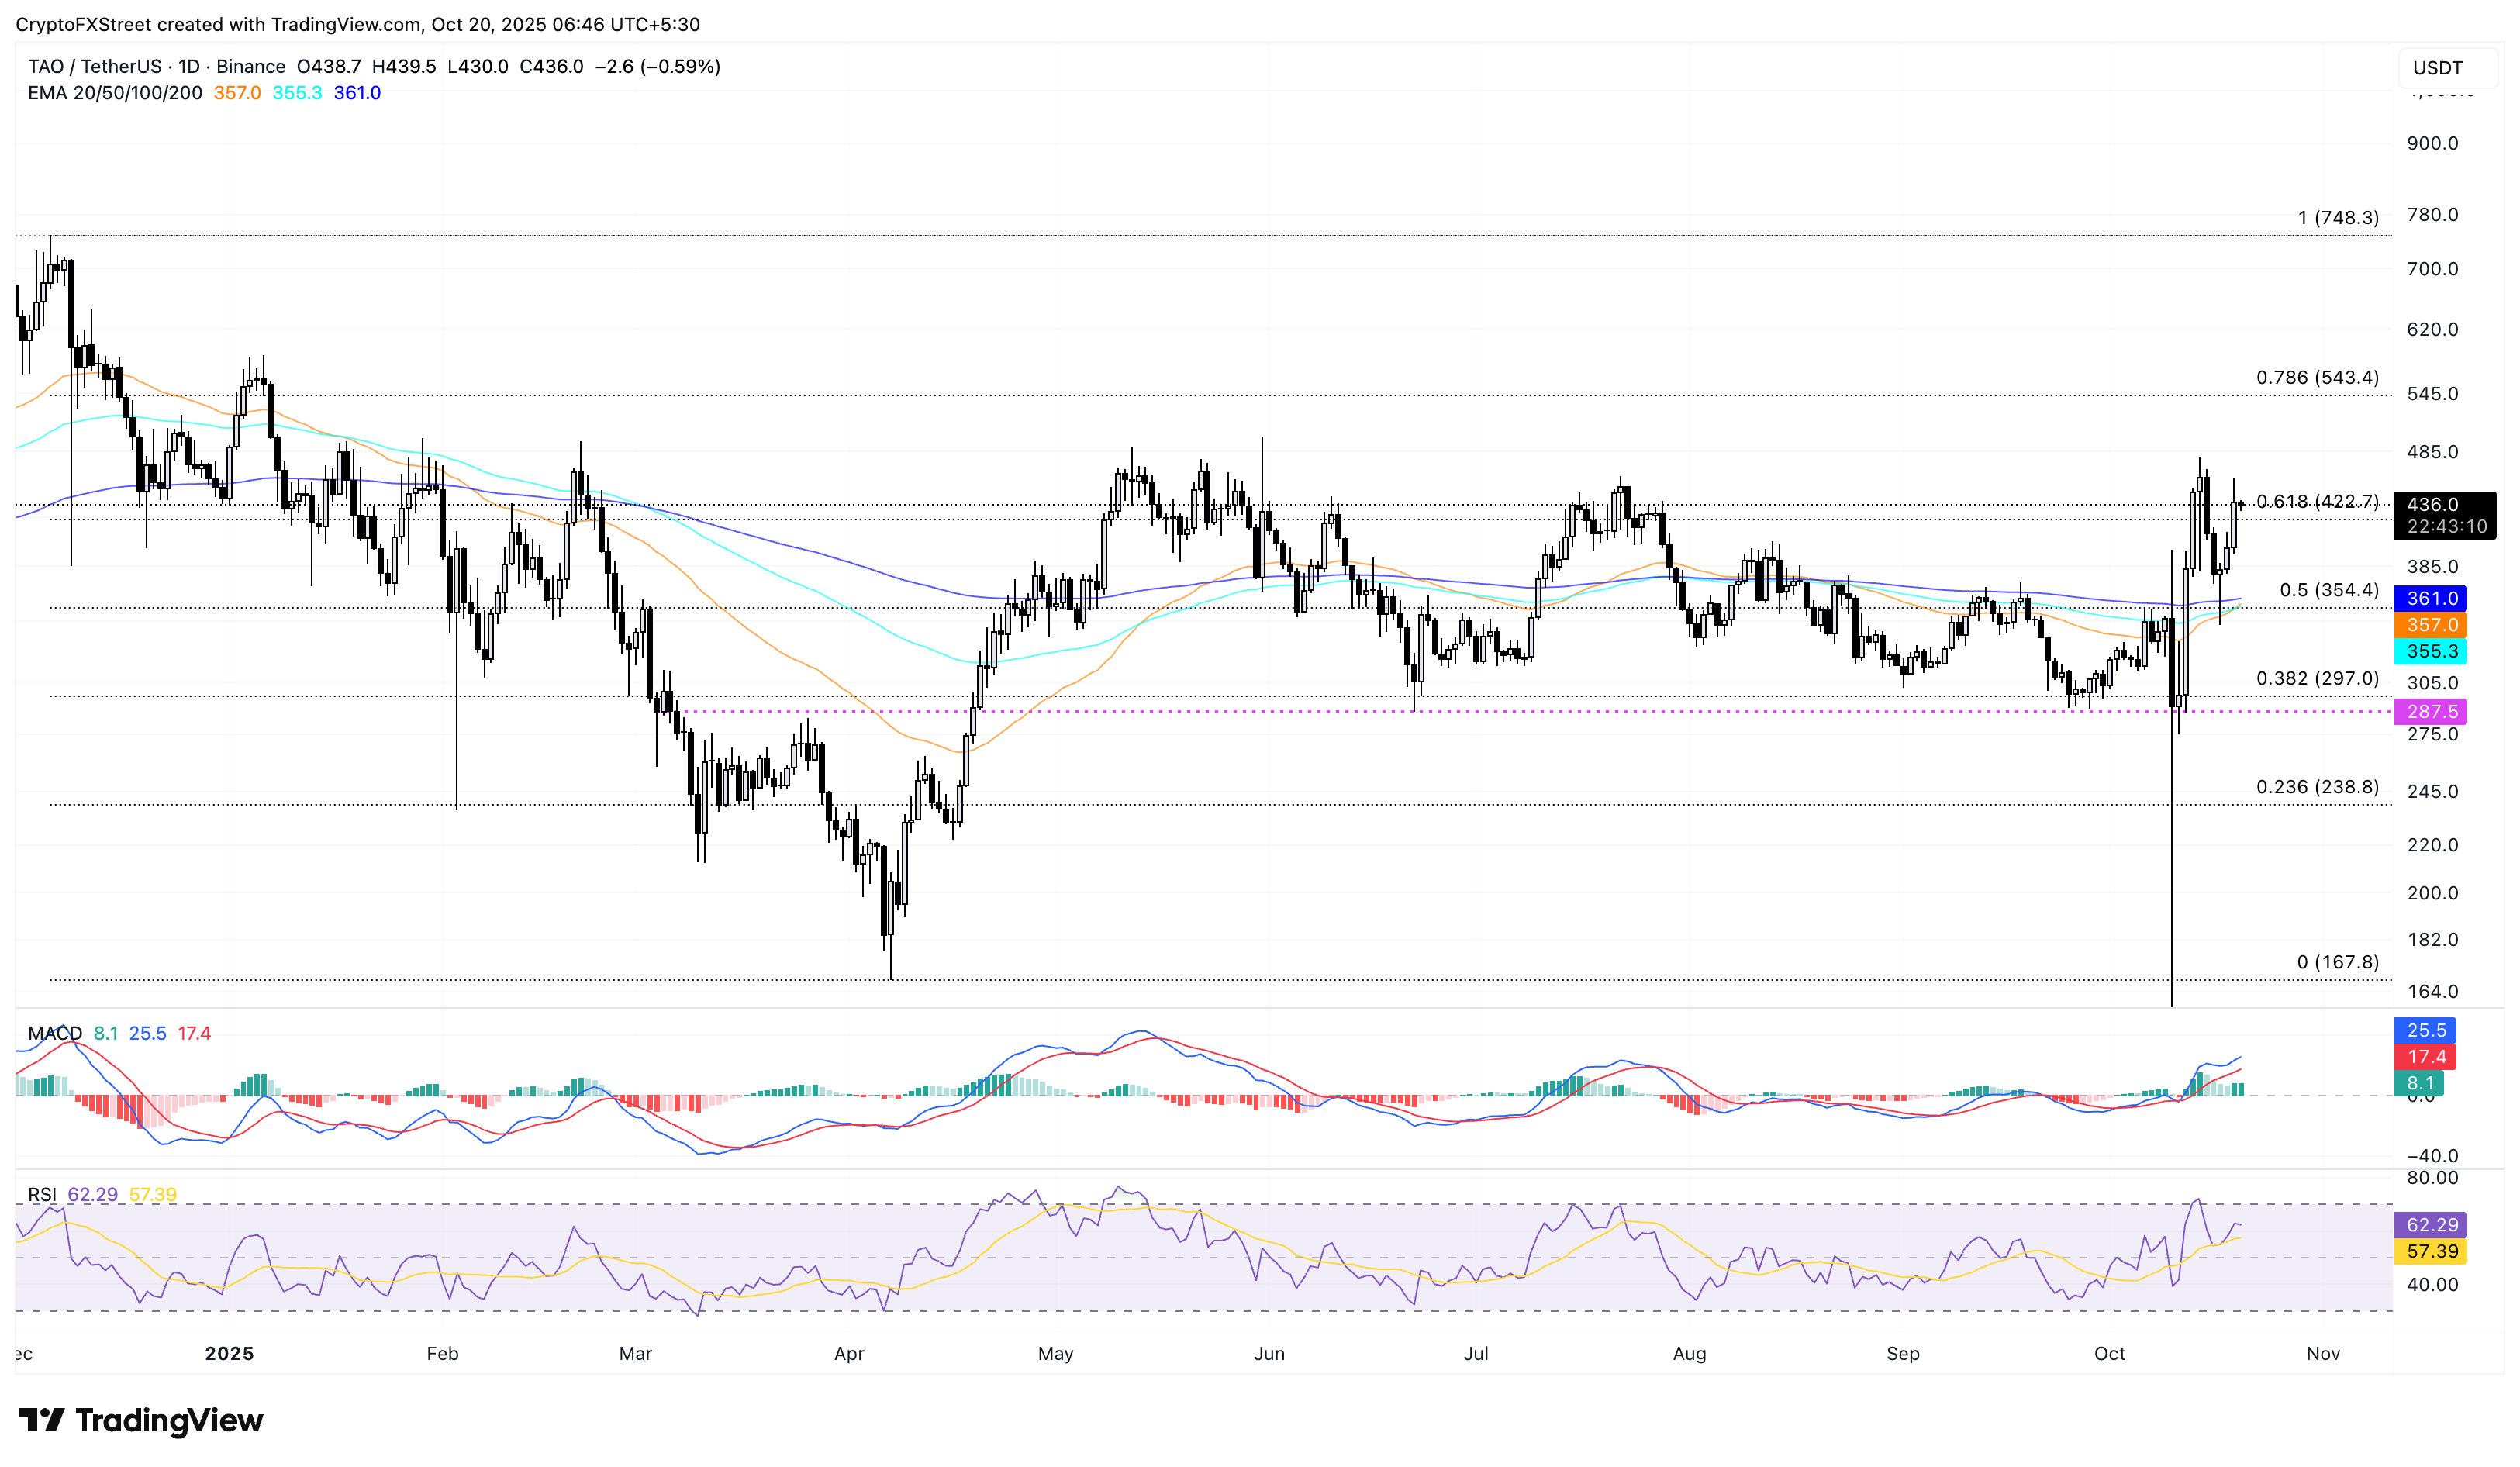
TAO/USDT daily price chart.
If TAO drops below the $400 mark, it could test the 200-day EMA at $361.
บทความแนะนำ


