
Aster Price Forecast: Record high fees and TVL spark bullish potential
- Aster nears upper symmetrical triangle boundary, with bulls eyeing a potential breakout.
- Aster records the highest 24-hour fees among DeFi protocols as the TVL hits a record high.
- Aster increases incentives for longer position holds with more Rh points in the final epoch of Genesis Stage 2.
The Aster (ASTER) price is trading up by 5% at the time of writing on Monday, preparing for a breakout from a symmetrical triangle pattern. The dark pool decentralized exchange (DEX) token surpasses Tether’s USDT stablecoin in 24-hour fees, alongside its Total Value Locked (TVL) reaching a record high, which bolsters its bullish potential.
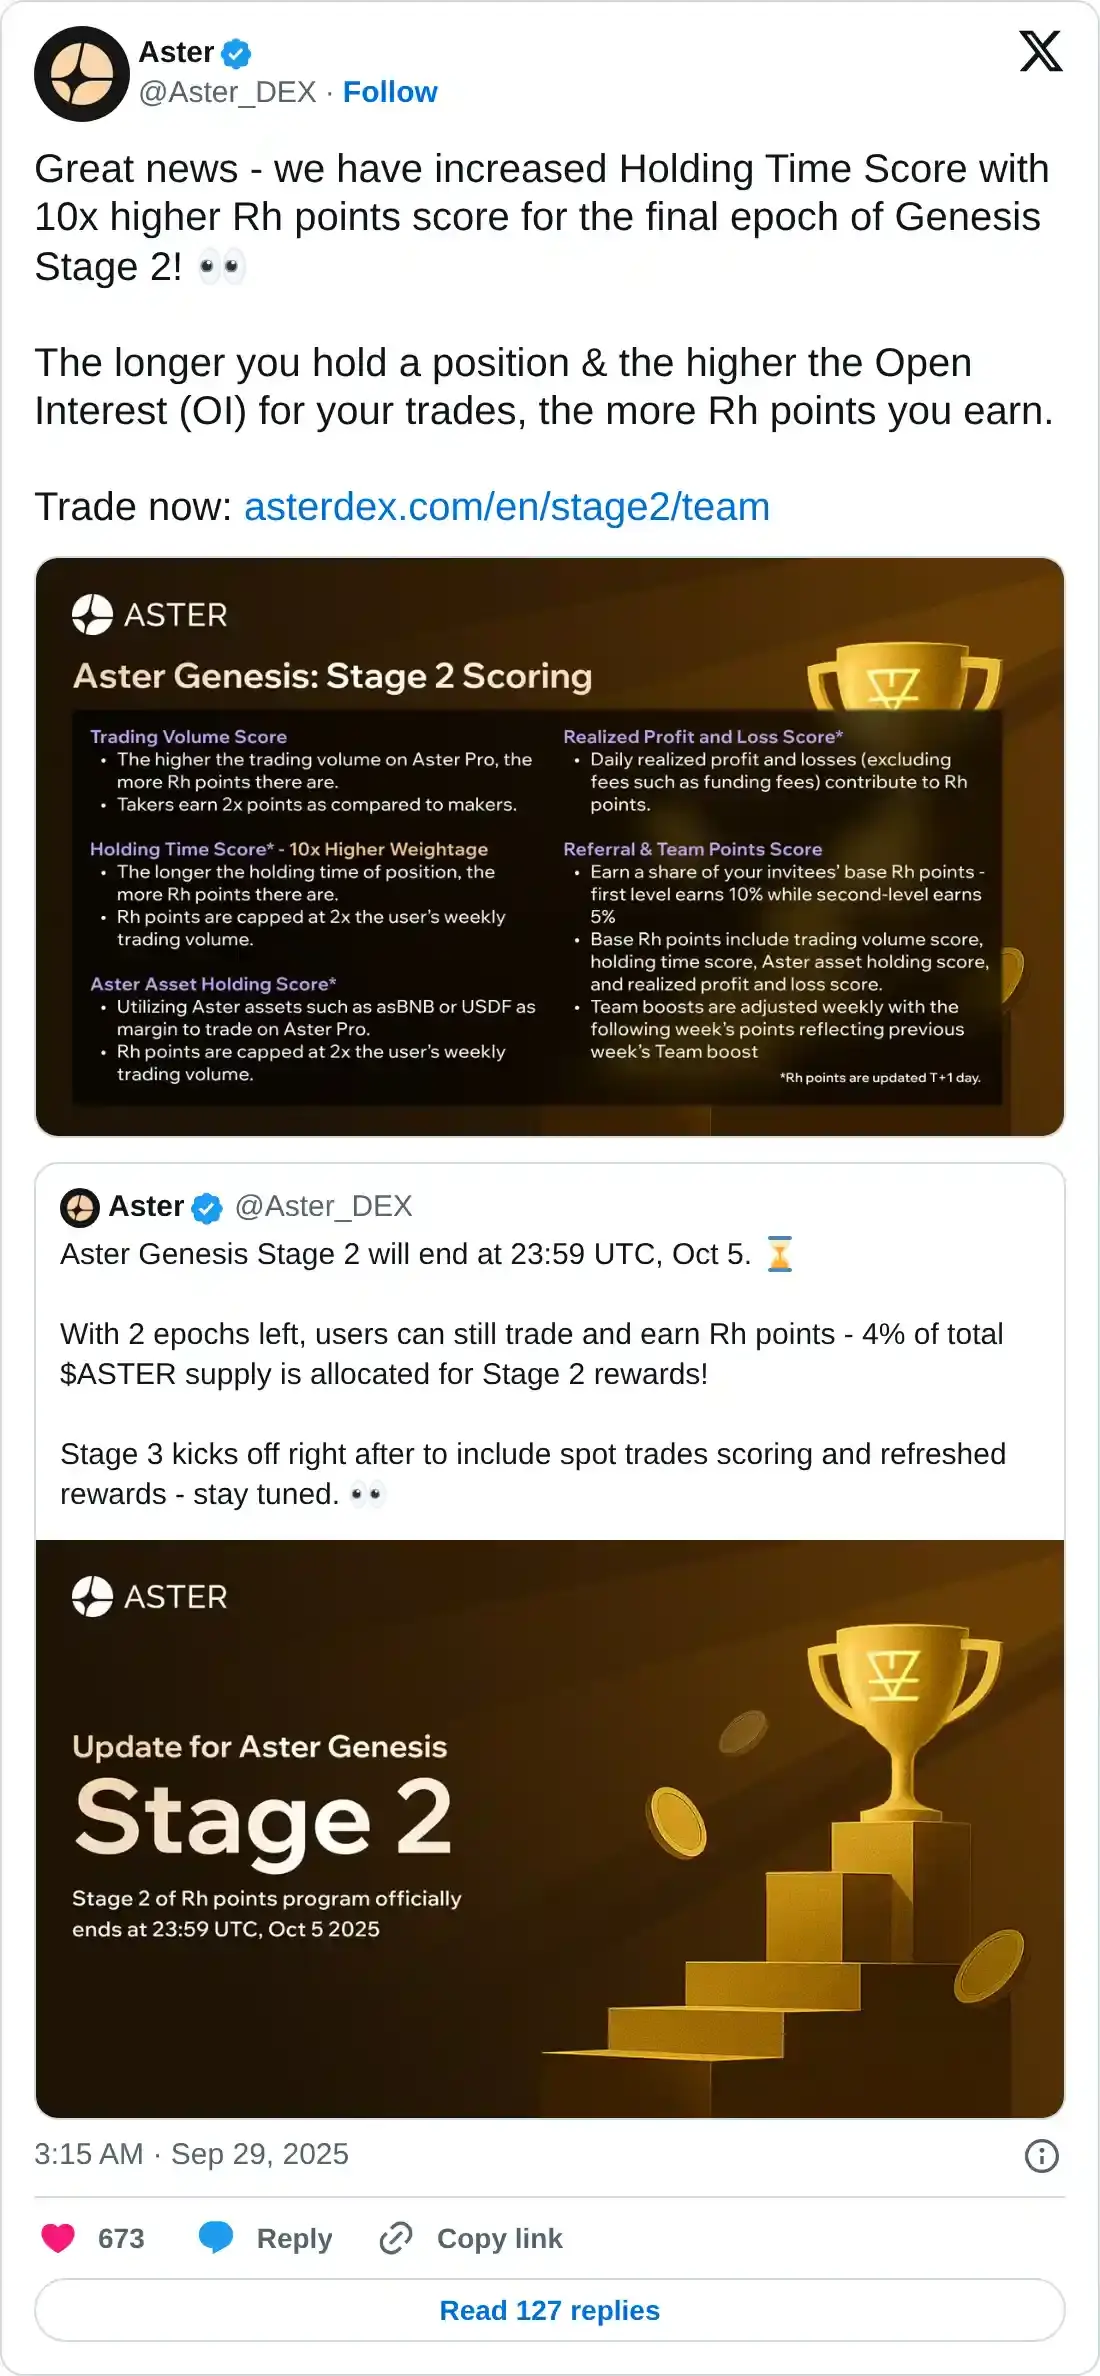
Furthermore, Aster has announced additional benefits for traders holding positions for extended periods during its final epoch of Genesis Stage 2, aiming to boost market sentiment.
Aster posts new DeFi records
DeFiLlama data shows that Aster collected more fees in the last 24 hours than Tether’s USDT stablecoin, reflecting the heightened activity on the DEX platform. The data reveals that Aster collected $25.06 million compared to $22.21 million by Tether.
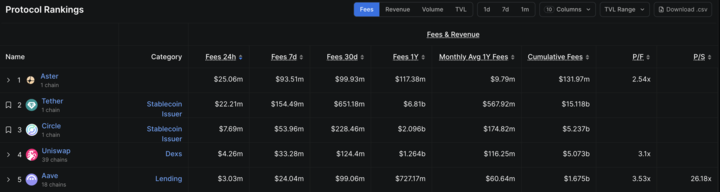
DeFi protocols. Source: DeFiLlama
Additionally, the TVL on Aster has reached a record high of $2.272 billion, indicating a steady rise in user activity on the platform.
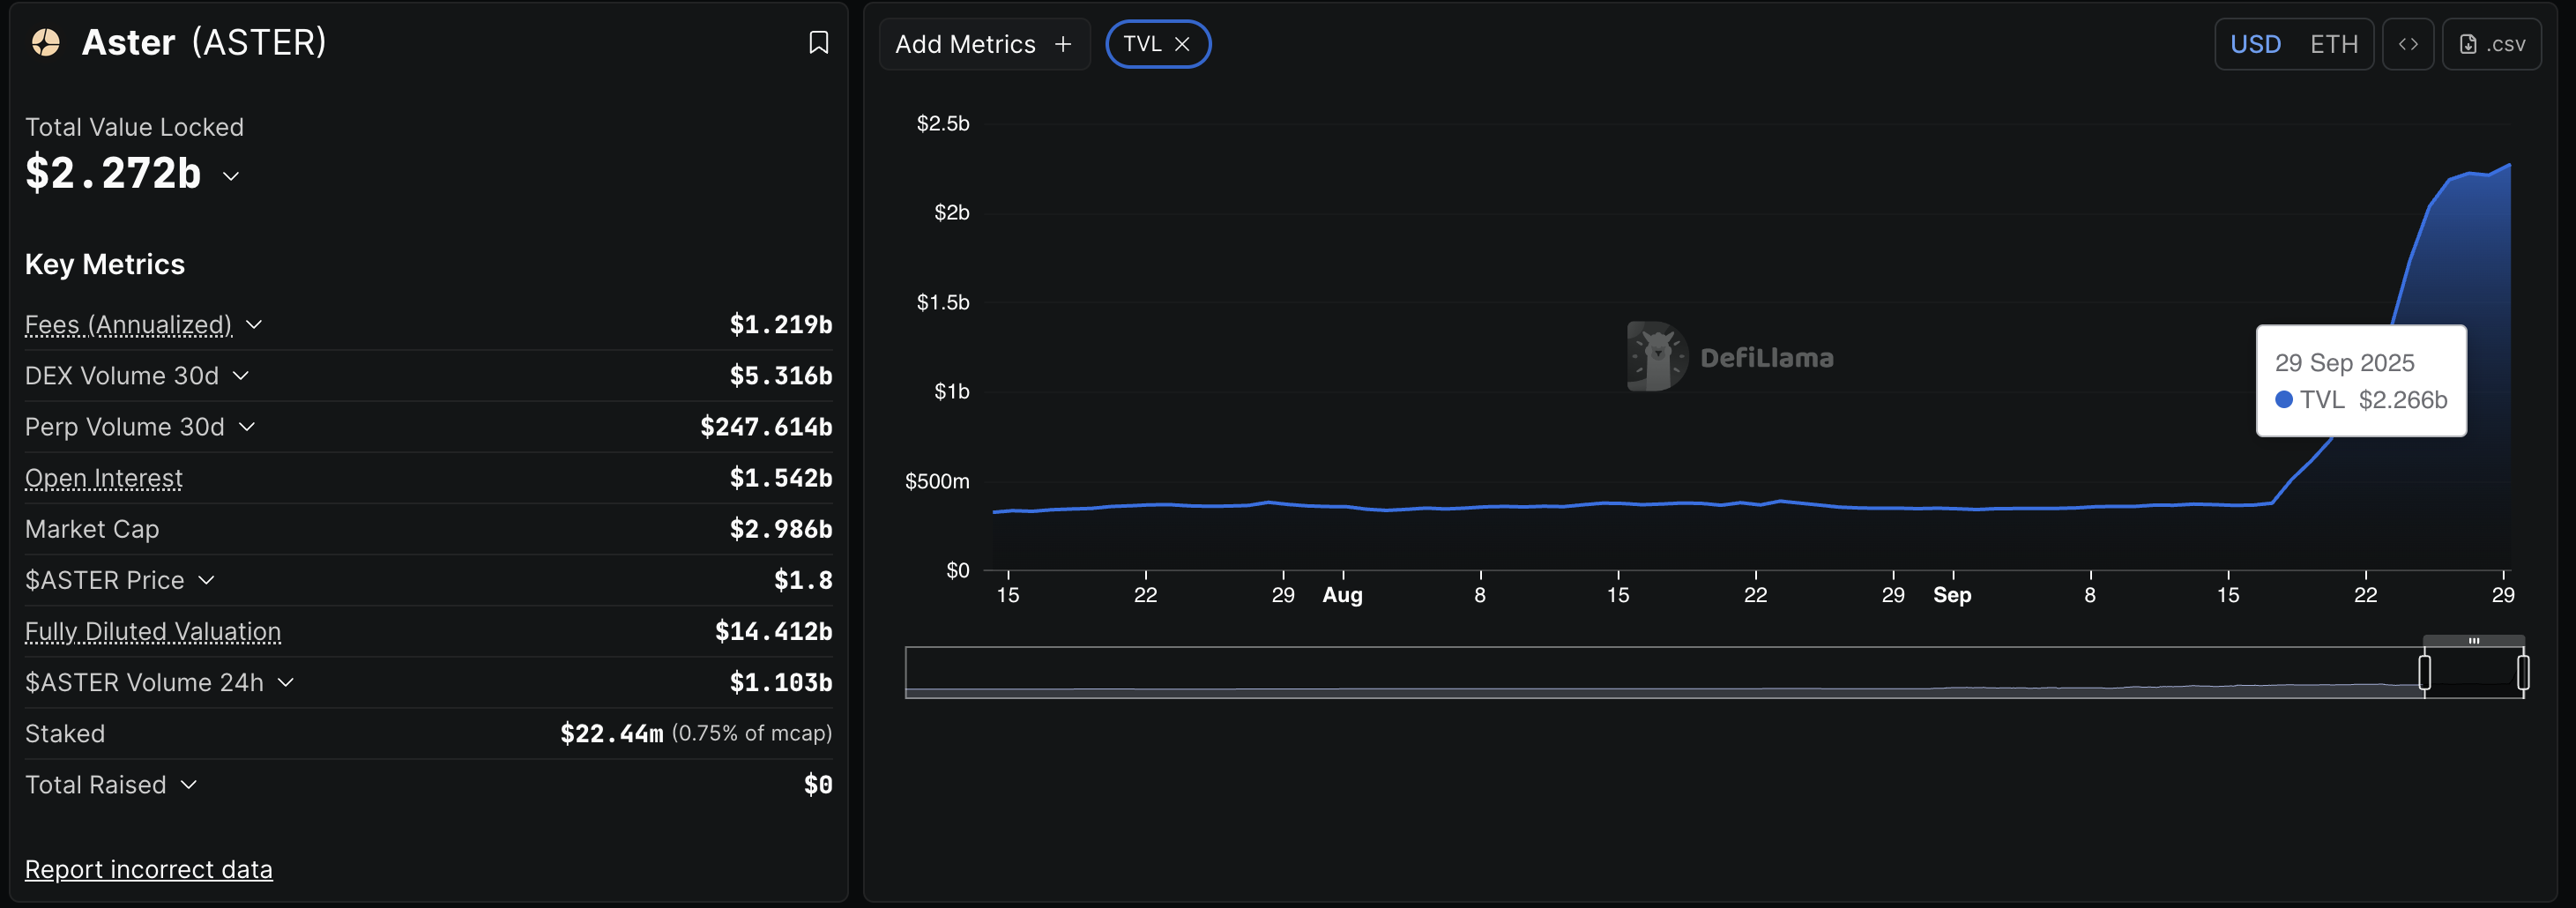
ASTER TVL. Source: DeFiLlama
Adding to the rising activity, Aster announced a reward of up to 10 times the Rh points based on the position holding time, capped at 2 times the weekly trading volume. The Rh points serve as incentives for traders to boost interest and help determine shares from 4% of the total ASTER supply, secured for airdrops to the community.
Aster eyes further gains with a triangle breakout rally
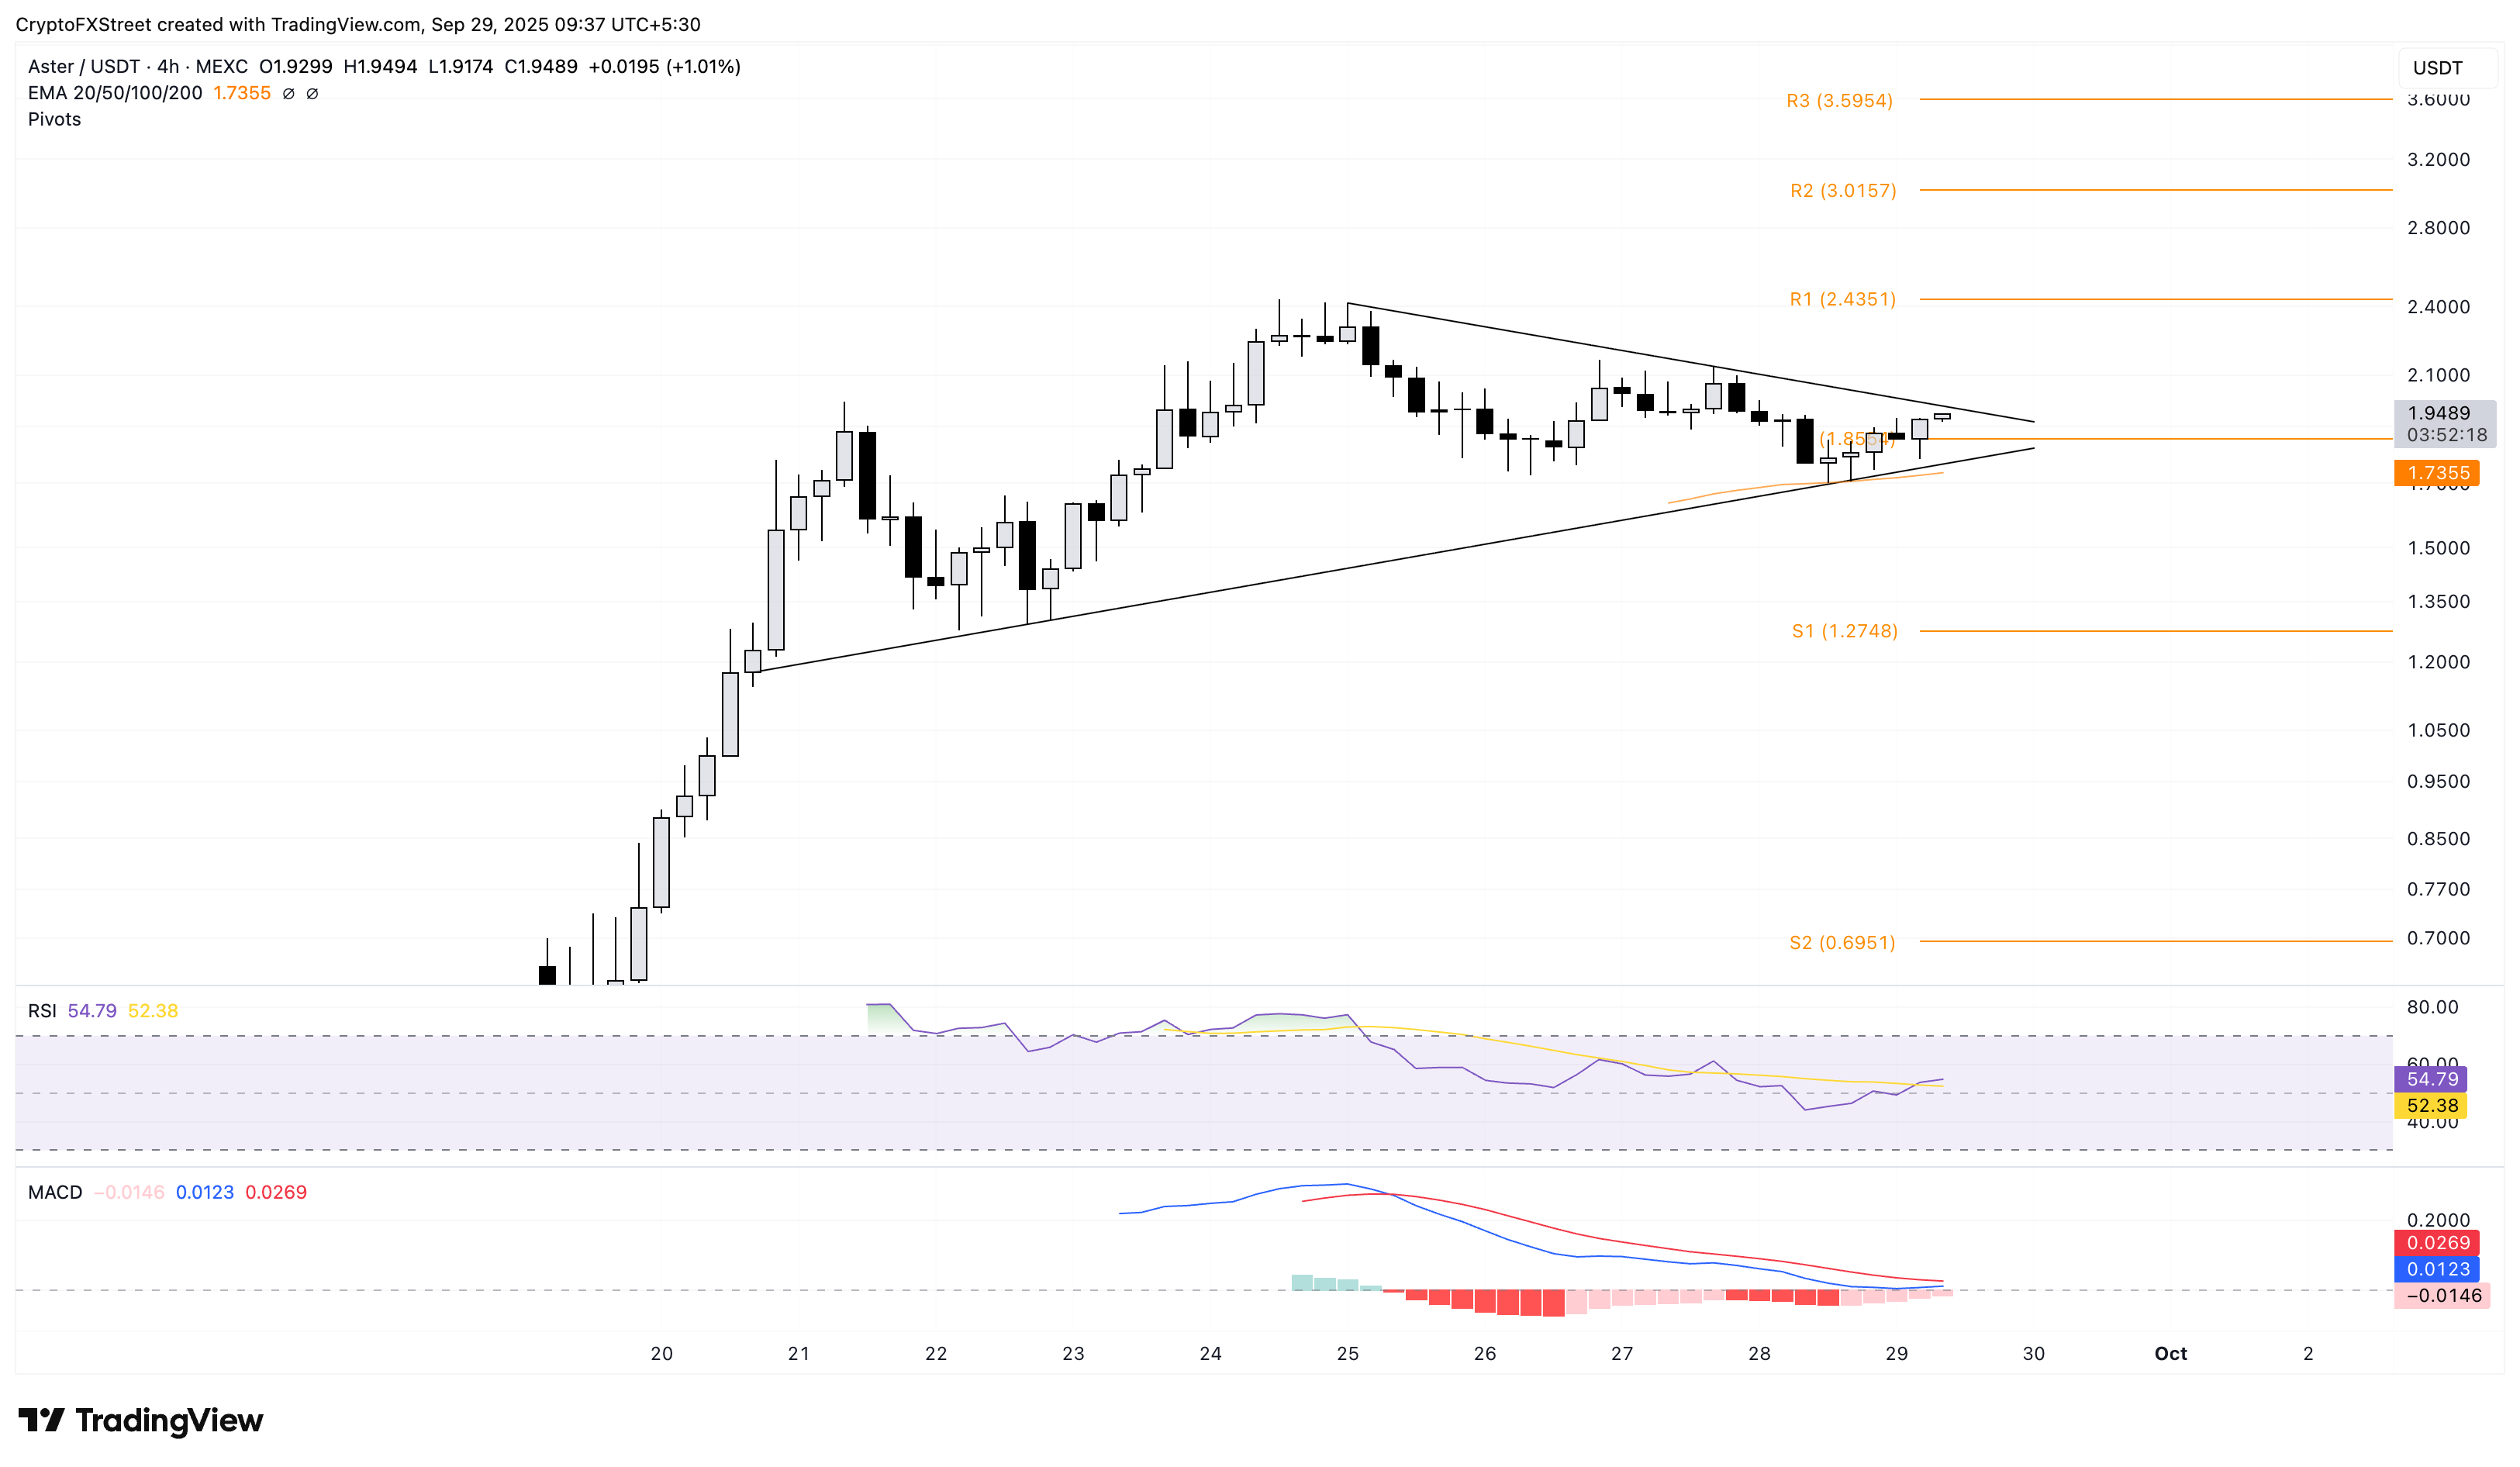
Aster edges higher within a symmetrical triangle pattern on the 4-hour chart, approaching its resistance trendline. The overhead trendline is close to the $2.00 round figure, which would act as a key psychological resistance.
A decisive close above this level could extend the ASTER rally to the R1 pivot level at $2.43, for a nearly 20% upside.
The technical indicators on the same chart highlight an increased possibility of a trend reversal as the Moving Average Convergence Divergence (MACD) approaches its signal line for a crossover. Furthermore, the Relative Strength Index (RSI) crosses above its midpoint at 54, suggesting that buying pressure is resurfacing.
ASTER/USDT daily price chart.
However, a potential slip below the 50-period Exponential Moving Average (EMA) at $1.73 would confirm the breakdown of the triangle pattern. The immediate area of support for the DEX token lies at the S1 pivot level at $1.27.
บทความแนะนำ


