
Meme Coins Price Prediction: Dogecoin, Shiba Inu, and Pepe regain bullish momentum
- Dogecoin bounces off a crucial support trendline, eyeing further gains to $0.30.
- Shiba Inu rebounds from a 200-period EMA as bullish momentum returns.
- Pepe holds above the $0.00001000 psychological level, with bulls targeting last week’s high.
Meme coins such as Dogecoin (DOGE), Shiba Inu (SHIB), and Pepe (PEPE) are regaining momentum, driven by increased capital inflows in the derivatives markets. This sudden increase in enthusiasm aligns with the US Federal Reserve’s decision of a 25 basis point reduction in interest rates. The technical outlook shows early signs of a potential rally as bullish momentum builds.
Derivatives data signal increased optimism
A rally in meme coins is generally speculation-driven, making them a high-risk segment in the broader cryptocurrency market. A rise in trader confidence could provide early signals of a potential rally.
CoinGlass data shows that the Open Interest (OI) of DOGE, SHIB, and PEPE has increased by 3%, 5% and 7% to reach $5.55 billion, $246 million, and $784 million, respectively. This increase in capital inflows in the top meme coins suggests that the trader sentiment has shifted to risk-on, confident in the short-term recovery.
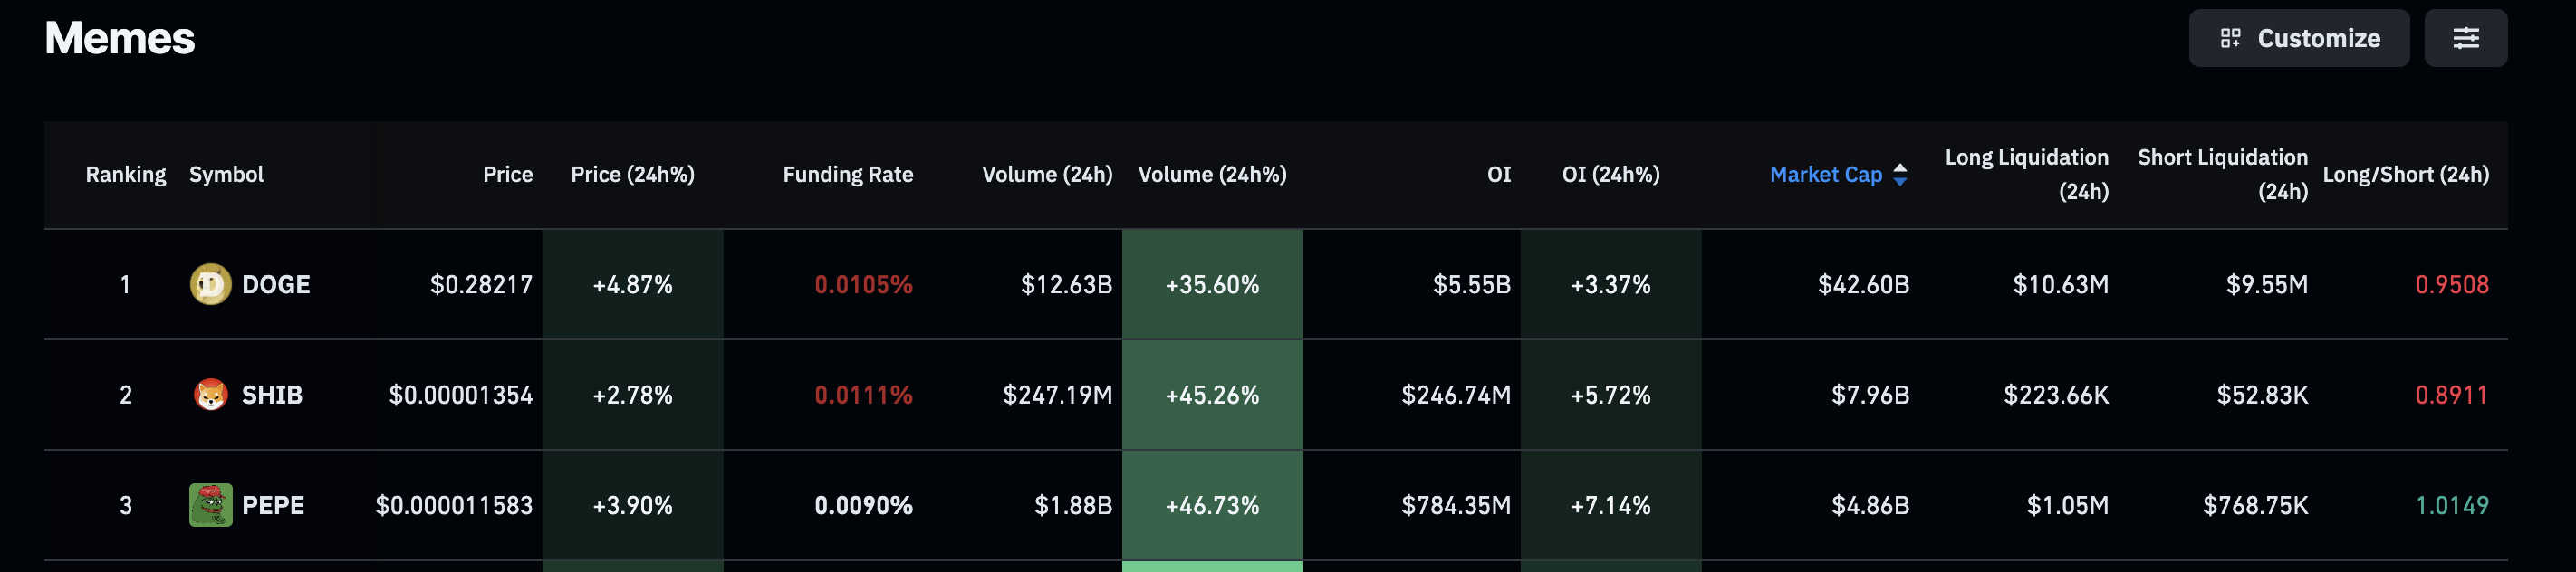
Meme coins derivatives. Source: CoinGlass
Dogecoin's recovery run could surpass $0.30
Dogecoin holds steady at press time on Thursday, following the 4.67% surge from the previous day. The meme coin bounces off a support trendline formed by connecting the lows of September 9 and September 17 on the 4-hour chart.
The upward trend could face immediate resistance at $0.3146, aligning with the R2 pivot level, which indicates an upside potential of nearly 10%.
Adding to the trend momentum, the Relative Strength Index (RSI) on the 4-hour chart stands at 63, displaying further room for growth before reaching the overbought zone. The Moving Average Convergence Divergence (MACD) rebounds from the zero line to cross above its signal line, indicating a resurgence in bullish momentum.
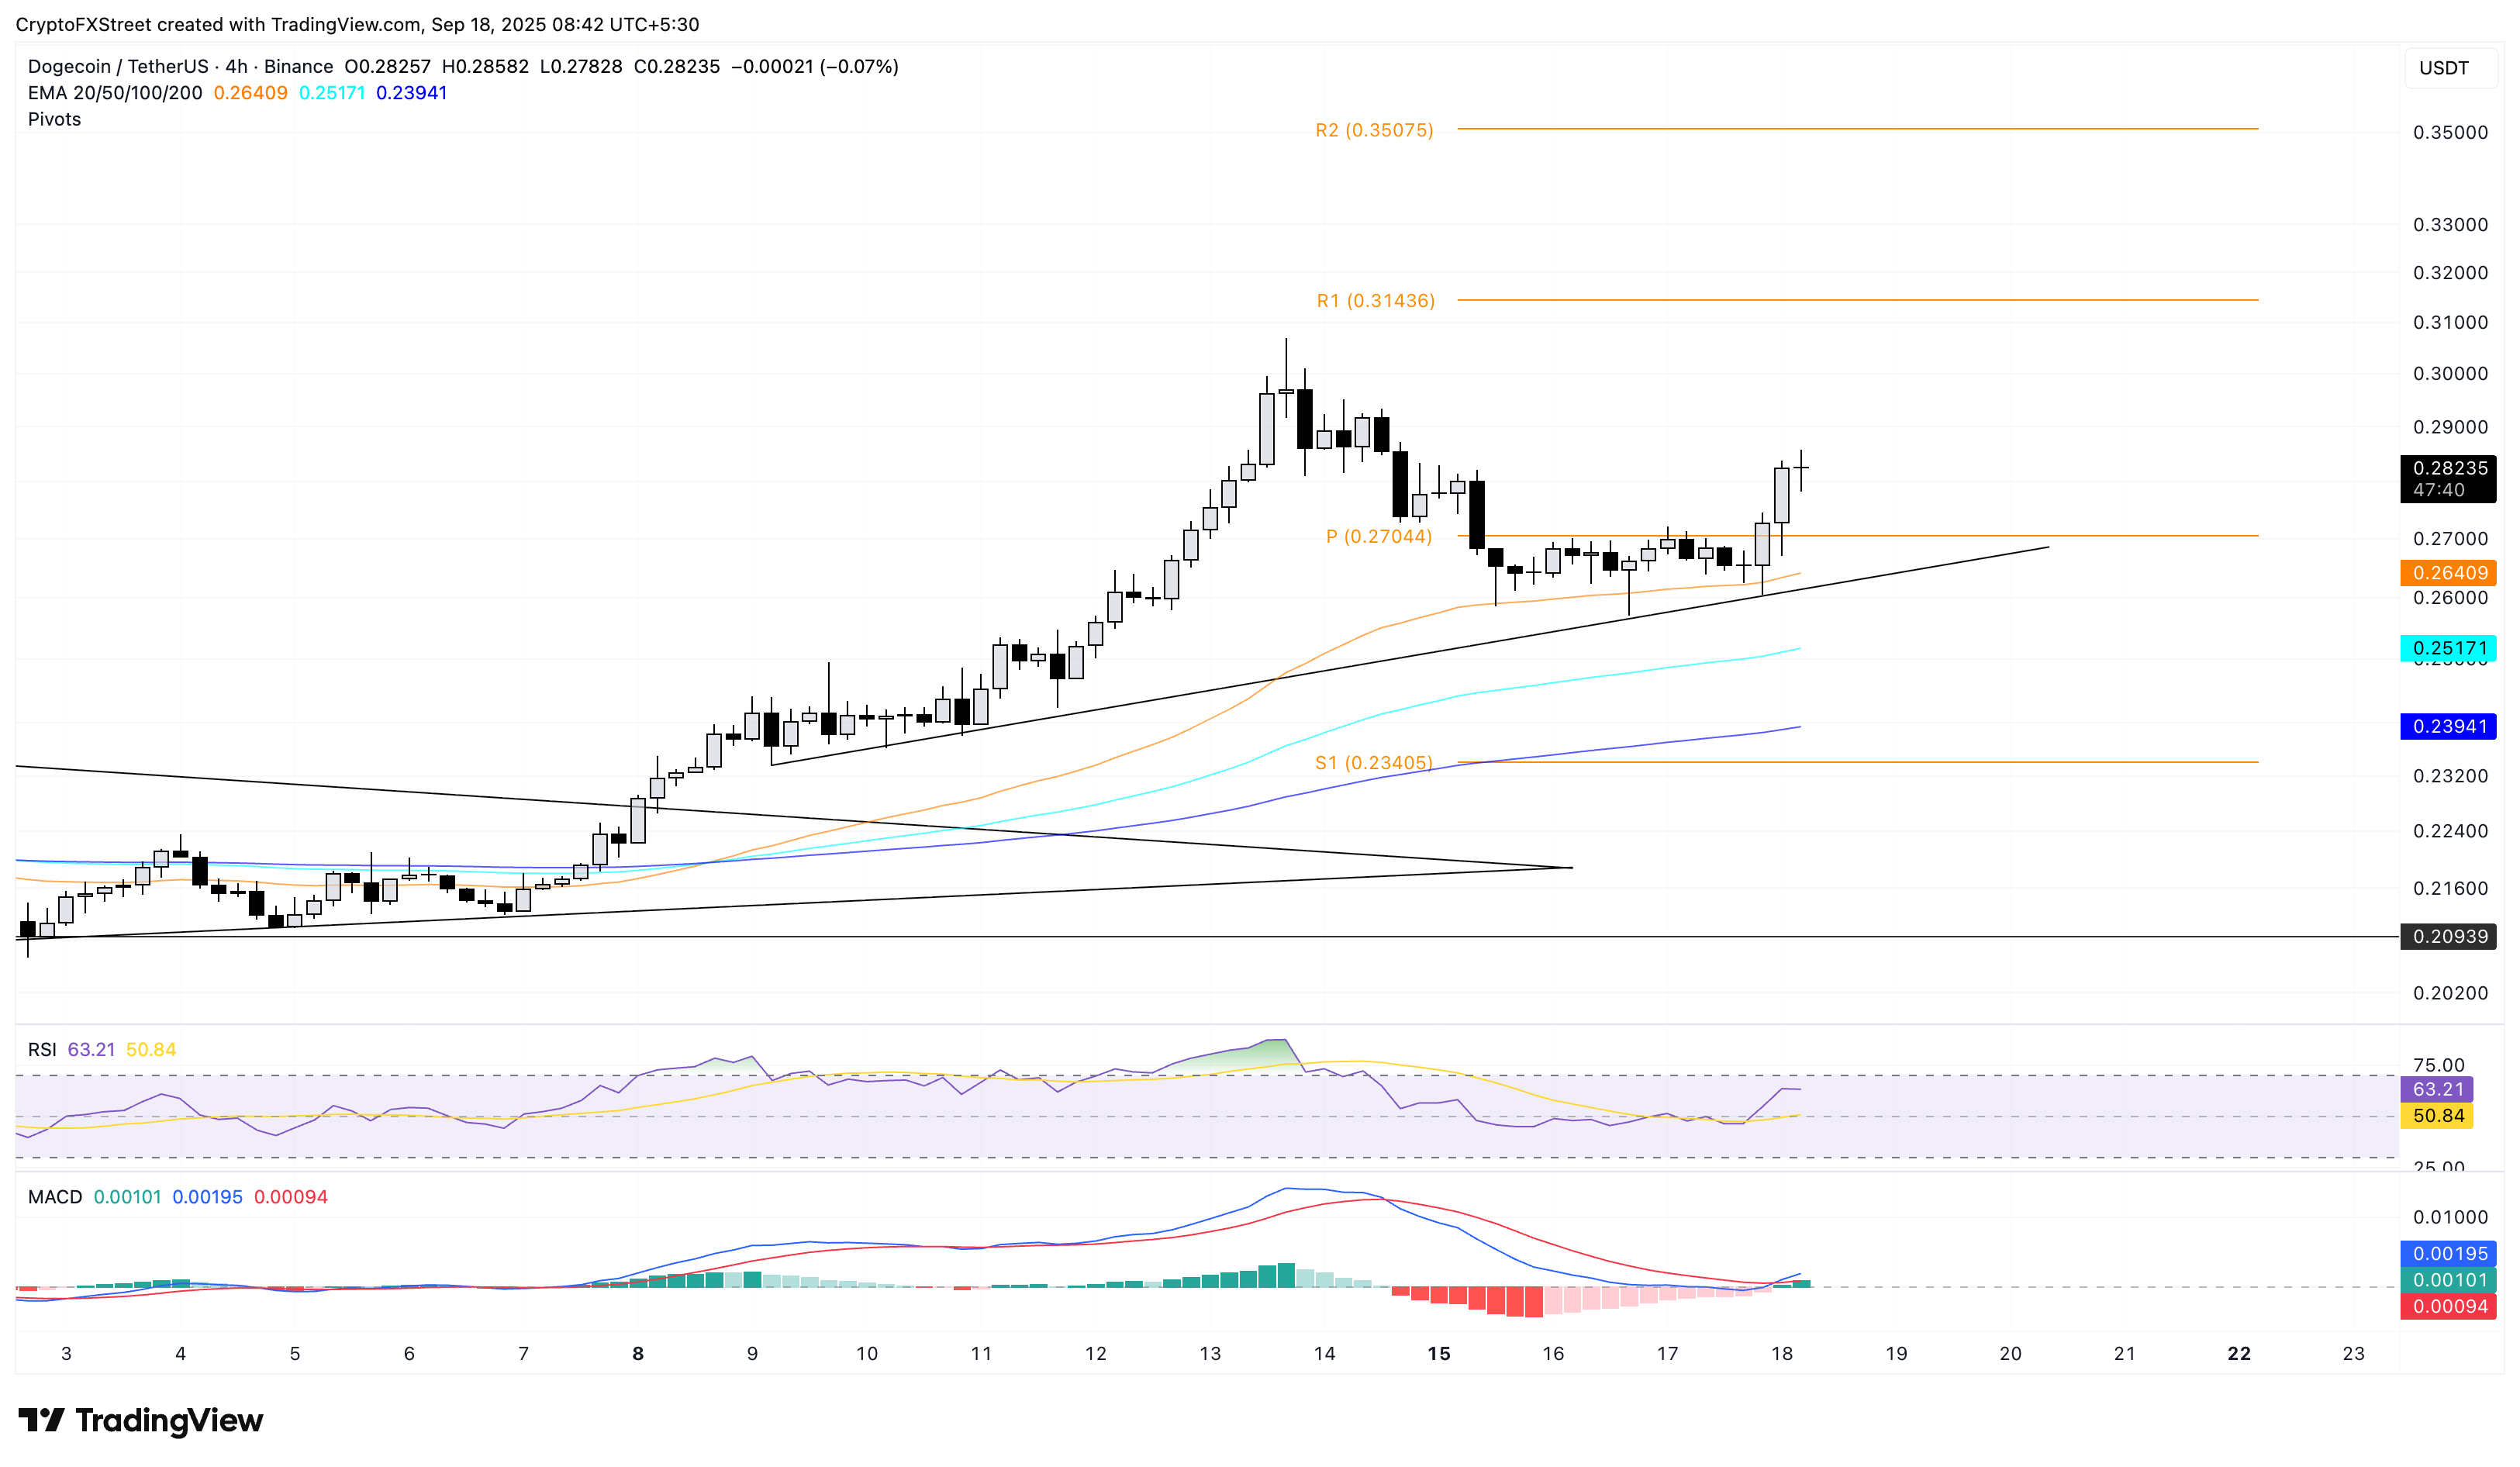
DOGE/USDT daily price chart.
Looking down, if DOGE drops below the 50-period Exponential Moving Average (EMA) at $0.2647, which is closely tracking the support trendline, it could result in a decline to the 100-period EMA at $0.2517.
Shiba Inu rebounds with bulls eyeing further gains
Shiba Inu edges higher by nearly 0.50% at the time of writing on Thursday, extending the uptrend for the third consecutive day. SHIB rebounds from the 200-period EMA on the 4-hour chart, challenging the centre pivot level at $0.00001364.
A decisive close above this level could extend the uptrend to the R1 pivot level at $0.00001488.
The RSI, which crosses above the halfway line at 58, indicates further space for growth. At the same time, the MACD crosses above its signal line, accompanied by a successively rising green histogram bar, indicating a rise in bullish momentum.
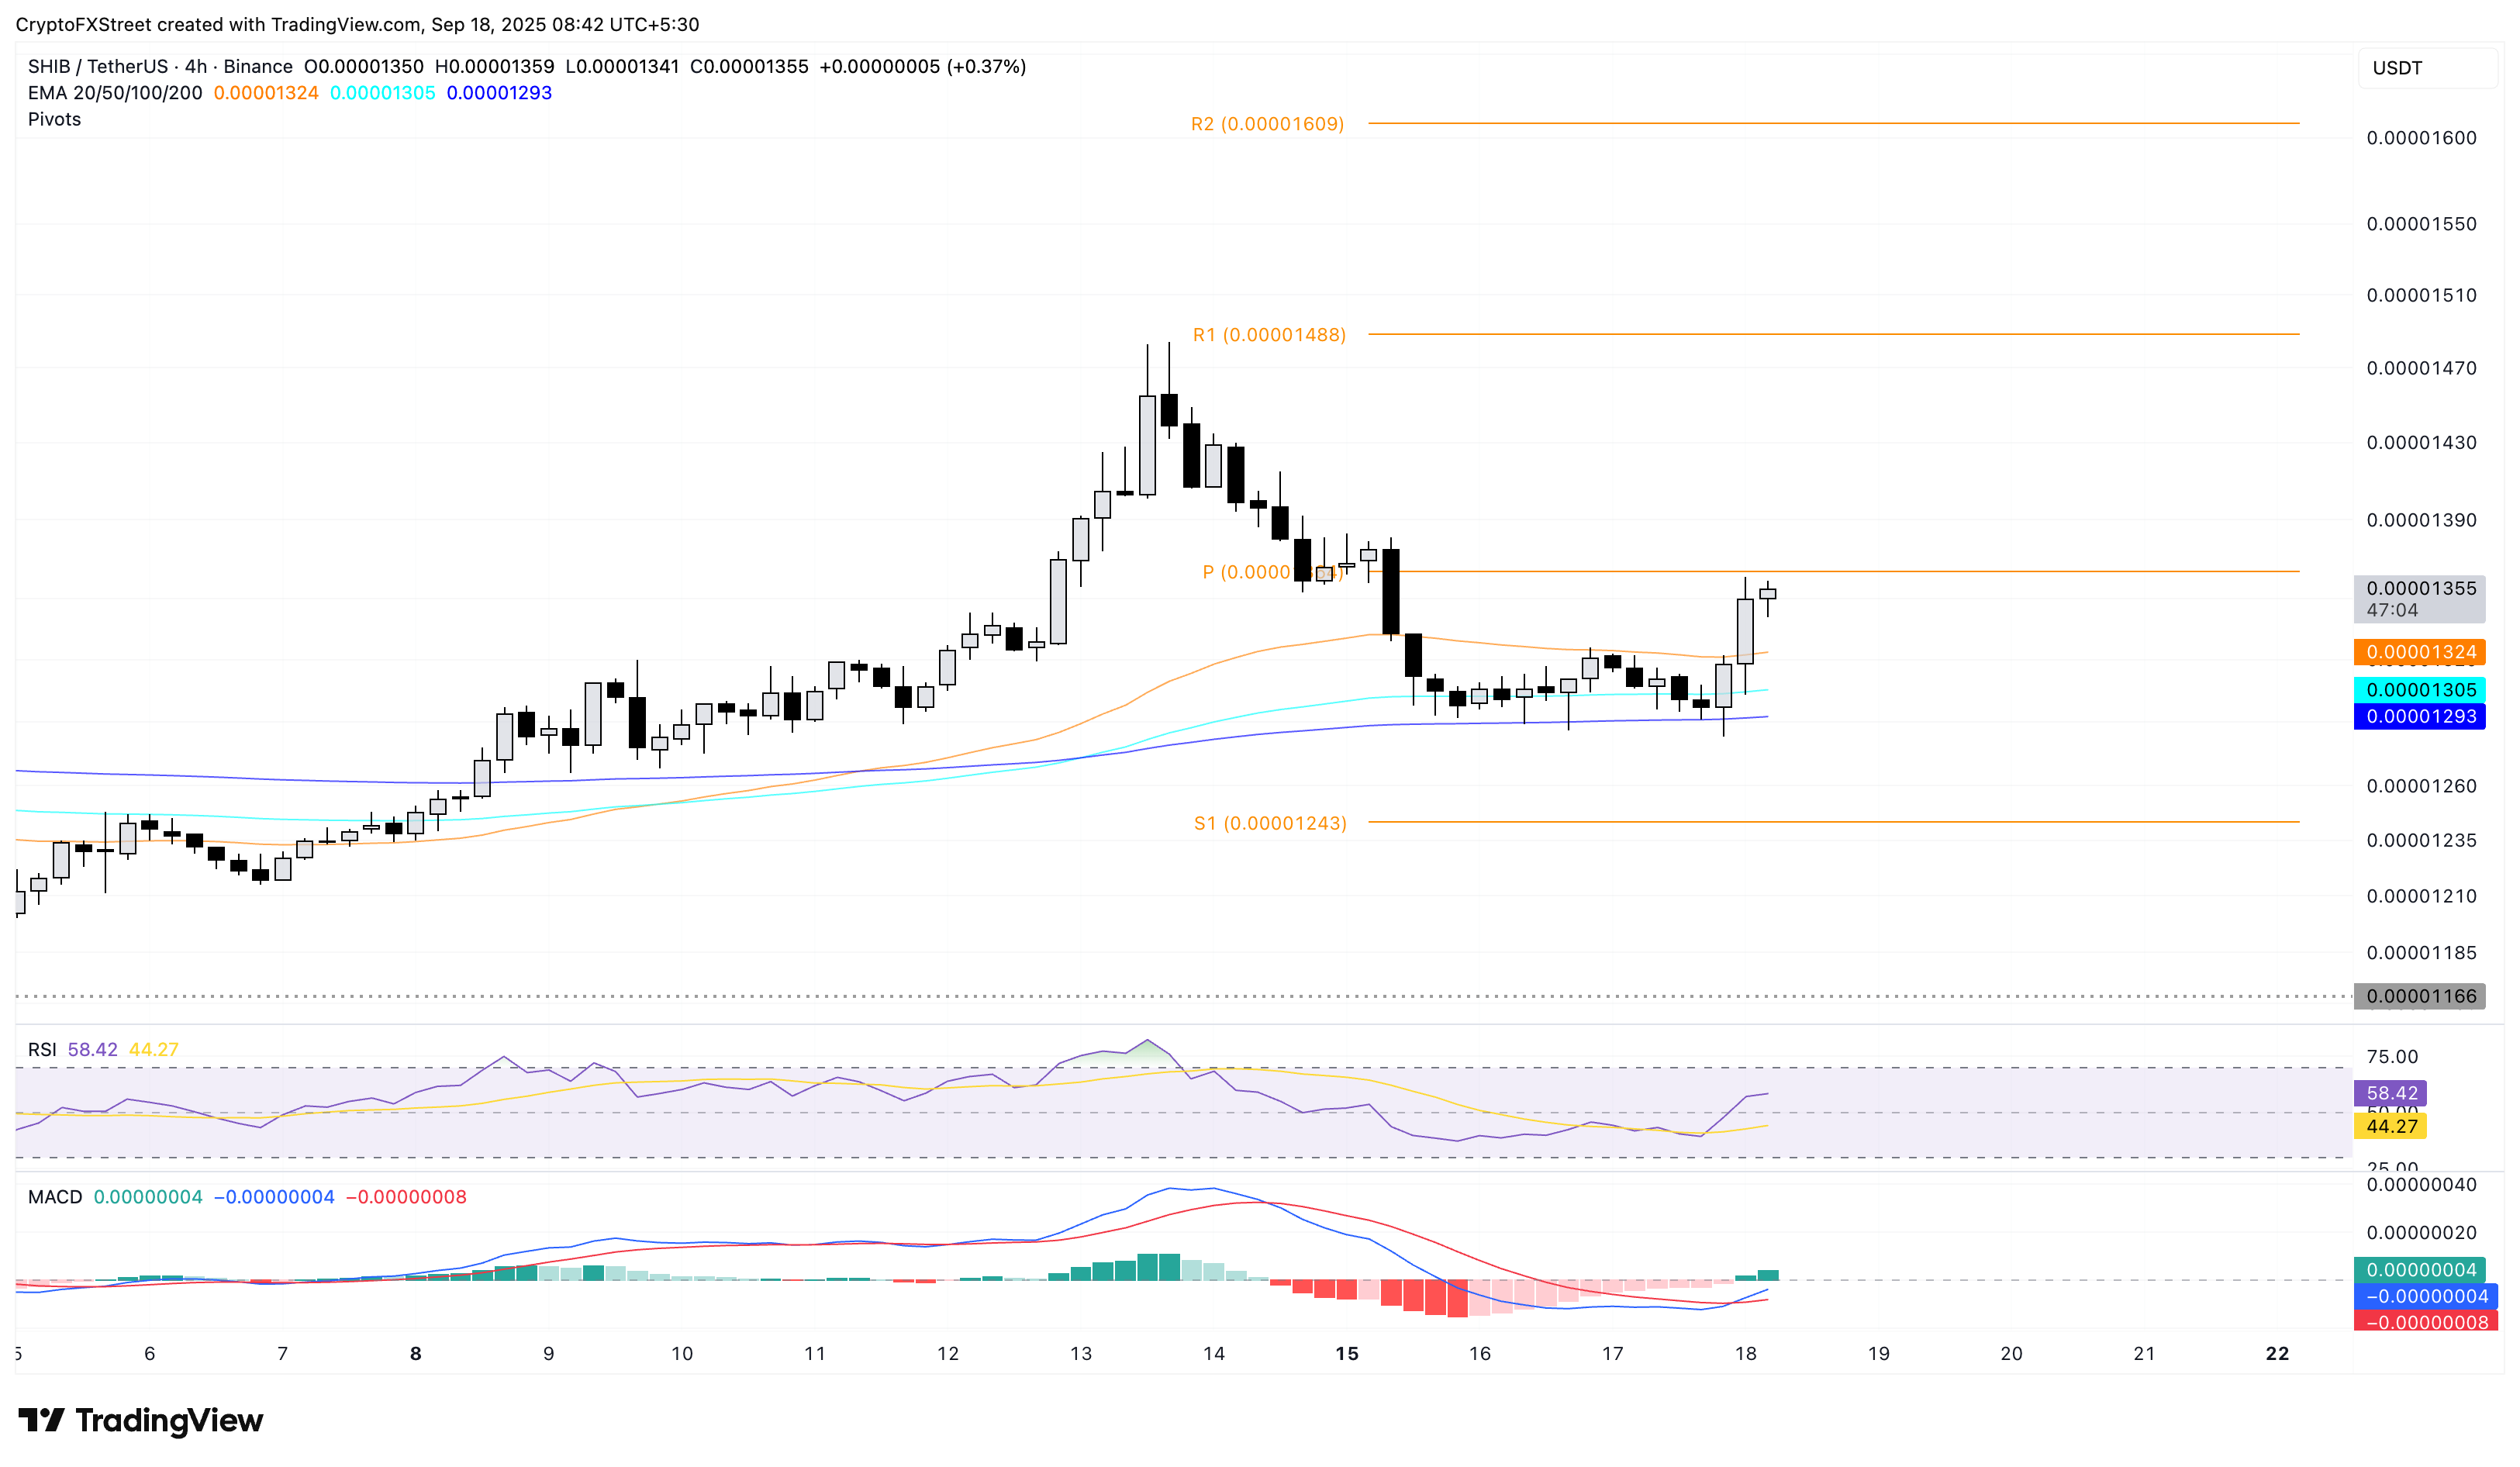
SHIB/USDT daily price chart.
On the contrary, if SHIB reverts from $0.00001368, it could retest the 200-period EMA at $0.00001293.
Pepe's bounce gains momentum
Pepe appreciates over 1% at press time on Thursday, extending the bounce back from the 200-period EMA on the 4-hour chart. The meme coin rally has surpassed the centre pivot level at $0.00001135, targeting the $0.00001266 level, last tested on Saturday.
The technical indicators on the 4-hour chart indicate a surge in trend momentum as the MACD rises into the positive territory with a fresh wave of green histogram bars. Additionally, the RSI at 63 indicates elevated levels of buying pressure, inching closer to the overbought zone.
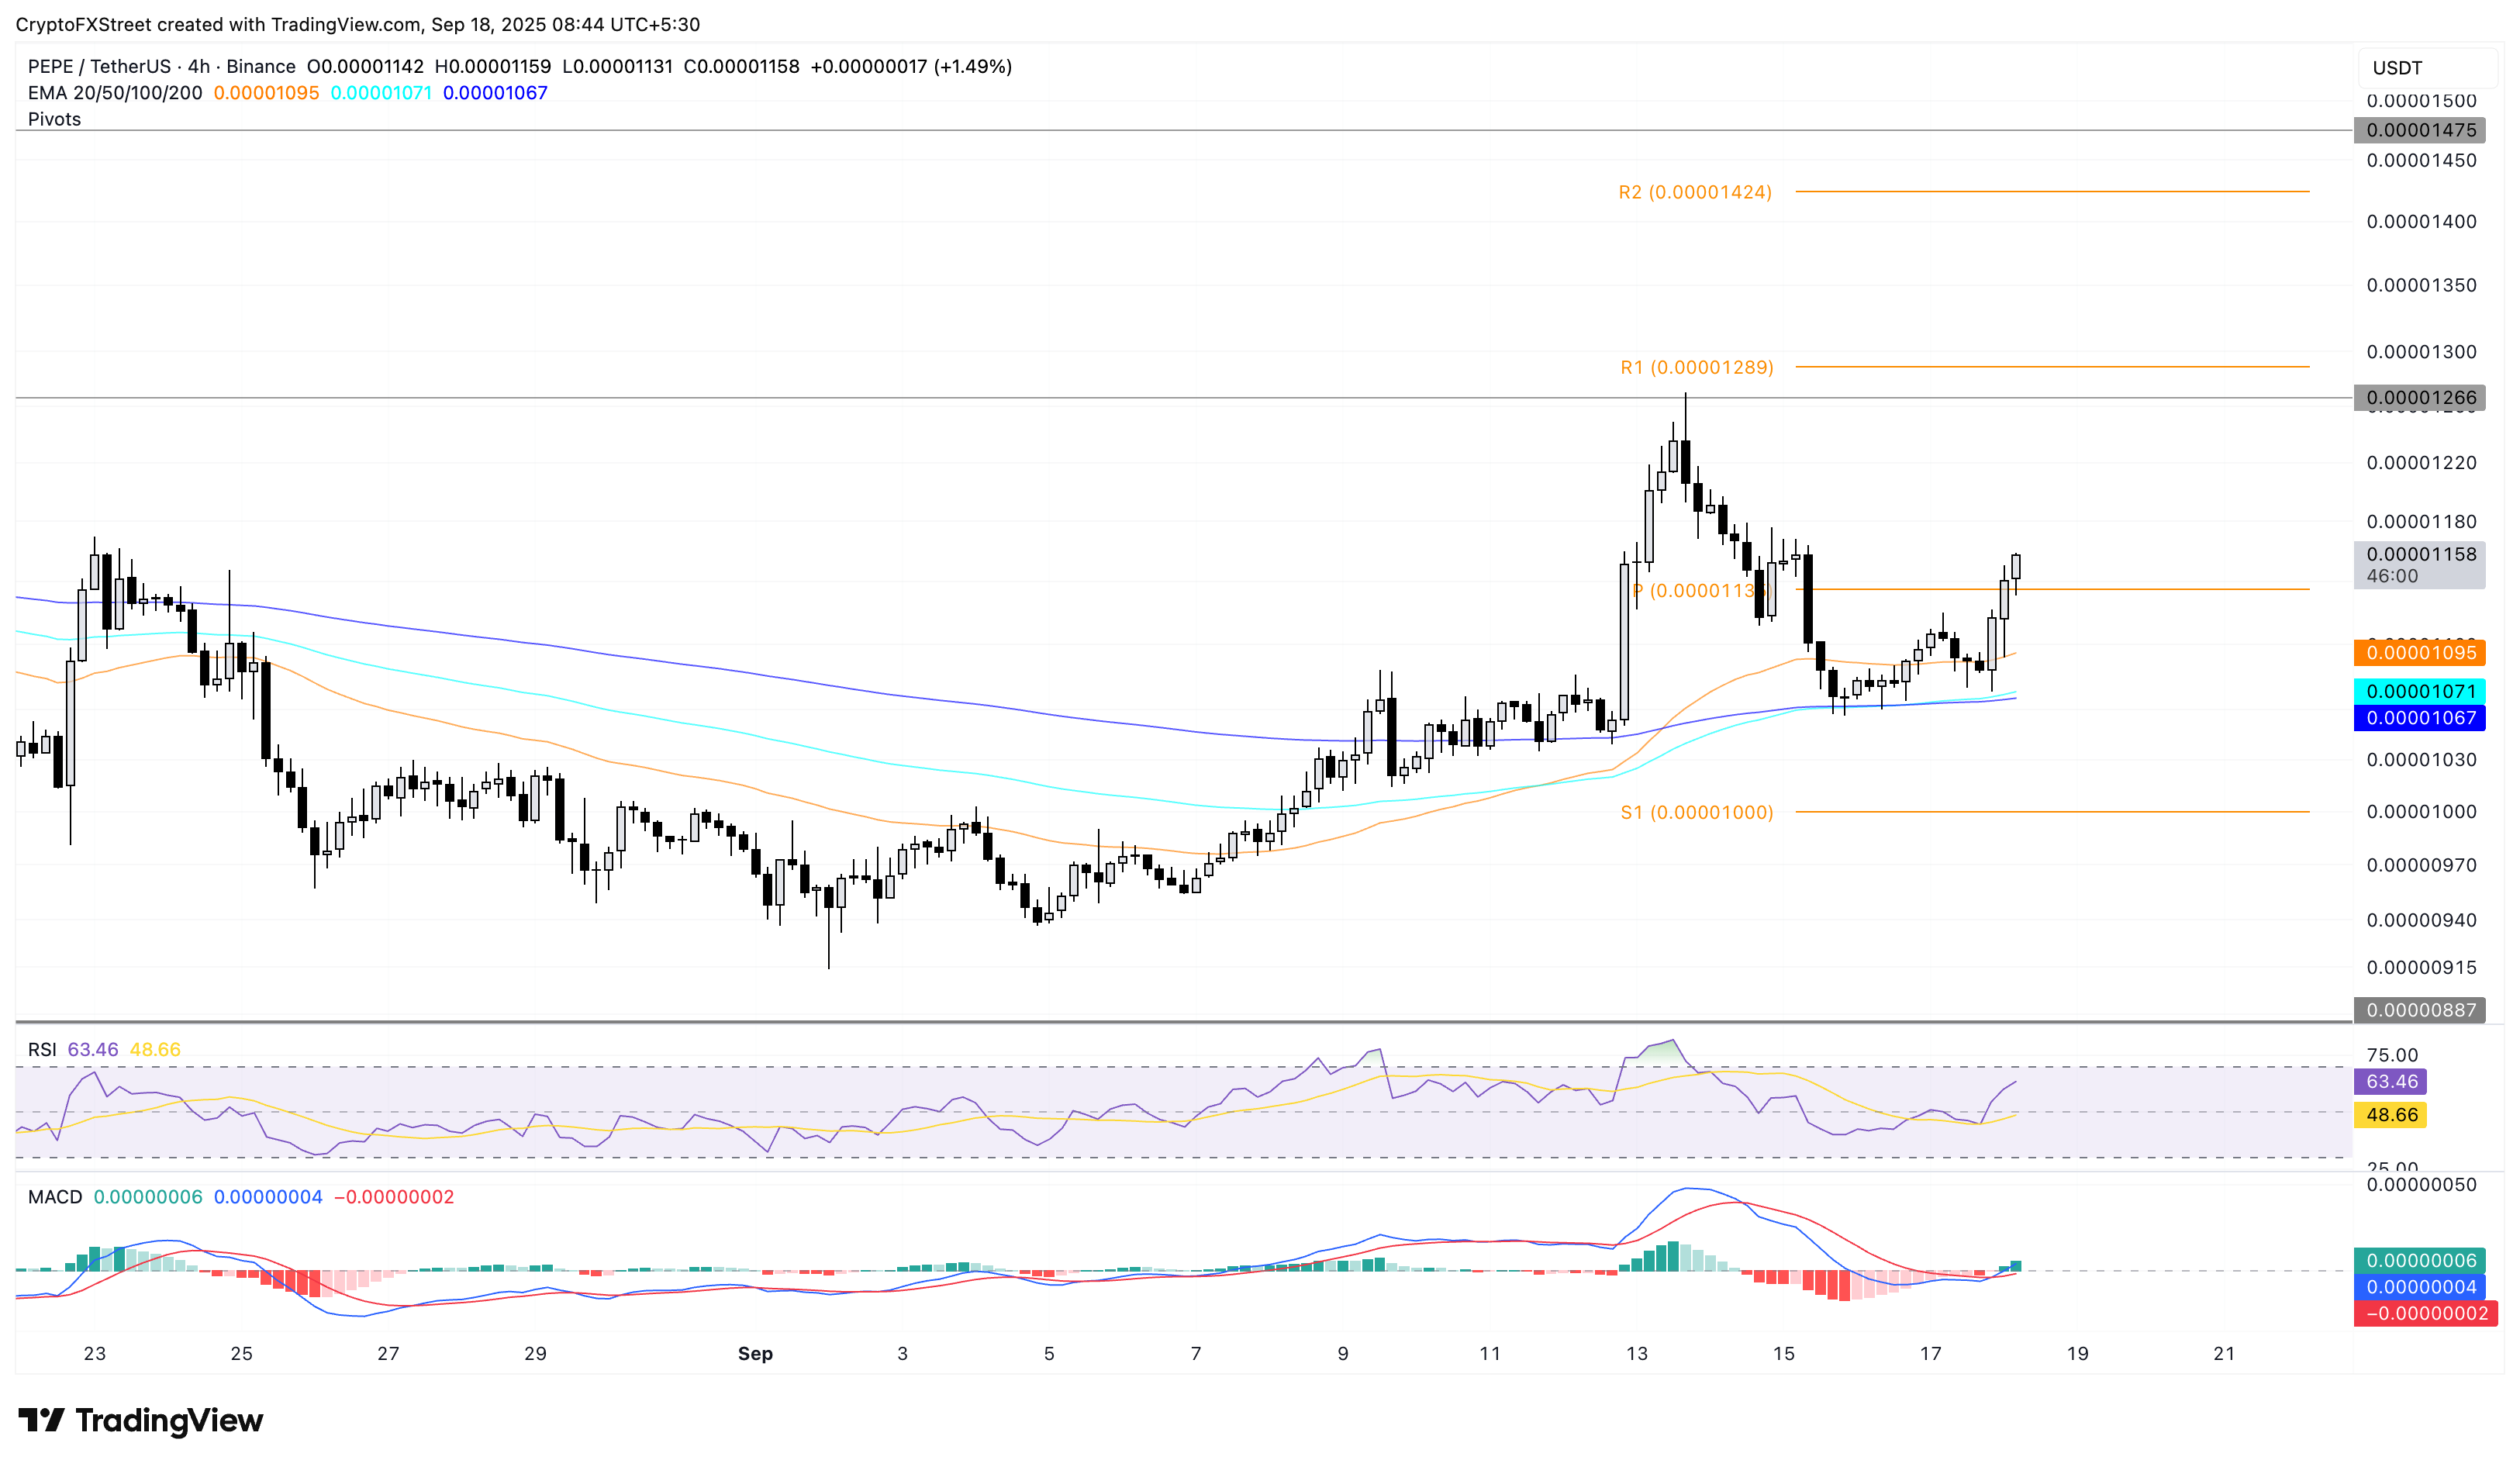
PEPE/USDT daily price chart.
On the flip side, if PEPE drops below $0.00001135, it could extend the decline to the 200-period EMA at 0.00001067.
บทความแนะนำ


