
Crypto Gainers: POL breaks key resistance, BUILDon and KuCoin extend rallies
- POL, previously known as MATIC, has exceeded the 200-day EMA, signaling a potential breakout from a crucial supply zone.
- BUILDon meme coin edges higher for the third day, with bulls targeting a new record high.
- KuCoin Token hits an annual high as the uptrend extends for the seventh consecutive day.
POL (POL), BUILDon (B), and KuCoin Token (KCS) are among the top-performing cryptocurrencies at press time on Monday, while Bitcoin (BTC) trading below $109,000 impacts other top cryptocurrencies. The technical outlook highlights the POL, B, and KCS at a crucial crossroads, suggesting potential gains if bulls recapture the key levels.
Still, the risks are skewed for the emerging coins as interest in the broader cryptocurrency market declines. The Open Interest (OI) drops to $199.36 billion, from $200.34 billion on Sunday, suggesting a trend of capital outflow.
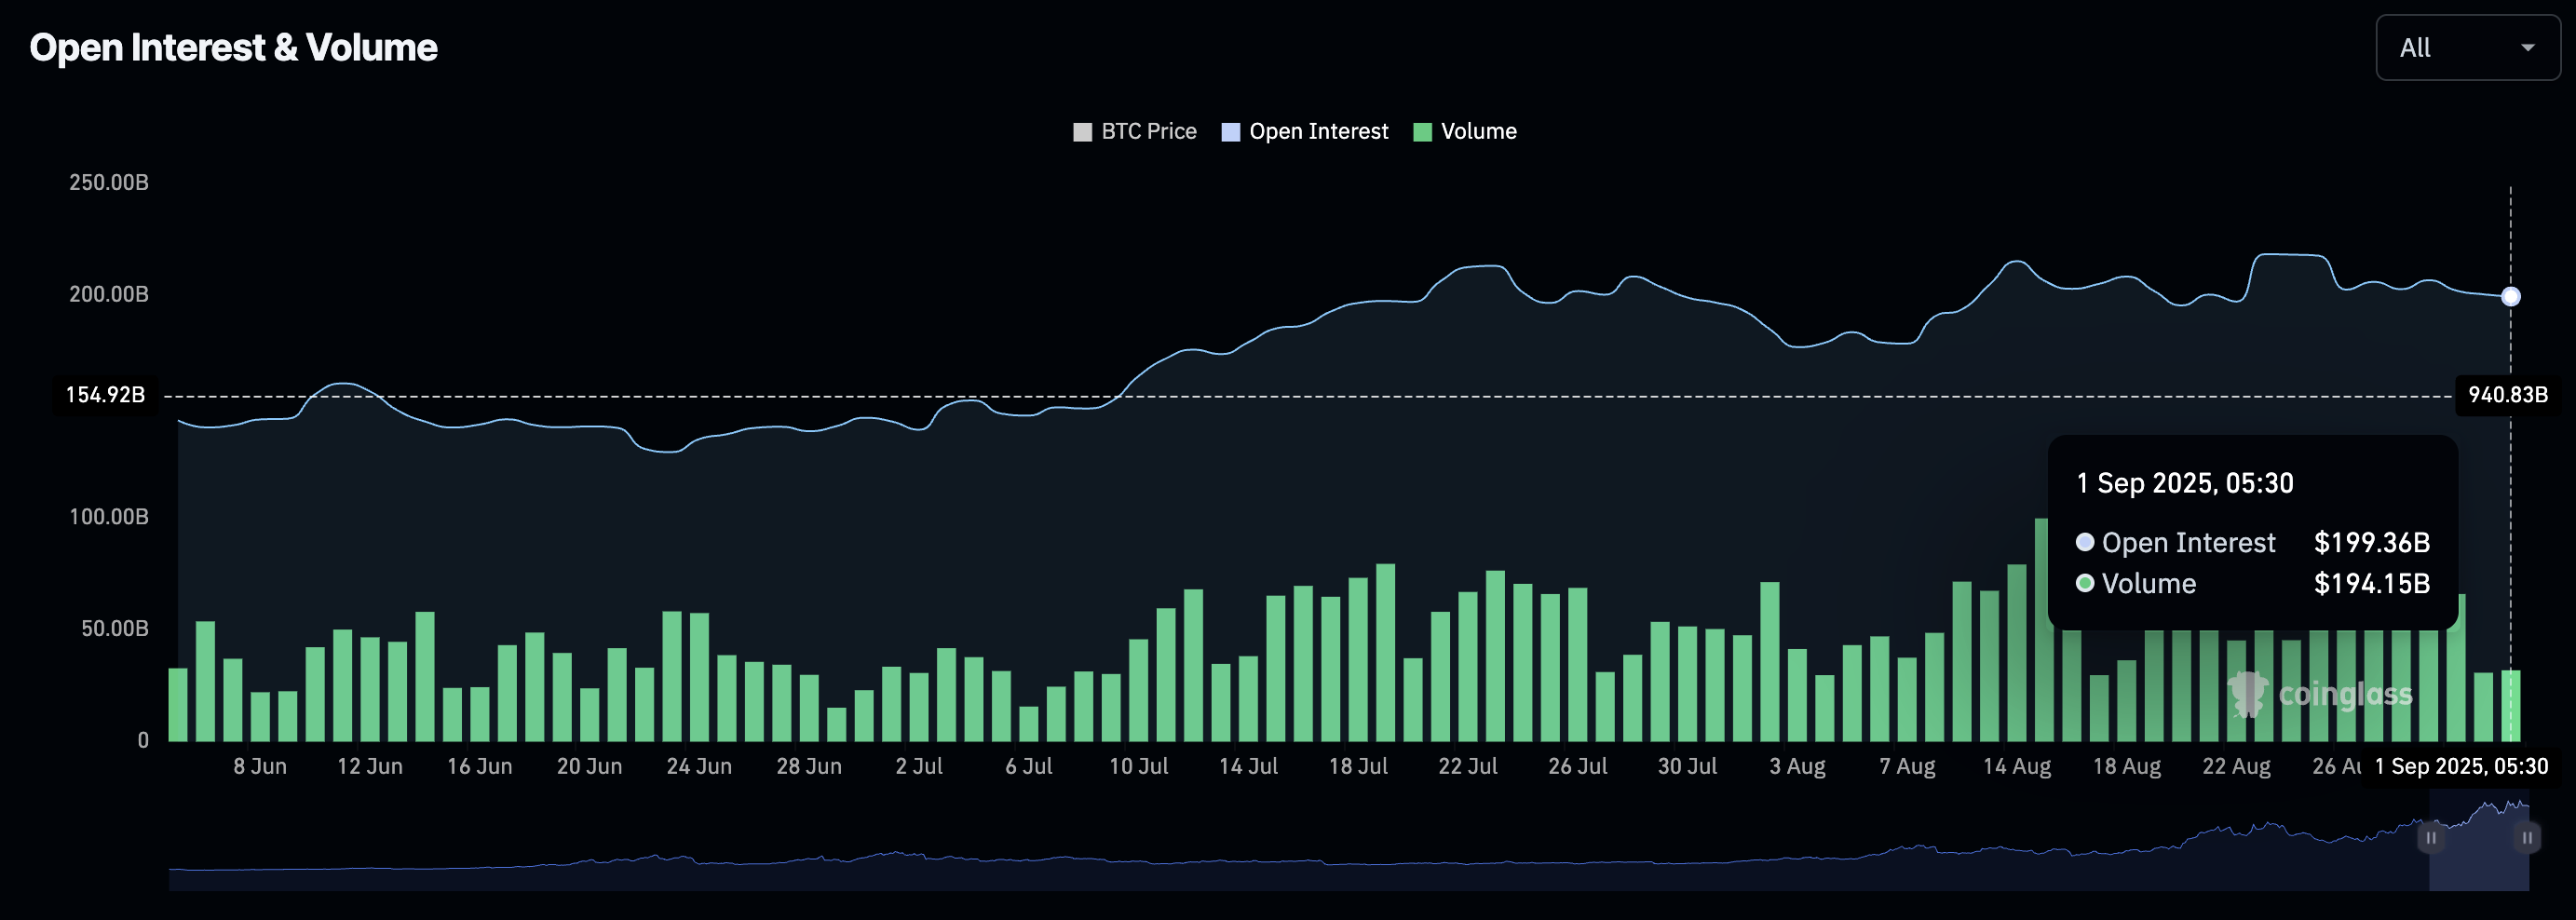
Open Interest. Source: CoinGlass
POL eyes further gains as momentum resurfaces
POL edges higher by over 2% at press time on Monday, extending the 8% gains from Sunday. The uptrend exceeds the $0.2750 supply zone and the 38.2% Fibonacci level at $0.28222, which is drawn from the $0.7685 high on December 3 to the $0.1519 low on April 7.
A decisive close above this Fibonacci level could further drive the rally to the 50% retracement level at $0.3417.
The momentum indicators on the daily chart suggest increasing bullishness in POL. The Relative Strength Index (RSI) at 64, pointing upwards, indicates a surge in buying pressure and room for further recovery before the trend reaches overbought levels. A sideways movement at the overbought levels could extend the breakout rally in POL.
The Moving Average Convergence Divergence (MACD) indicator signalled a buy opportunity on Saturday as the MACD crossed above its signal line. It indicates a rise in bullish momentum as the uptrend in average lines continues with rising green histogram bars.
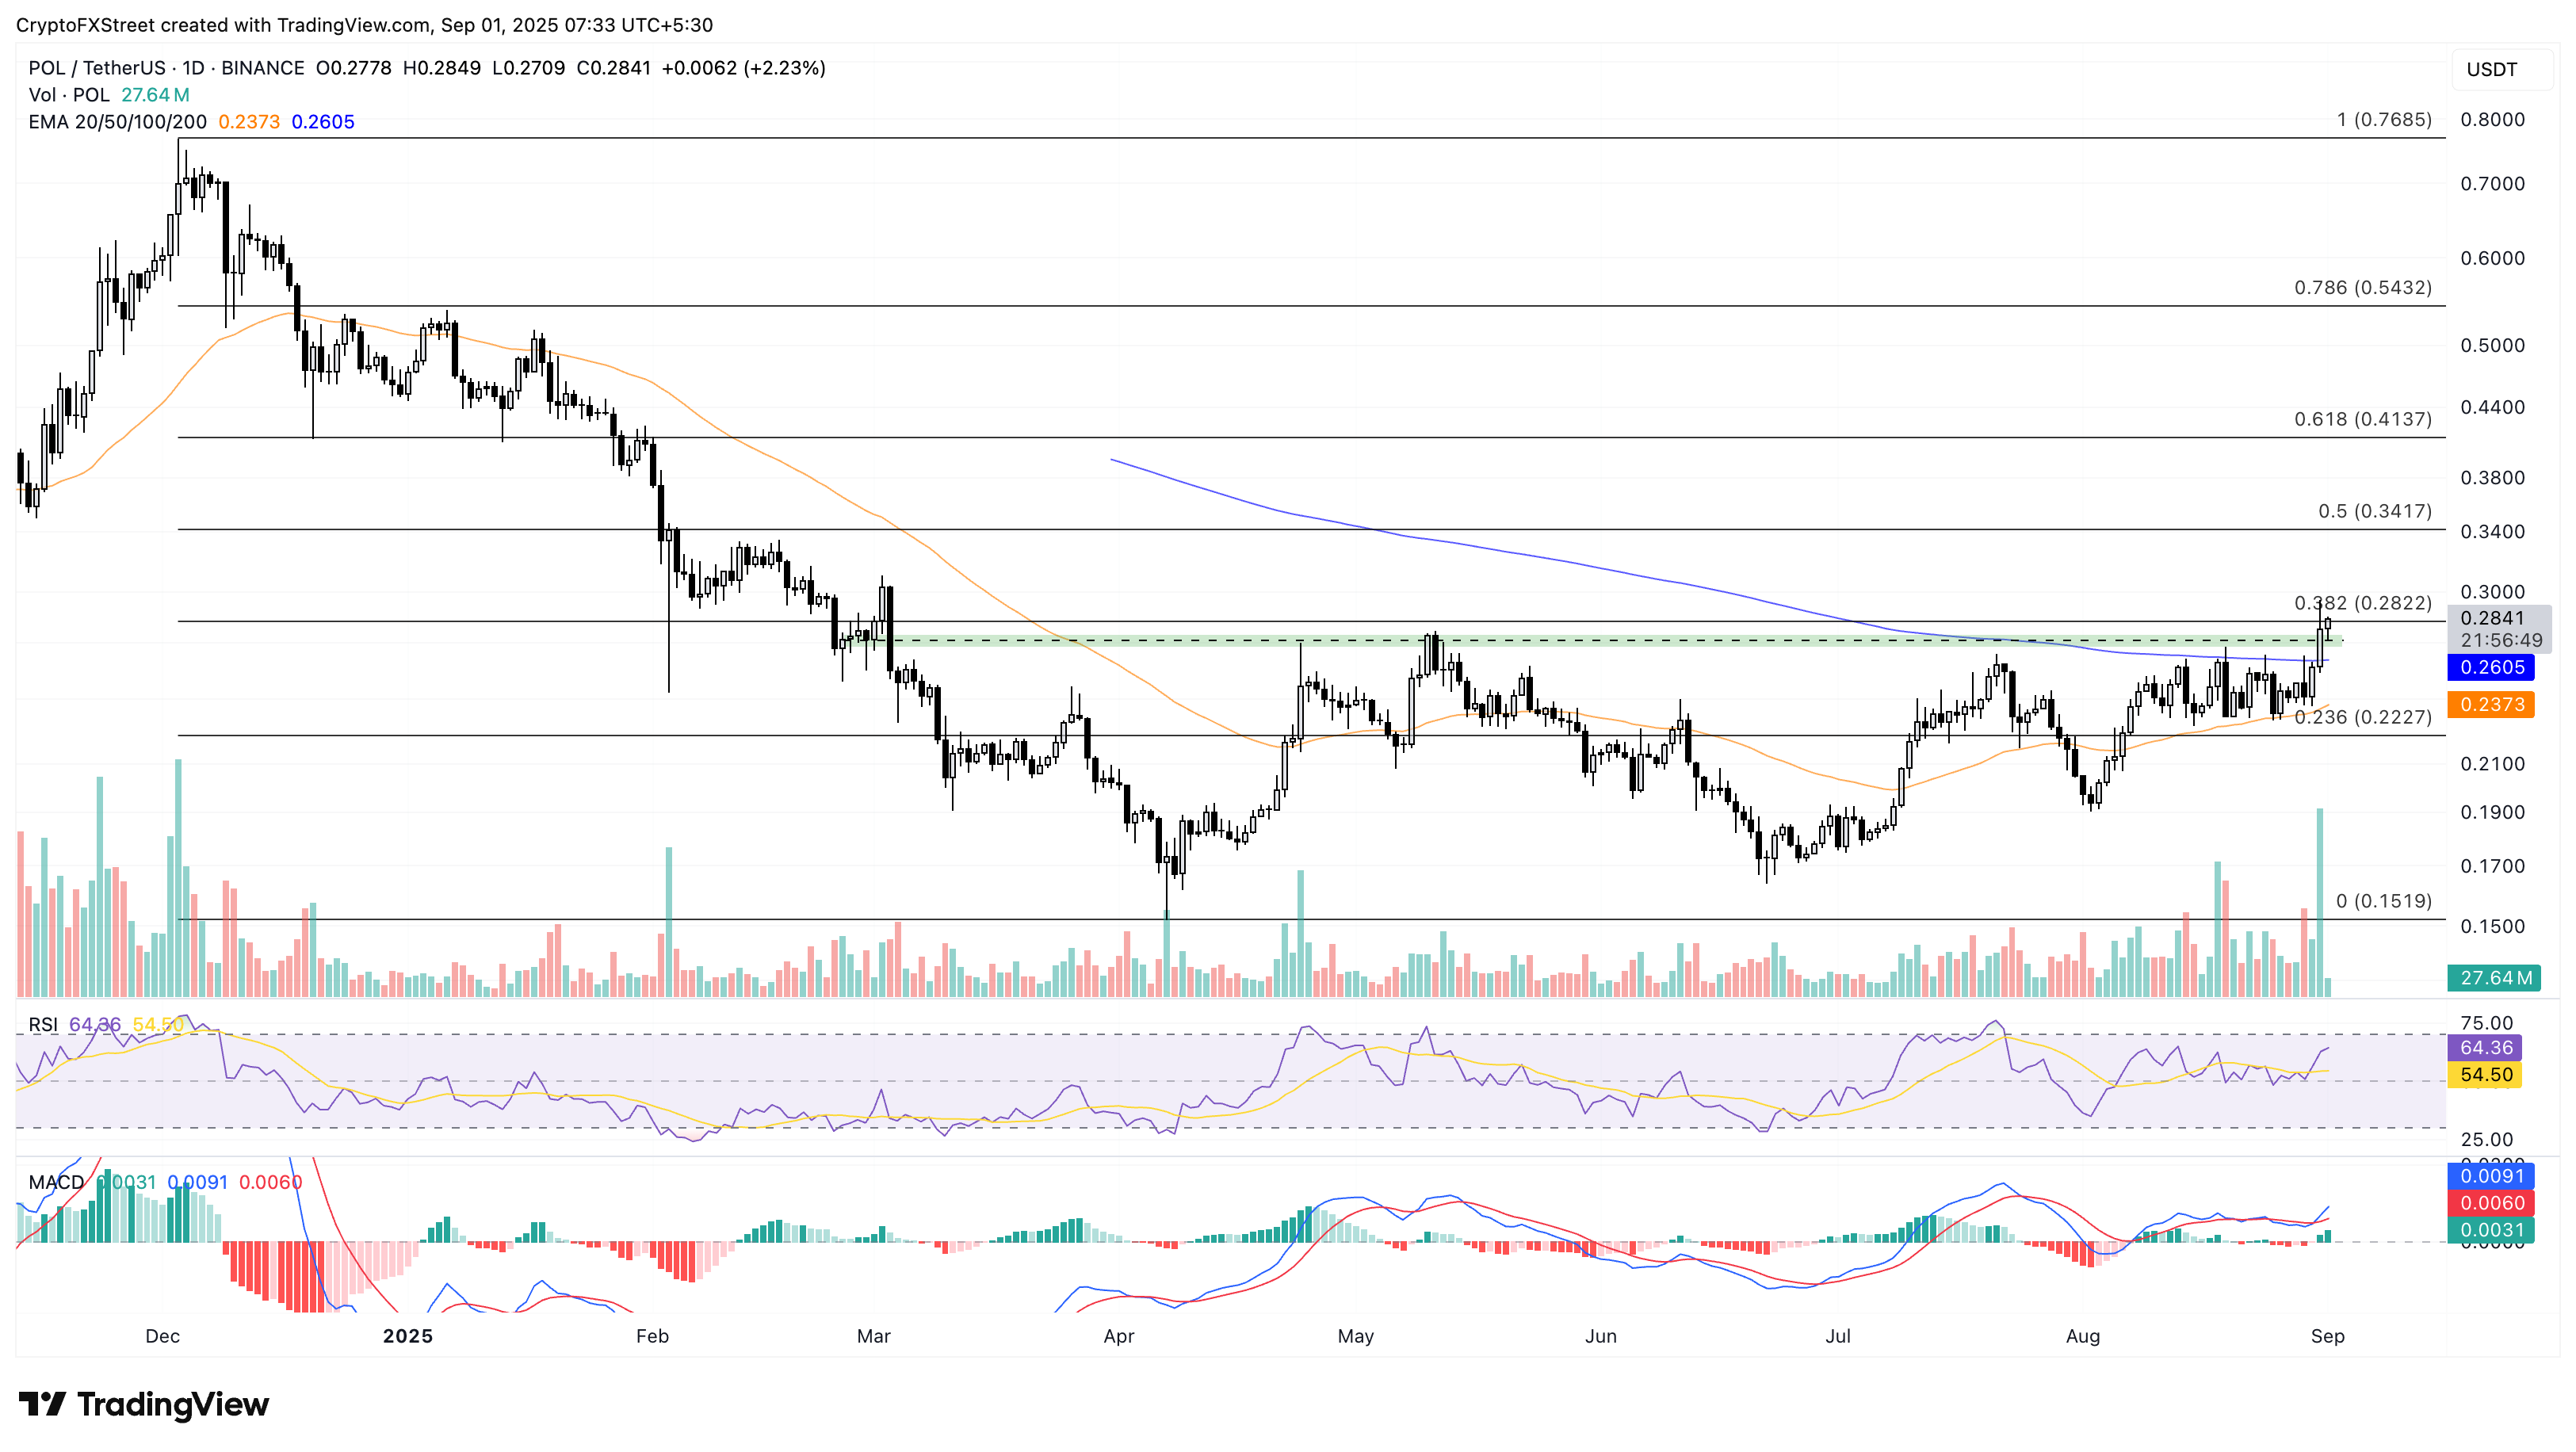
POL/USDT daily price chart.
Looking down, a reversal in POL below the 200-day Exponential Moving Average (EMA) at $0.2605 could invalidate the breakout chances. In such a scenario, the Ethereum layer-2 token could drop to the 50-day EMA at $0.2373.
BUILDon’s uptrend at risk as RSI divergence emerges
BUILDon extends the uptrend by nearly 1% at press time on Monday, challenging an ascending trendline on the daily chart, formed by connecting the peaks of July 13 and August 28. The meme coin reversed from the trendline at $0.7414 on Sunday, suggesting overhead pressure.
If BUILDon ends the day with a close above $0.7414, it would mark the trendline breakout and reach a record high. The breakout rally could target the R1 pivot level at $0.8154.
The MACD indicator displays a steady increase in bullish momentum, marked by the successively rising green histogram bars.
Still, the RSI, which is moving flat below the overbought boundary against the uptrending price action, suggests a potential bearish RSI divergence. This increases the chances of a turnaround from the overhead trendline.
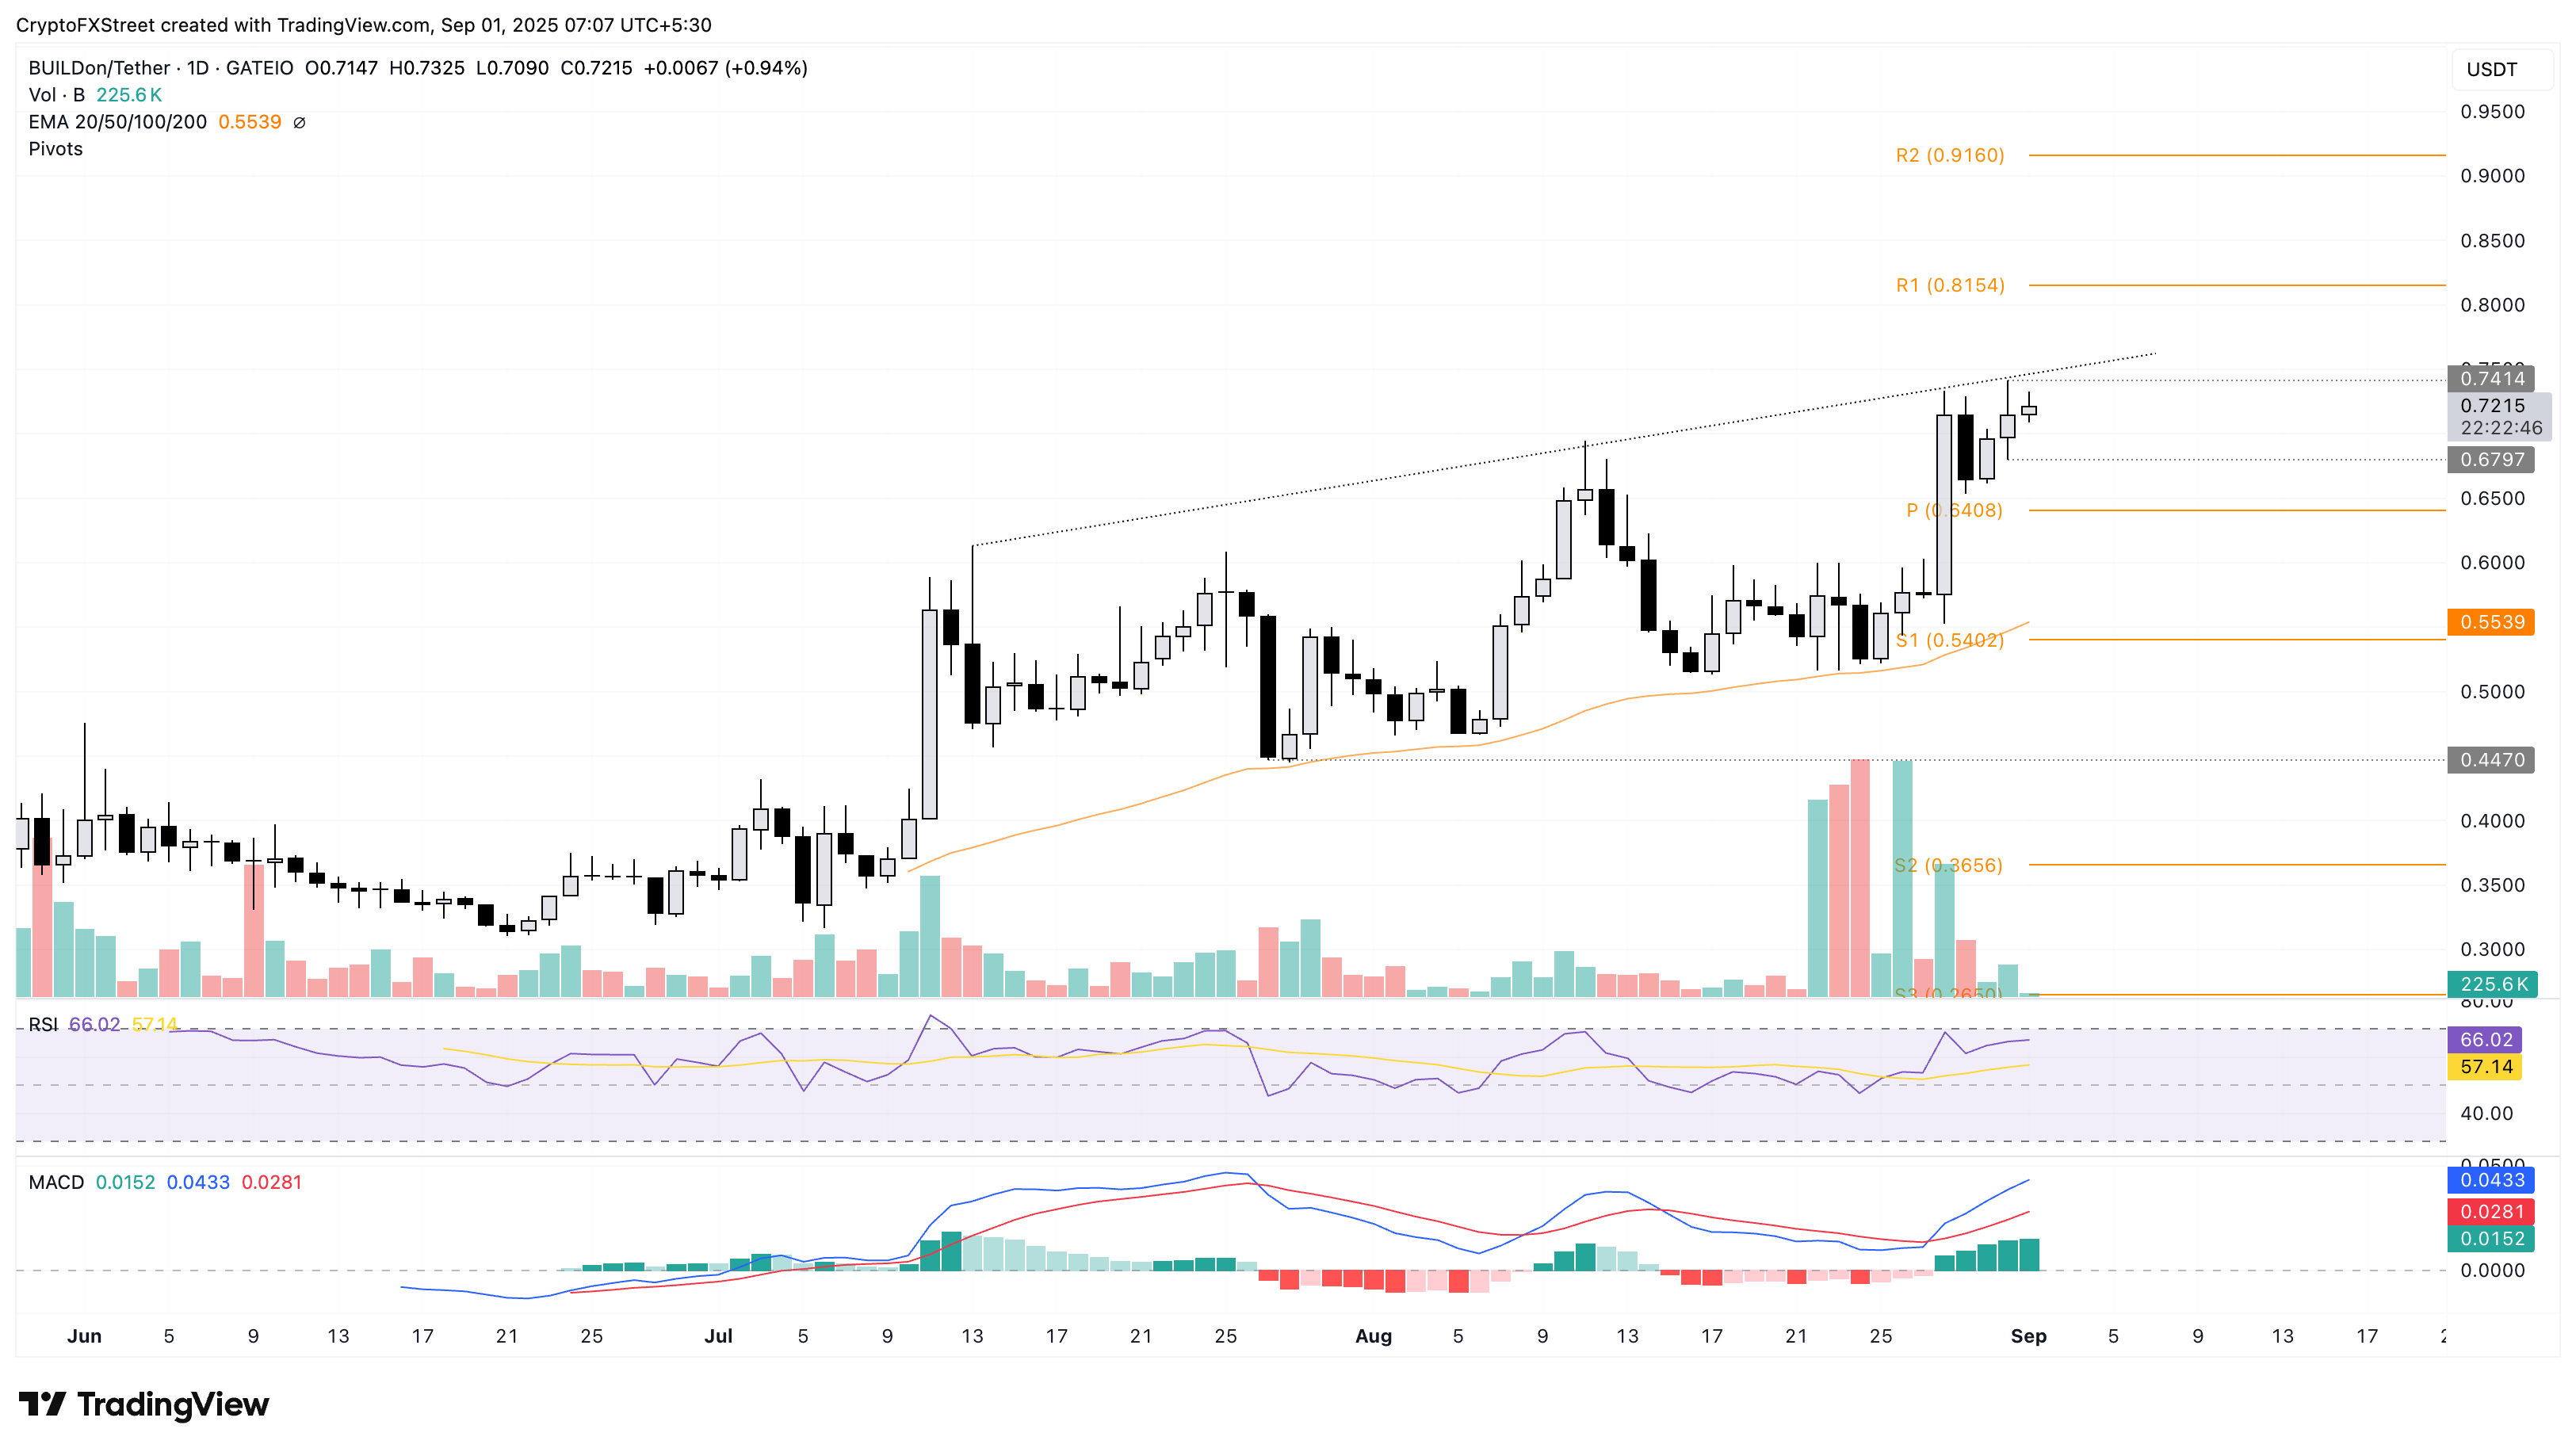
B/USDT daily price chart.
If BUILDon reverses, it could target the centre Pivot level at $0.6408.
KuCoin enters price discovery mode
KuCoin Token reached a new annual high of $14.61 on Monday, as the uptrend continues for the seventh day. The bullish run in KCS enters price discovery mode, with bulls targeting the R1 pivot level at $15.97 as the uptrend gains momentum.
The RSI at 70 on the daily chart enters the overbought zone, suggesting overstimulated buying activities. Furthermore, the MACD and signal line keep a steady upward trend as green histogram bars rise, indicating a gradual increase in bullish momentum.
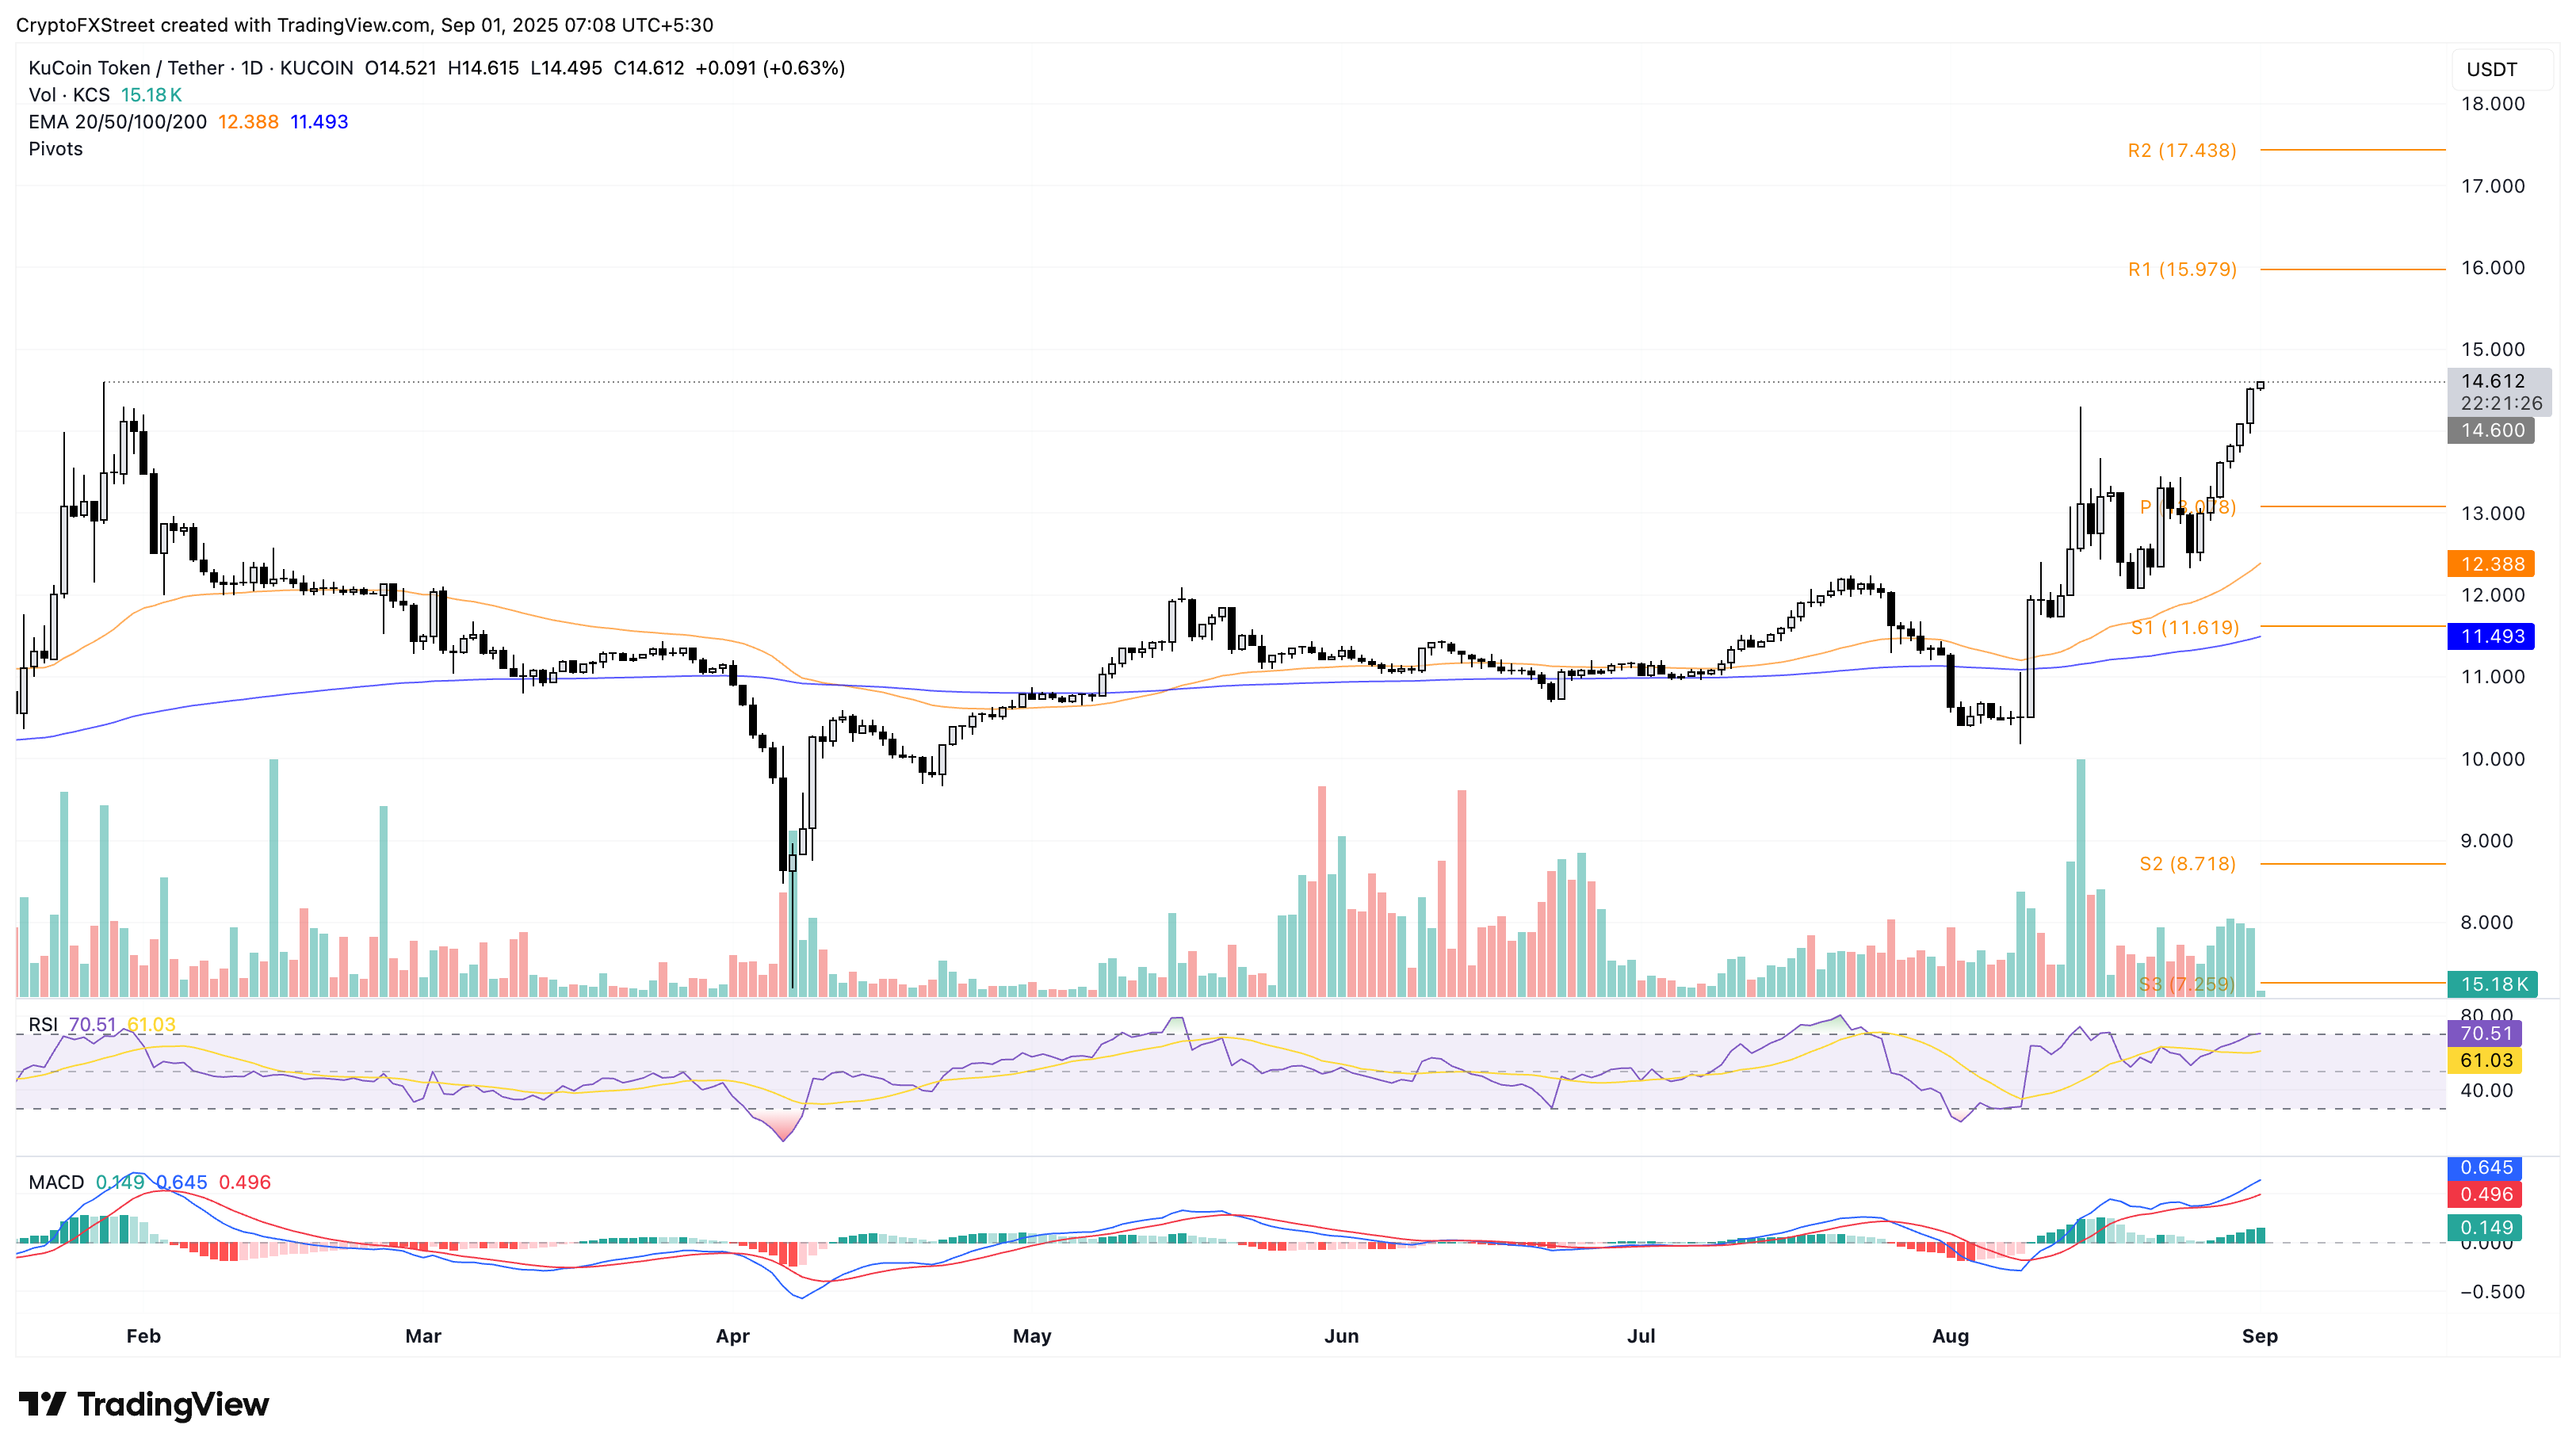
KCS/USDT daily price chart.
Looking down, a reversal in KCS could test the $14.00 round figure.
บทความแนะนำ


