
Pi Network Price Forecast: RSI divergence alludes to a double-bottom pattern reversal
- Pi Network’s PI token edges higher following the 4.92% rise from Wednesday.
- A significant outflow from CEXs’ wallet balances signals increased withdrawals over the last 24 hours.
- The technical outlook suggests a bullish bias as RSI divergence pairs up with a potential double bottom pattern.
Pi Network (PI) trades at $0.3653 at press time on Thursday, retracing from the $0.3747 high. The technical and exchange reserves indicate a bullish bias, with an RSI divergence, a double bottom pattern, and a sharp outflow from the Centralized Exchanges (CEXs) wallet balances, pointing to increased demand.
PI demand surges ahead of Hackathon 2025
PiScan data shows the CEXs’ wallet balances recording an outflow of 5.14 million PI tokens in the last 24 hours, dropping the reserve to 409.55 million tokens. This massive withdrawal accounts for a 1.24% decrease in CEX's balances, indicating a surge in demand among investors, is likely driven by the start of the Pi Hackathon 2025, the ecosystem's first hackathon after the launch of Open Network.
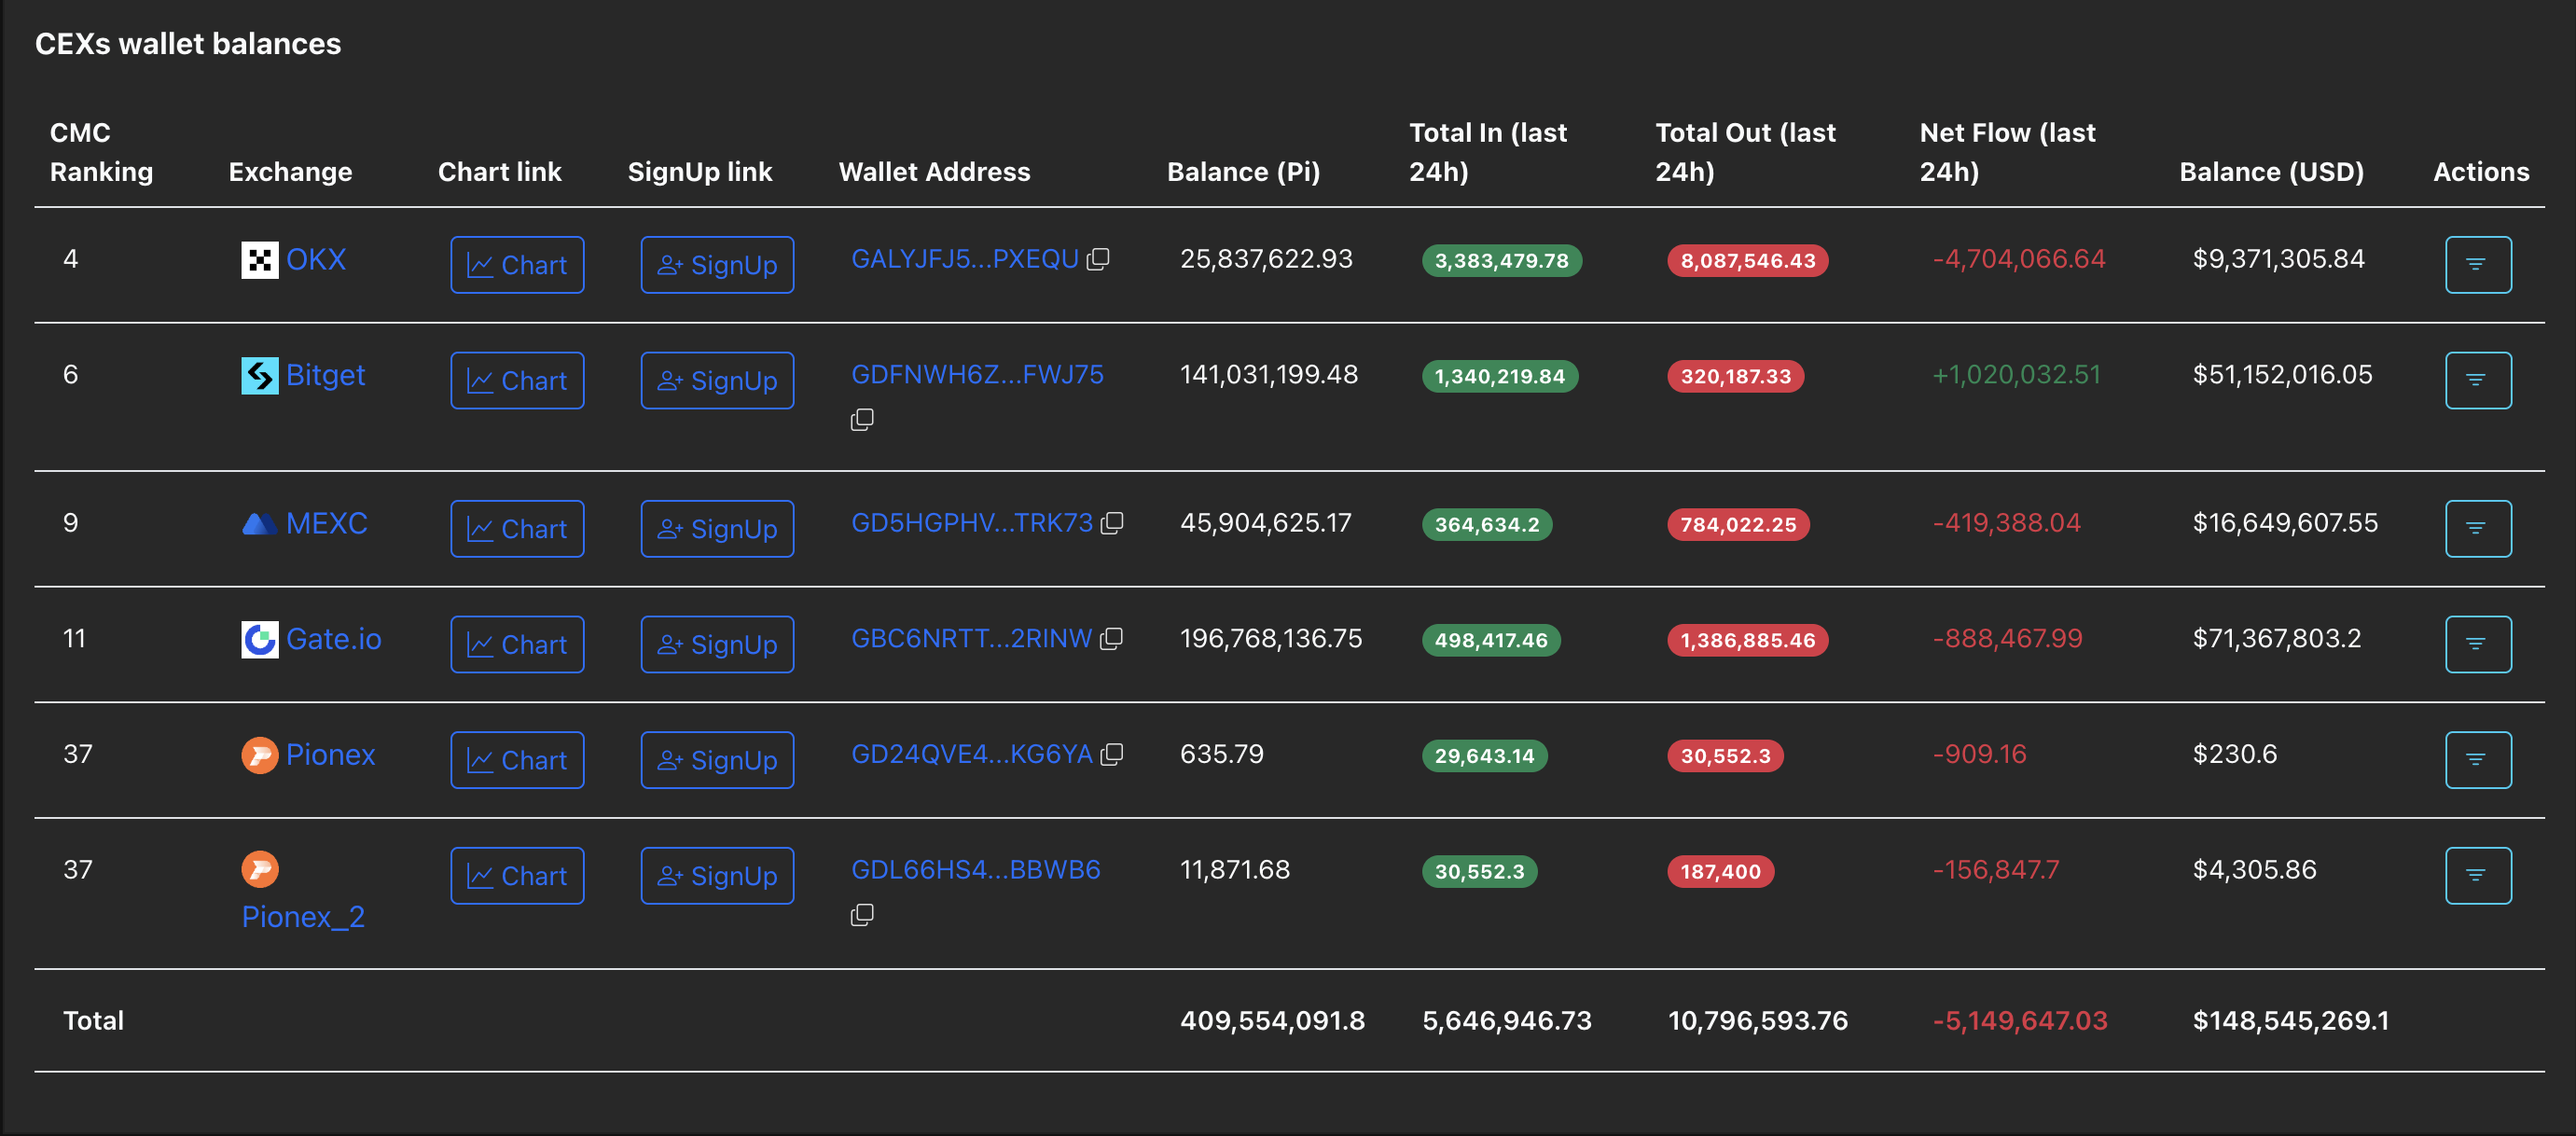
CEXs' wallet balances. Source: Coinglass
Pi Network eyes breaking out of a rising channel
Pi Network’s PI token edges higher by nearly 1.50% at press time on Thursday, extending the 4.92% rise from Wednesday. The reversal from the $0.3442 support level hints at a double bottom pattern reversal, previously tested on August 6, targeting the 50-day Exponential Moving Average (EMA) at $0.4319.
The declining average line aligns with the resistance trendline of a falling channel pattern, as marked on the daily chart (shared below). A decisive close above this level could reinforce a potential bullish trend, targeting the $0.5000 psychological level.
The Relative Strength Index (RSI) reads 42 on the daily chart, inching closer to the halfway line as buying pressure recovers. Additionally, the RSI has significantly recovered compared to the previous dip at $0.3442 level, indicating a bullish divergence.
Still, the Moving Average Convergence Divergence (MACD) and its signal line have merged and moved sideways, signaling a loss in decisive trend momentum.
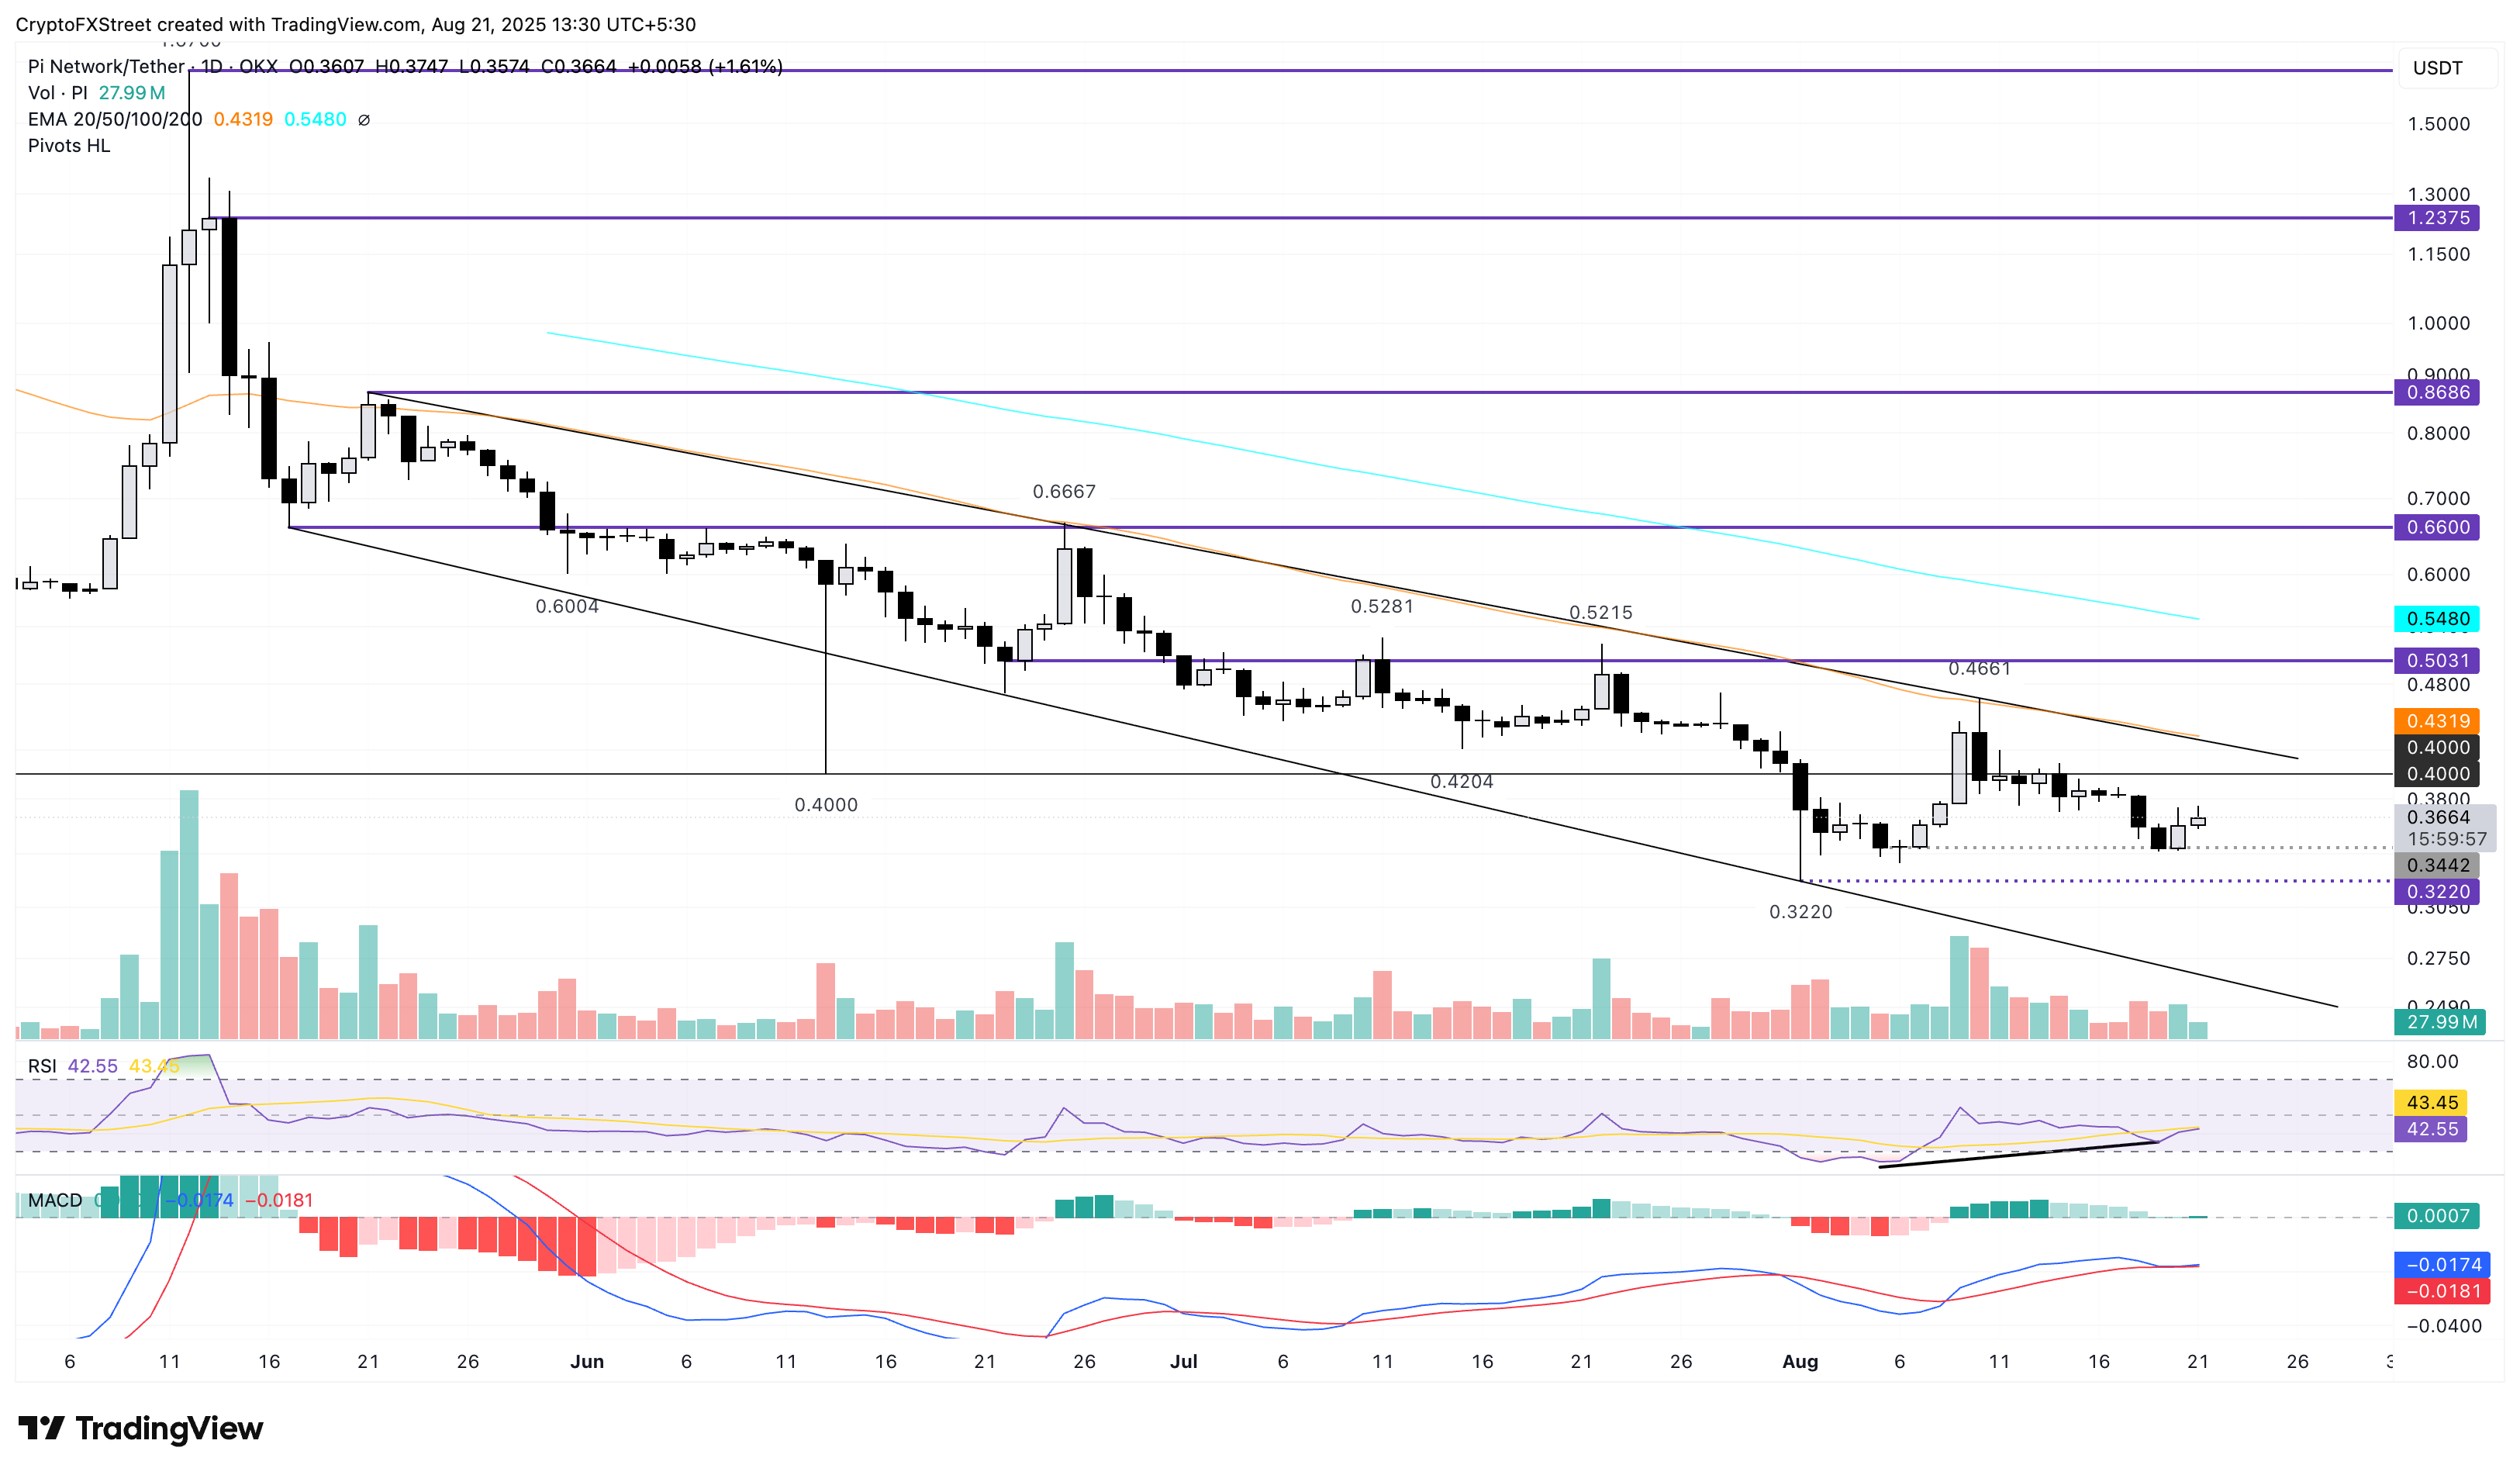
PI/USDT daily price chart.
On the contrary, a reversal below the $0.3442 support level would invalidate the double bottom reversal pattern, increasing the risk of the $0.3220 support level, which aligns with the all-time low.
Bitcoin, altcoins, stablecoins FAQs
Bitcoin is the largest cryptocurrency by market capitalization, a virtual currency designed to serve as money. This form of payment cannot be controlled by any one person, group, or entity, which eliminates the need for third-party participation during financial transactions.
Altcoins are any cryptocurrency apart from Bitcoin, but some also regard Ethereum as a non-altcoin because it is from these two cryptocurrencies that forking happens. If this is true, then Litecoin is the first altcoin, forked from the Bitcoin protocol and, therefore, an “improved” version of it.
Stablecoins are cryptocurrencies designed to have a stable price, with their value backed by a reserve of the asset it represents. To achieve this, the value of any one stablecoin is pegged to a commodity or financial instrument, such as the US Dollar (USD), with its supply regulated by an algorithm or demand. The main goal of stablecoins is to provide an on/off-ramp for investors willing to trade and invest in cryptocurrencies. Stablecoins also allow investors to store value since cryptocurrencies, in general, are subject to volatility.
Bitcoin dominance is the ratio of Bitcoin's market capitalization to the total market capitalization of all cryptocurrencies combined. It provides a clear picture of Bitcoin’s interest among investors. A high BTC dominance typically happens before and during a bull run, in which investors resort to investing in relatively stable and high market capitalization cryptocurrency like Bitcoin. A drop in BTC dominance usually means that investors are moving their capital and/or profits to altcoins in a quest for higher returns, which usually triggers an explosion of altcoin rallies.
บทความแนะนำ


