

Australian Dollar remains subdued following China’s Manufacturing PMI
- Australian Dollar struggles as domestic Building Permits declined by 8.2% MoM in July.
- China’s Caixin Manufacturing Purchasing Managers’ Index climbed to 50.5 in August from 49.5 in July.
- San Francisco Fed President Mary Daly said that policymakers are preparing to lower interest rates soon.
The Australian Dollar (AUD) inches lower after four days of gains. However, the AUD/USD may further advance as the US Dollar (USD) struggles amid rising bets of a US Federal Reserve (Fed) rate cut in the September meeting. United States (US) markets will be closed on Monday for the Labor Day holiday.
The AUD/USD pair holds losses following the release of domestic Building Permits, which reported a decline of 8.2% month-over-month in July, surpassing the expected decline of 4.8%. The previous reading indicated an increase of 11.9%. Meanwhile, the annual data showed an increase of 6.6%, following a previous 27.4% rise.
China’s Caixin Manufacturing Purchasing Managers’ Index (PMI) jumped to 50.5 in August from 49.5 in July, according to the latest data released on Monday. It is worth noting that any change in the Chinese economy could influence AUD as China and Australia are close trading partners.
China’s National Bureau of Statistics (NBS) reported on Sunday that the country’s Manufacturing PMI rose to 49.4 in August from 49.3 in July. The reading came in weaker than the expectation of 49.5 and marked five consecutive months of decline. However, the NBS Non-Manufacturing PMI climbed to 50.3 in August, versus 50.1 prior and in line with the market consensus.
The AUD gained ground after stronger-than-expected inflation data in Australia lowered the likelihood of a Reserve Bank of Australia (RBA) rate cut. Australia’s Monthly Consumer Price Index rose 2.8% year-over-year in July, beating both the previous 1.9% increase and the 2.3% forecast.
Australian Dollar steadies as US Dollar declines amid dovish Fedspeak
- The US Dollar Index (DXY), which measures the value of the US Dollar against six major currencies, is holding ground after registering losses in the previous four successive sessions and trading around 97.90 at the time of writing.
- San Francisco Fed President Mary Daly said on Sunday that policymakers will be ready to cut interest rates soon, adding that inflation stemming from tariffs will likely prove temporary, per Bloomberg.
- US Personal Consumption Expenditures (PCE) Price Index held steady at 2.6% year-over-year in July, coming in line with the market expectation. The US core PCE Price Index, which excludes volatile food and energy prices, rose 2.9% YoY in July, as expected, following June's increase of 2.8%. On a monthly basis, the core PCE Price Index rose 0.2% and 0.3%, respectively.
- The US Court of Appeals for the Federal Circuit upheld a ruling that the sweeping tariffs the US President Donald Trump unilaterally imposed on most other countries were illegal, CNN reported on Friday. The Court rejected Trump's argument that the tariffs were authorized by an emergency economic powers legislation, declaring them "invalid as contrary to law."
- Fed Governor Christopher Waller said on Thursday that he would support an interest-rate cut in the September meeting and further reductions over the next three to six months to prevent the labor market from collapsing, per Reuters.
- President Trump announced last week that he was removing Fed Governor Lisa Cook from her position on the Fed's board of directors. The dismissal of Fed Governor Cook could increase the likelihood of heavy interest rate cuts, given Trump’s ongoing pressure on the central bank to reduce borrowing costs.
- Fed Chair Jerome Powell said at the Jackson Hole symposium that risks to the job market were rising, but also noted inflation remained a threat and that a decision wasn't set in stone. Powell also stated that the Fed still believes it may not need to tighten policy solely based on uncertain estimates that employment may be beyond its maximum sustainable level.
- Australia’s Private Sector Credit rose 0.7% month-on-month in July, following two straight 0.6% increases and marking the fastest growth since April. On an annual basis, private credit expanded 7.2%, up from 6.9% in the previous two months, the strongest pace since February 2023.
- Australia’s Private Capital Expenditure rose 0.2% in the second quarter, from the previous decline of 0.1% but fell short of the expected 0.7% increase.
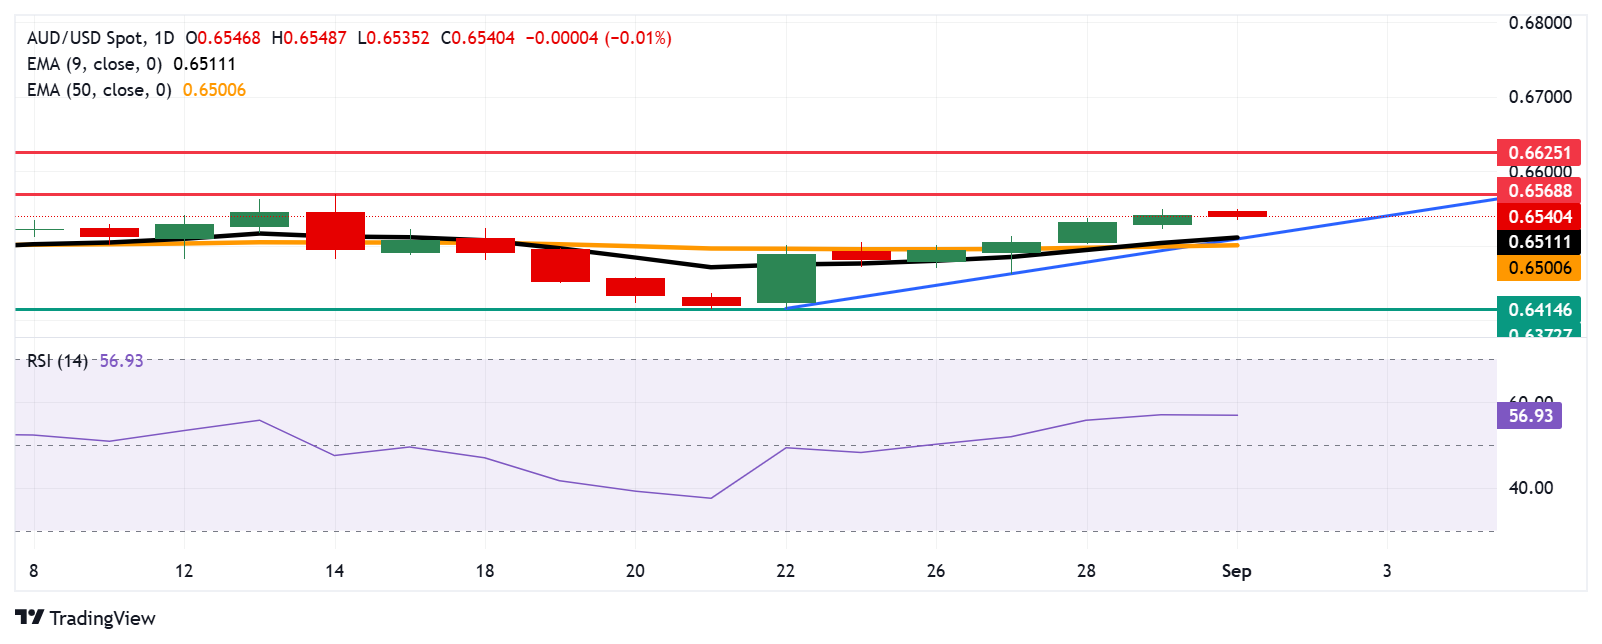
Australian Dollar faces initial barrier near 0.6550
AUD/USD is trading around 0.6540 on Monday. The technical analysis of the daily chart indicates that the pair remains above the ascending trendline, strengthening the bullish bias. Additionally, the pair is trading above the nine-day Exponential Moving Average (EMA), indicating short-term price momentum is stronger.
On the upside, the AUD/JPY pair could target the five-week high at 0.6568, reached on August 14, followed by the nine-month high of 0.6625, which was recorded on July 24.
The initial support appears at the nine-day EMA of 0.6511, aligned with the ascending trendline and followed by the 50-day EMA at 0.6500. A break below this crucial support zone would cause the emergence of the bearish bias and prompt the pair to test the three-month low of 0.6414, recorded on August 21.
AUD/USD: Daily Chart
Australian Dollar Price Today
The table below shows the percentage change of Australian Dollar (AUD) against listed major currencies today. Australian Dollar was the weakest against the New Zealand Dollar.
| USD | EUR | GBP | JPY | CAD | AUD | NZD | CHF | |
|---|---|---|---|---|---|---|---|---|
| USD | -0.05% | -0.16% | 0.10% | 0.03% | 0.08% | -0.25% | 0.10% | |
| EUR | 0.05% | -0.12% | 0.07% | 0.08% | 0.12% | -0.20% | 0.15% | |
| GBP | 0.16% | 0.12% | 0.08% | 0.20% | 0.24% | -0.08% | 0.32% | |
| JPY | -0.10% | -0.07% | -0.08% | -0.01% | -0.01% | -0.32% | 0.03% | |
| CAD | -0.03% | -0.08% | -0.20% | 0.01% | 0.06% | -0.28% | 0.13% | |
| AUD | -0.08% | -0.12% | -0.24% | 0.01% | -0.06% | -0.32% | 0.07% | |
| NZD | 0.25% | 0.20% | 0.08% | 0.32% | 0.28% | 0.32% | 0.40% | |
| CHF | -0.10% | -0.15% | -0.32% | -0.03% | -0.13% | -0.07% | -0.40% |
The heat map shows percentage changes of major currencies against each other. The base currency is picked from the left column, while the quote currency is picked from the top row. For example, if you pick the Australian Dollar from the left column and move along the horizontal line to the US Dollar, the percentage change displayed in the box will represent AUD (base)/USD (quote).
Economic Indicator
Caixin Manufacturing PMI
The Caixin Manufacturing Purchasing Managers Index (PMI), released on a monthly basis by Caixin Insight Group and S&P Global, is a leading indicator gauging business activity in China’s manufacturing sector. The data is derived from surveys of senior executives at both private-sector and state-owned companies. Survey responses reflect the change, if any, in the current month compared to the previous month and can anticipate changing trends in official data series such as Gross Domestic Product (GDP), industrial production, employment and inflation.The index varies between 0 and 100, with levels of 50.0 signaling no change over the previous month. A reading above 50 indicates that the manufacturing economy is generally expanding, a bullish sign for the Renminbi (CNY). Meanwhile, a reading below 50 signals that activity among goods producers is generally declining, which is seen as bearish for CNY.
Read more.Last release: Mon Sep 01, 2025 01:45
Frequency: Monthly
Actual: 50.5
Consensus: 49.5
Previous: 49.5
Source: IHS Markit
Artigos Recomendados


