

Dow Jones Industrial Average climbs back over 38,300 as investors shrug off still-high PCE inflation
- Dow Jones determined to wrap up Friday in the green despite stubborn inflation.
- US PCE inflation remained higher than expected.
- Hopes for rate cuts now lean heavily on next week’s US NFP print.
The Dow Jones Industrial Average (DJIA) churned on Friday before pushing into the high end for the day as investors shake off still-high US Personal Consumption Expenditure (PCE) Price Index inflation. Markets are still pricing in a 44% chance of at least two rate cuts from the US Federal Reserve (Fed) this year, with 60% odds of a first rate trim in September according to the CME’s FedWatch Tool.
Read more: US Core PCE inflation holds steady at 2.8% vs. 2.6% expected
US Core PCE Price Index inflation held steady at 2.8% for the year ended in March, holding above the forecast decline to 2.6%. Headline PCE Price Index inflation also rose to 2.7% over the same period, climbing from 2.5% and accelerating above the forecast 2.6%.
Despite the uptick in a key inflation metric, market risk appetite remains high and rate markets are leaning into current rate cut expectations. Despite still-high inflation, price growth is still lower than many investors feared, and market participants will be increasingly focused on next Friday’s US Nonfarm Payrolls (NFP) report. A still-tight US labor market will have investors looking for slack in US labor figures to help push the Fed towards a first rate cut by September.
Dow Jones news
With earnings season in full swing, equities remain bullish overall as the trading week draws to a close. Two-thirds of the 30 securities that comprise the Dow Jones are in the green on Friday, with Amazon.com Inc. (AMZN) up around 3.7% at the time of writing and trading near $180.10 per share. Microsoft Corp. (MSFT) follows closely behind, gaining about 2.75% on the day to trade around $410.00 per share.
On the downside, Intel Corp. (INTC) is leading the Dow Jones board into the red, declining 9.7% to trade at $31.70 per share after the tech company released a weaker-than-expected forecast for the current quarter. Intel is expecting quarterly revenue between $12.5 and $13.5 billion, whereas market forecasts were hoping for at least $13.6 billion. Intel also expects adjusted earnings per share to fall below Wall Street forecasts.
Dow Jones technical outlook
The Dow Jones is trading well within the week’s price range, setting Friday’s low bids at 38,048.33 before recovering into an intraday high of 38,335.71. The major equity index is still down slightly from the week’s peak prices at 38,556.80, but is recovering firmly after setting the week’s lows at 37,745.54 on Thursday’s pullback.
The Dow Jones is set to snap a three-week losing streak, and on pace to close just north of the 38,300.00 handle after a 5.8% decline top-to-bottom from 39,887.49 that began in mid-March.
Dow Jones five-minute chart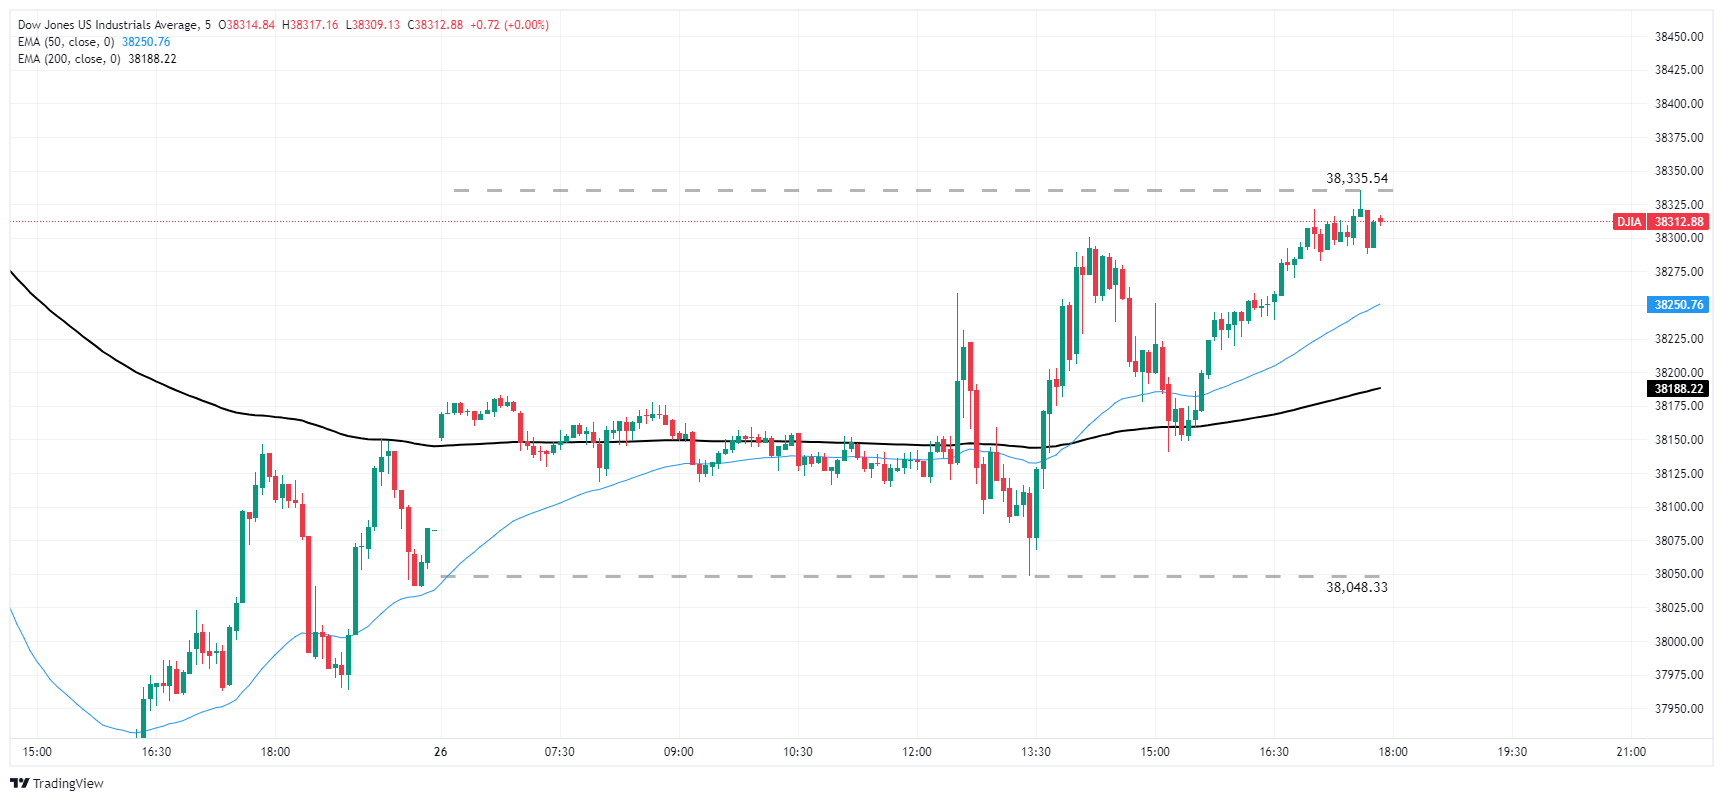
Dow Jones hourly chart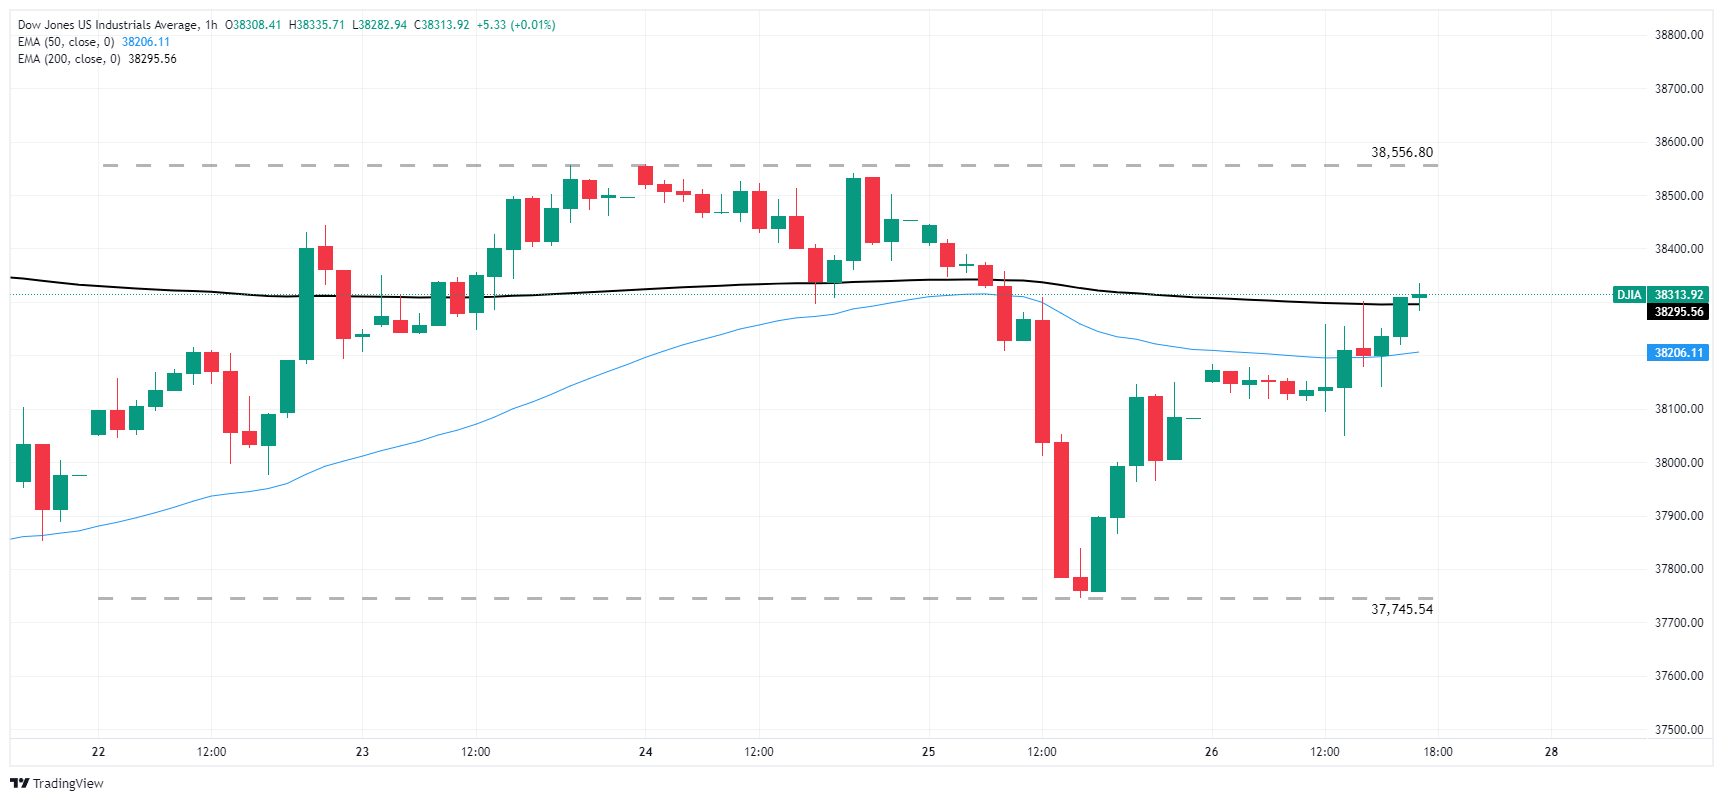
Dow Jones FAQs
The Dow Jones Industrial Average, one of the oldest stock market indices in the world, is compiled of the 30 most traded stocks in the US. The index is price-weighted rather than weighted by capitalization. It is calculated by summing the prices of the constituent stocks and dividing them by a factor, currently 0.152. The index was founded by Charles Dow, who also founded the Wall Street Journal. In later years it has been criticized for not being broadly representative enough because it only tracks 30 conglomerates, unlike broader indices such as the S&P 500.
Many different factors drive the Dow Jones Industrial Average (DJIA). The aggregate performance of the component companies revealed in quarterly company earnings reports is the main one. US and global macroeconomic data also contributes as it impacts on investor sentiment. The level of interest rates, set by the Federal Reserve (Fed), also influences the DJIA as it affects the cost of credit, on which many corporations are heavily reliant. Therefore, inflation can be a major driver as well as other metrics which impact the Fed decisions.
Dow Theory is a method for identifying the primary trend of the stock market developed by Charles Dow. A key step is to compare the direction of the Dow Jones Industrial Average (DJIA) and the Dow Jones Transportation Average (DJTA) and only follow trends where both are moving in the same direction. Volume is a confirmatory criteria. The theory uses elements of peak and trough analysis. Dow’s theory posits three trend phases: accumulation, when smart money starts buying or selling; public participation, when the wider public joins in; and distribution, when the smart money exits.
There are a number of ways to trade the DJIA. One is to use ETFs which allow investors to trade the DJIA as a single security, rather than having to buy shares in all 30 constituent companies. A leading example is the SPDR Dow Jones Industrial Average ETF (DIA). DJIA futures contracts enable traders to speculate on the future value of the index and Options provide the right, but not the obligation, to buy or sell the index at a predetermined price in the future. Mutual funds enable investors to buy a share of a diversified portfolio of DJIA stocks thus providing exposure to the overall index.
Artigos Recomendados


