


Bitcoin Price Forecast: BTC consolidates as Trump’s budget bill and tariff chatter resume
- Bitcoin price hovers in a range-bound scenario after a 7.32% rally the previous week.
- Reports indicate that Trump’s budget deadline and tariff pause expiration in early July could impact the price of BTC.
- US-listed spot BTC ETFs recorded an outflow of $342.25 on Tuesday, breaking the ongoing streak of inflow since June 9.
Bitcoin (BTC) is trading within a tight range after last week’s strong rally as traders turn cautious ahead of key macroeconomic developments. Reports indicate that the upcoming US President Donald Trump’s One Big Beautiful Bill deadline is on Friday, and the tariff pause expiration in early July could introduce fresh uncertainty into the market. This cautious sentiment could be seen in the spot Bitcoin Exchange Traded Fund (ETF) data, which recorded over $340 million in outflows on Tuesday, ending its 15-day streak of steady inflows since June 9.
Bitcoin traders de-risk amid trade uncertainty
A K33 report on Tuesday highlighted that BTC has consolidated in a very narrow range throughout the week, with the 7-day volatility declining to 0.79%, the lowest recorded 7-day volatility since October 14, 2023, as shown in the graph below.

BTC-USD Volatility chart. Source: K33 Research
The Iran-Israel war ceasefire last week triggered a rally in BTC, which rose by over 7%, closing above $108,000. However, this rally came to a pause, and BTC dipped below $106,000 on Tuesday as political developments, mainly US President Donald Trump’s budget bill and tariff chatter, resumed.
Trump’s One Big Beautiful Bill (OBBB) passed the Senate on Tuesday following a 51-50 vote by lawmakers. The bill now heads back to the House as Trump aims to finalize the budget bill by Friday. Moreover, the tariff pause expires on July 9. Both situations could sway BTC depending on whether fiscal expansion or trade uncertainty dominates.
Apart from the OBBB bill and tariff pause expiration, reduced liquidity due to the July 4 Independence Day holiday may contribute to near-term market uncertainty and deter traders from taking risks.
Furthermore, some US macroeconomic data is expected this week, with the US employment report, including Nonfarm Payrolls (NFP) figures, scheduled for release on Thursday, which may again impact the market’s interest rate expectations.
Bitcoin institutional flow shows early signs of weakness
Bitcoin institutional demand shows early signs of weakness. According to SoSoValue data, US spot Bitcoin ETFs recorded an outflow of $342.25 million on Tuesday, the highest outflow since May 30 and also breaking a 15-day streak of inflows since June 9. If this institutional outflow continues and intensifies, the BTC price could decline further.
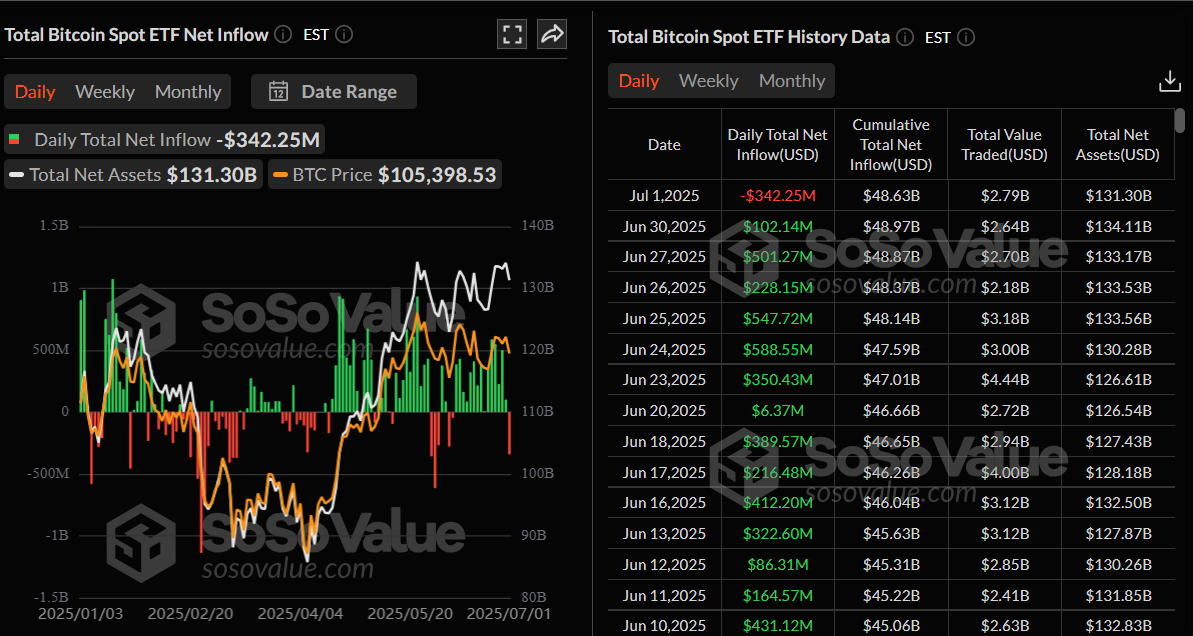
Total Bitcoin spot ETF net inflow daily chart. Source: SoSoValue
Arizona’s Bitcoin reserve bill, HB2324, was revived last month, aiming to establish a fund from digital assets seized through criminal asset forfeiture. However, it failed to become law after the state's Governor Katie Hobbs rejected the proposal on Tuesday.
Hobbs vetoed the bill stating that it would disincentivize local law enforcement from cooperating with the state in cases involving digital asset forfeiture.

Bitcoin Price Forecast: BTC in a range-bound scenario
Bitcoin price has been consolidating in a narrow range between $105,333 and $108,355 since June 25. At the time of writing on Wednesday, it rebounds after restest its lower boundary and trades at around $107,600.
If BTC breaks and closes above the upper consolidating boundary at $108,355 on a daily basis, it could extend the rally toward the May 22 all-time high at $111,980.
The Relative Strength Index (RSI) on the daily chart reads 55 and points upward after rebounding from its neutral level of 50, indicating bullish momentum is gaining traction. The Moving Average Convergence Divergence (MACD) on the daily chart displayed a bullish crossover last week. It also showed rising green histogram bars above its neutral level, suggesting bullish momentum and indicating an upward trend.
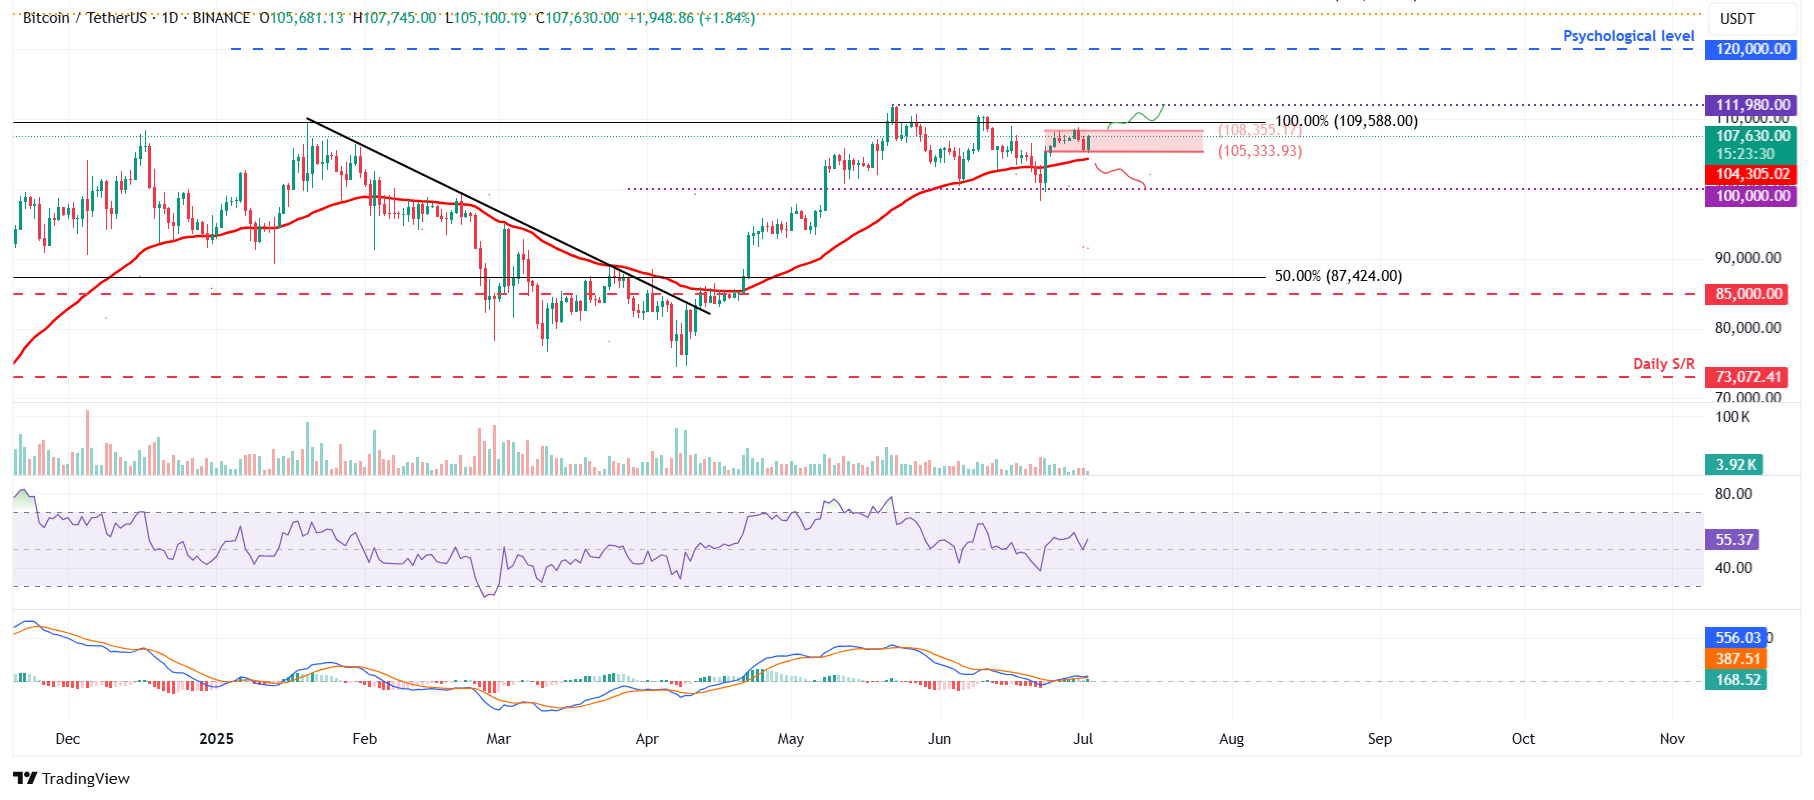
BTC/USDT daily chart
However, if BTC breaks below the lower consolidating boundary at $105,333 and closes below the 50-day Exponential Moving Average at $104,305 on a daily basis, this scenario could extend the decline toward its key psychological level of $100,000.
Bitcoin, altcoins, stablecoins FAQs
Bitcoin is the largest cryptocurrency by market capitalization, a virtual currency designed to serve as money. This form of payment cannot be controlled by any one person, group, or entity, which eliminates the need for third-party participation during financial transactions.
Altcoins are any cryptocurrency apart from Bitcoin, but some also regard Ethereum as a non-altcoin because it is from these two cryptocurrencies that forking happens. If this is true, then Litecoin is the first altcoin, forked from the Bitcoin protocol and, therefore, an “improved” version of it.
Stablecoins are cryptocurrencies designed to have a stable price, with their value backed by a reserve of the asset it represents. To achieve this, the value of any one stablecoin is pegged to a commodity or financial instrument, such as the US Dollar (USD), with its supply regulated by an algorithm or demand. The main goal of stablecoins is to provide an on/off-ramp for investors willing to trade and invest in cryptocurrencies. Stablecoins also allow investors to store value since cryptocurrencies, in general, are subject to volatility.
Bitcoin dominance is the ratio of Bitcoin's market capitalization to the total market capitalization of all cryptocurrencies combined. It provides a clear picture of Bitcoin’s interest among investors. A high BTC dominance typically happens before and during a bull run, in which investors resort to investing in relatively stable and high market capitalization cryptocurrency like Bitcoin. A drop in BTC dominance usually means that investors are moving their capital and/or profits to altcoins in a quest for higher returns, which usually triggers an explosion of altcoin rallies.
Artigos Recomendados


