


Bitcoin Price Forecast: BTC eyes $80K as Coinbase traders raise demand 145%
Bitcoin price hit a new all-time high of $76,825 on Thursday, November 7, and continued to consolidate above the $76,000 level on Friday.
On-chain data trends show unusually high demand for BTC among US-based traders on Coinbase over the past two weeks.
With the US Fed’s 25-basis-point rate cut further fuelling bullish momentum, is BTC price poised for a major breakout above $80,000?
Bulls eye more gains after Fed rate cut as BTC Holds $76K
Bitcoin price has been on the uptrend over the past week, initially fuelled by Donald Trump’s victory at the November 5 polls.
However, the bullish crypto market momentum intensified on November 7, after the US Federal Reserve (Fed) announced a 25 bps rate cut.
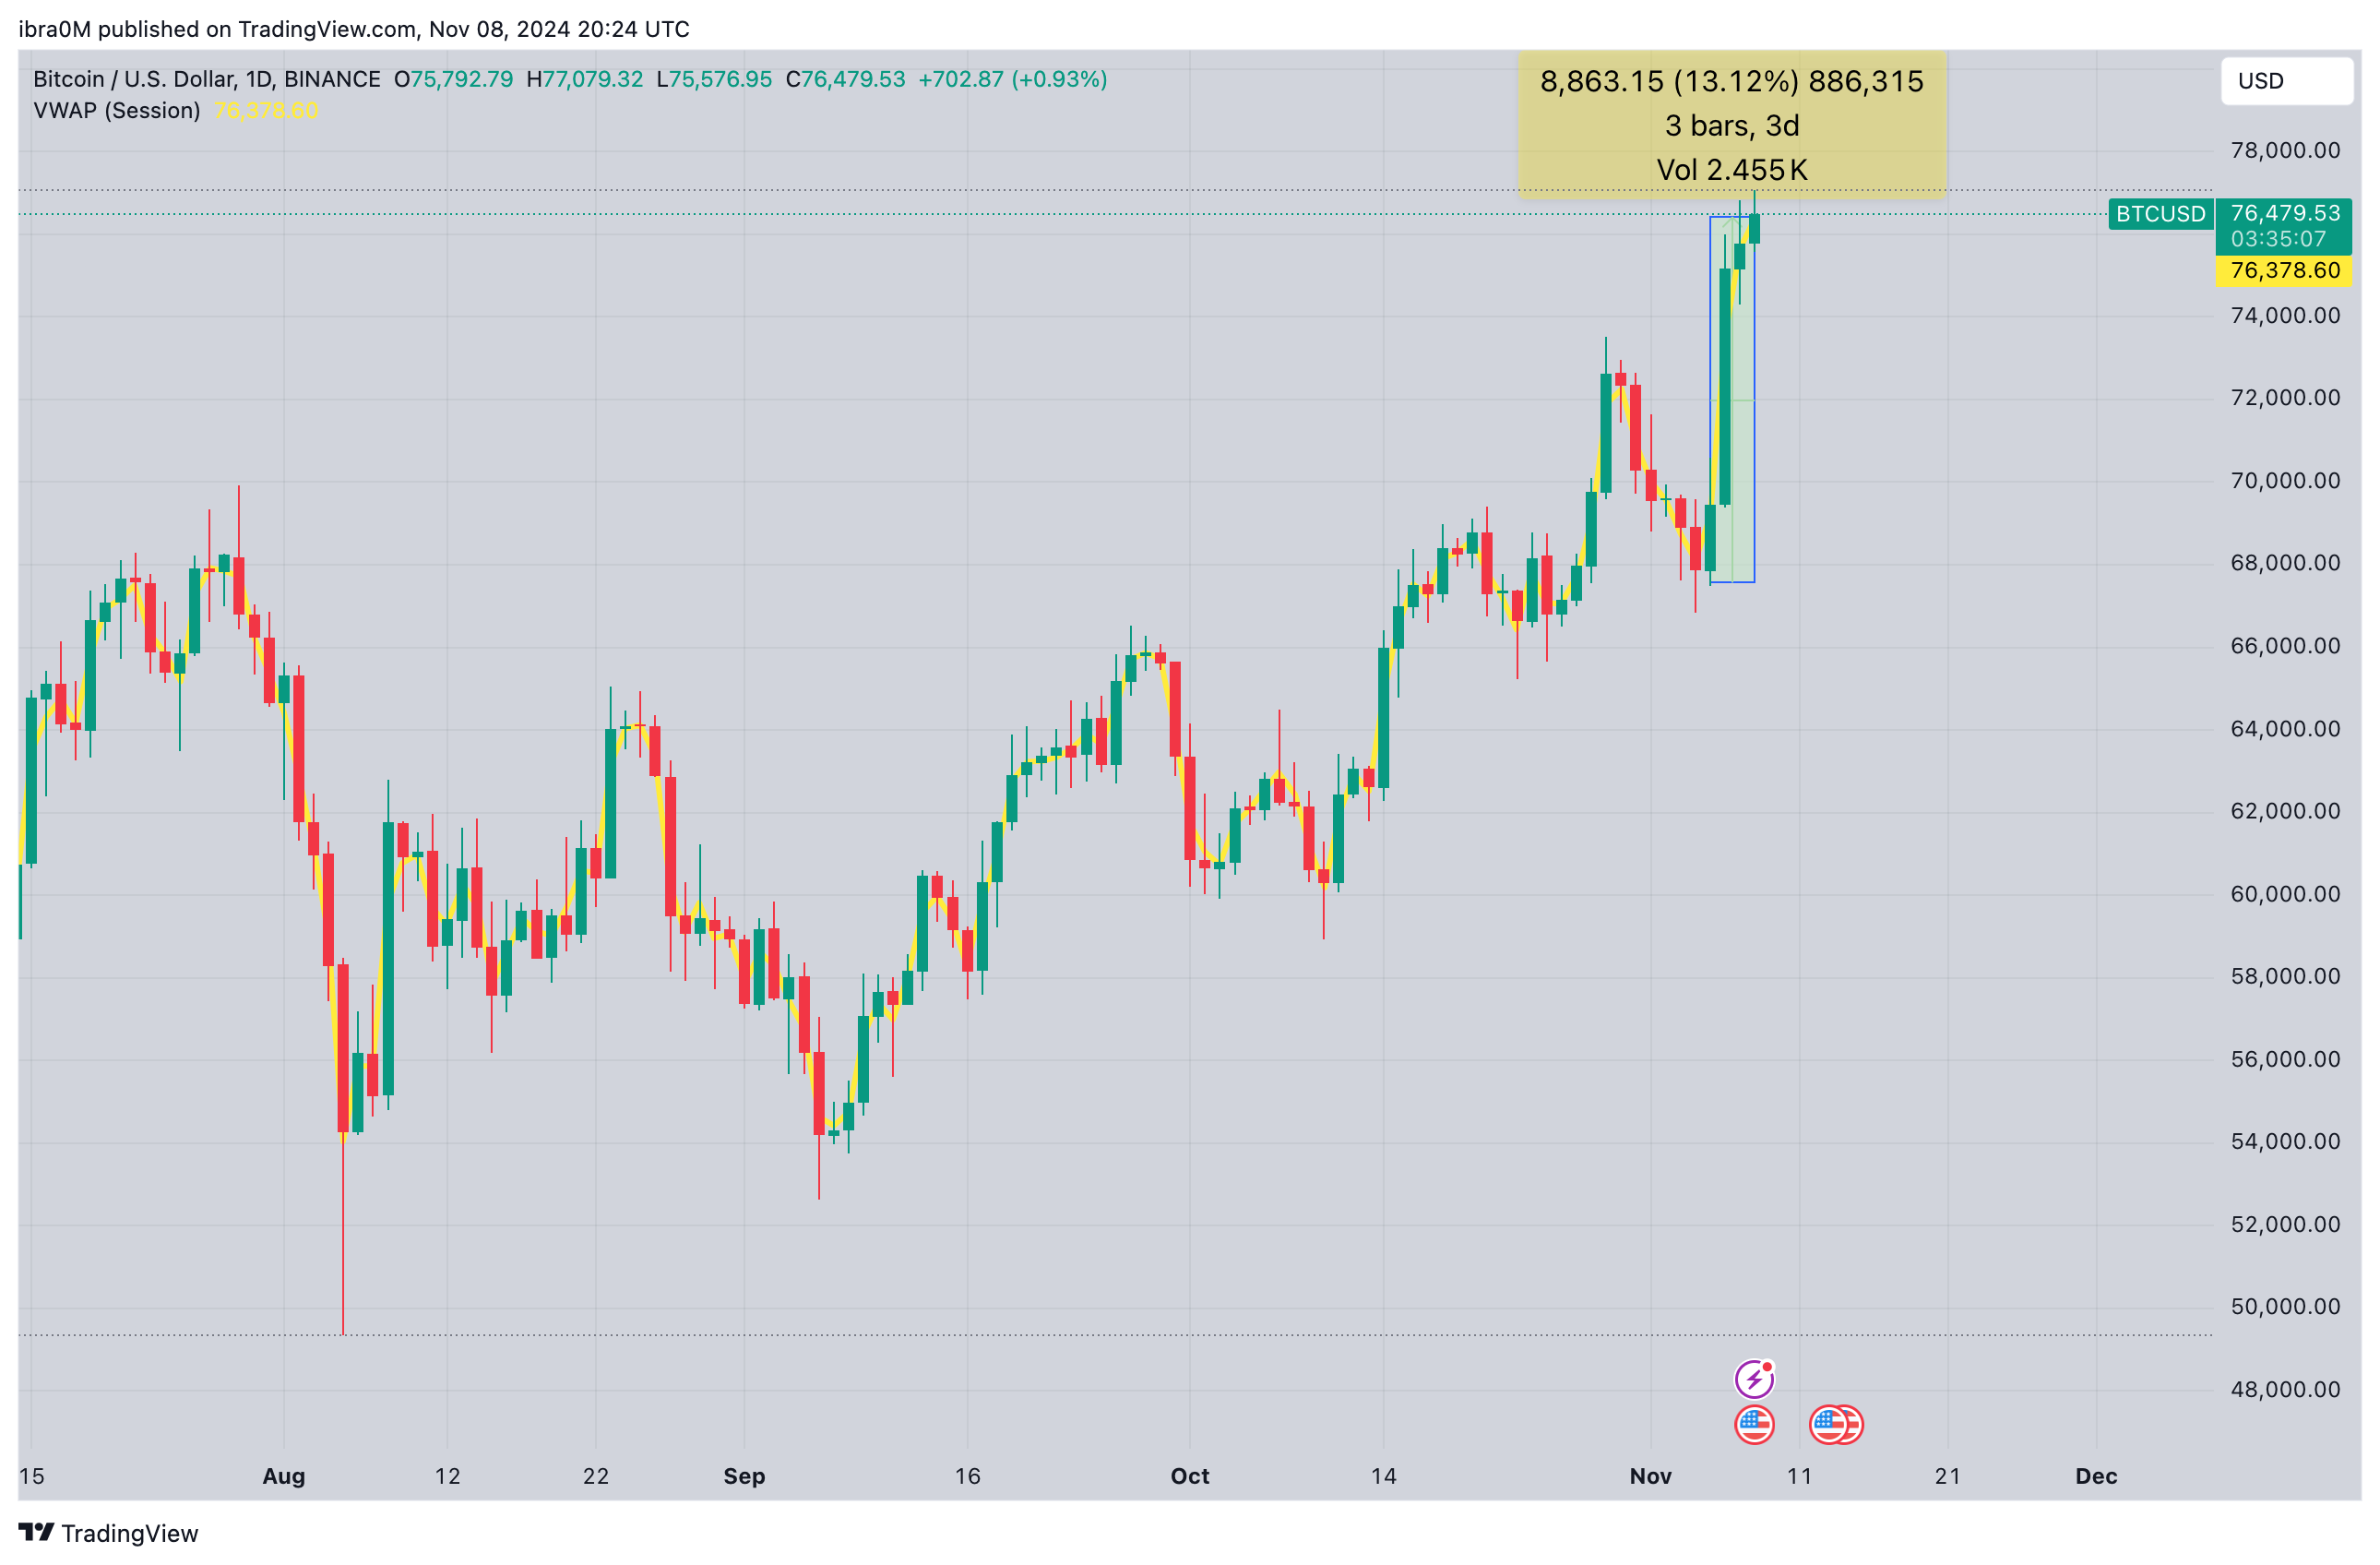
Bitcoin daily chart from Binance | BTCUSD
The chart above shows how BTC price raced to new all-time high above $76,800 following the rate cut decision. The Fed rate cut announcement on Thursday added fresh momentum, helping Bitcoin avoid an early pullback.
At the time of writing on November 8, BTC is perched above the $76,250 mark, up 13% from the November 5 election day opening price of $67,866.
With virtually 100% of current Bitcoin holders in profit, the majority appear unwilling to sell amid expectations that the dovish Fed could spur more capital inflows toward the risky assets markets as Q4 2024 unfolds.
Coinbase data shows US demand for BTC at 200-day highs
In response to multiple bullish catalysts from the political landscape and dovish macro-economic tweaks, Bitcoin demand among US-based investors has risen considerably in recent weeks.
CryptoQuant’s Coinbase Premium Index (CP Index) metric serves as a proxy for monitoring demand swings among US investors by tracking the marginal differences in BTC prices quoted on Coinbase and Binance.
The Coinbase clientele is dominated by US-based investors seeking to trade within a more regulated environment, while Binance dominates global retail trading.
Hence, during periods of intense buying pressure among US investors, the CP index swings into positive values as Bitcoin prices rise on Coinbase marginally, above prices quoted on Binance, and vice versa.
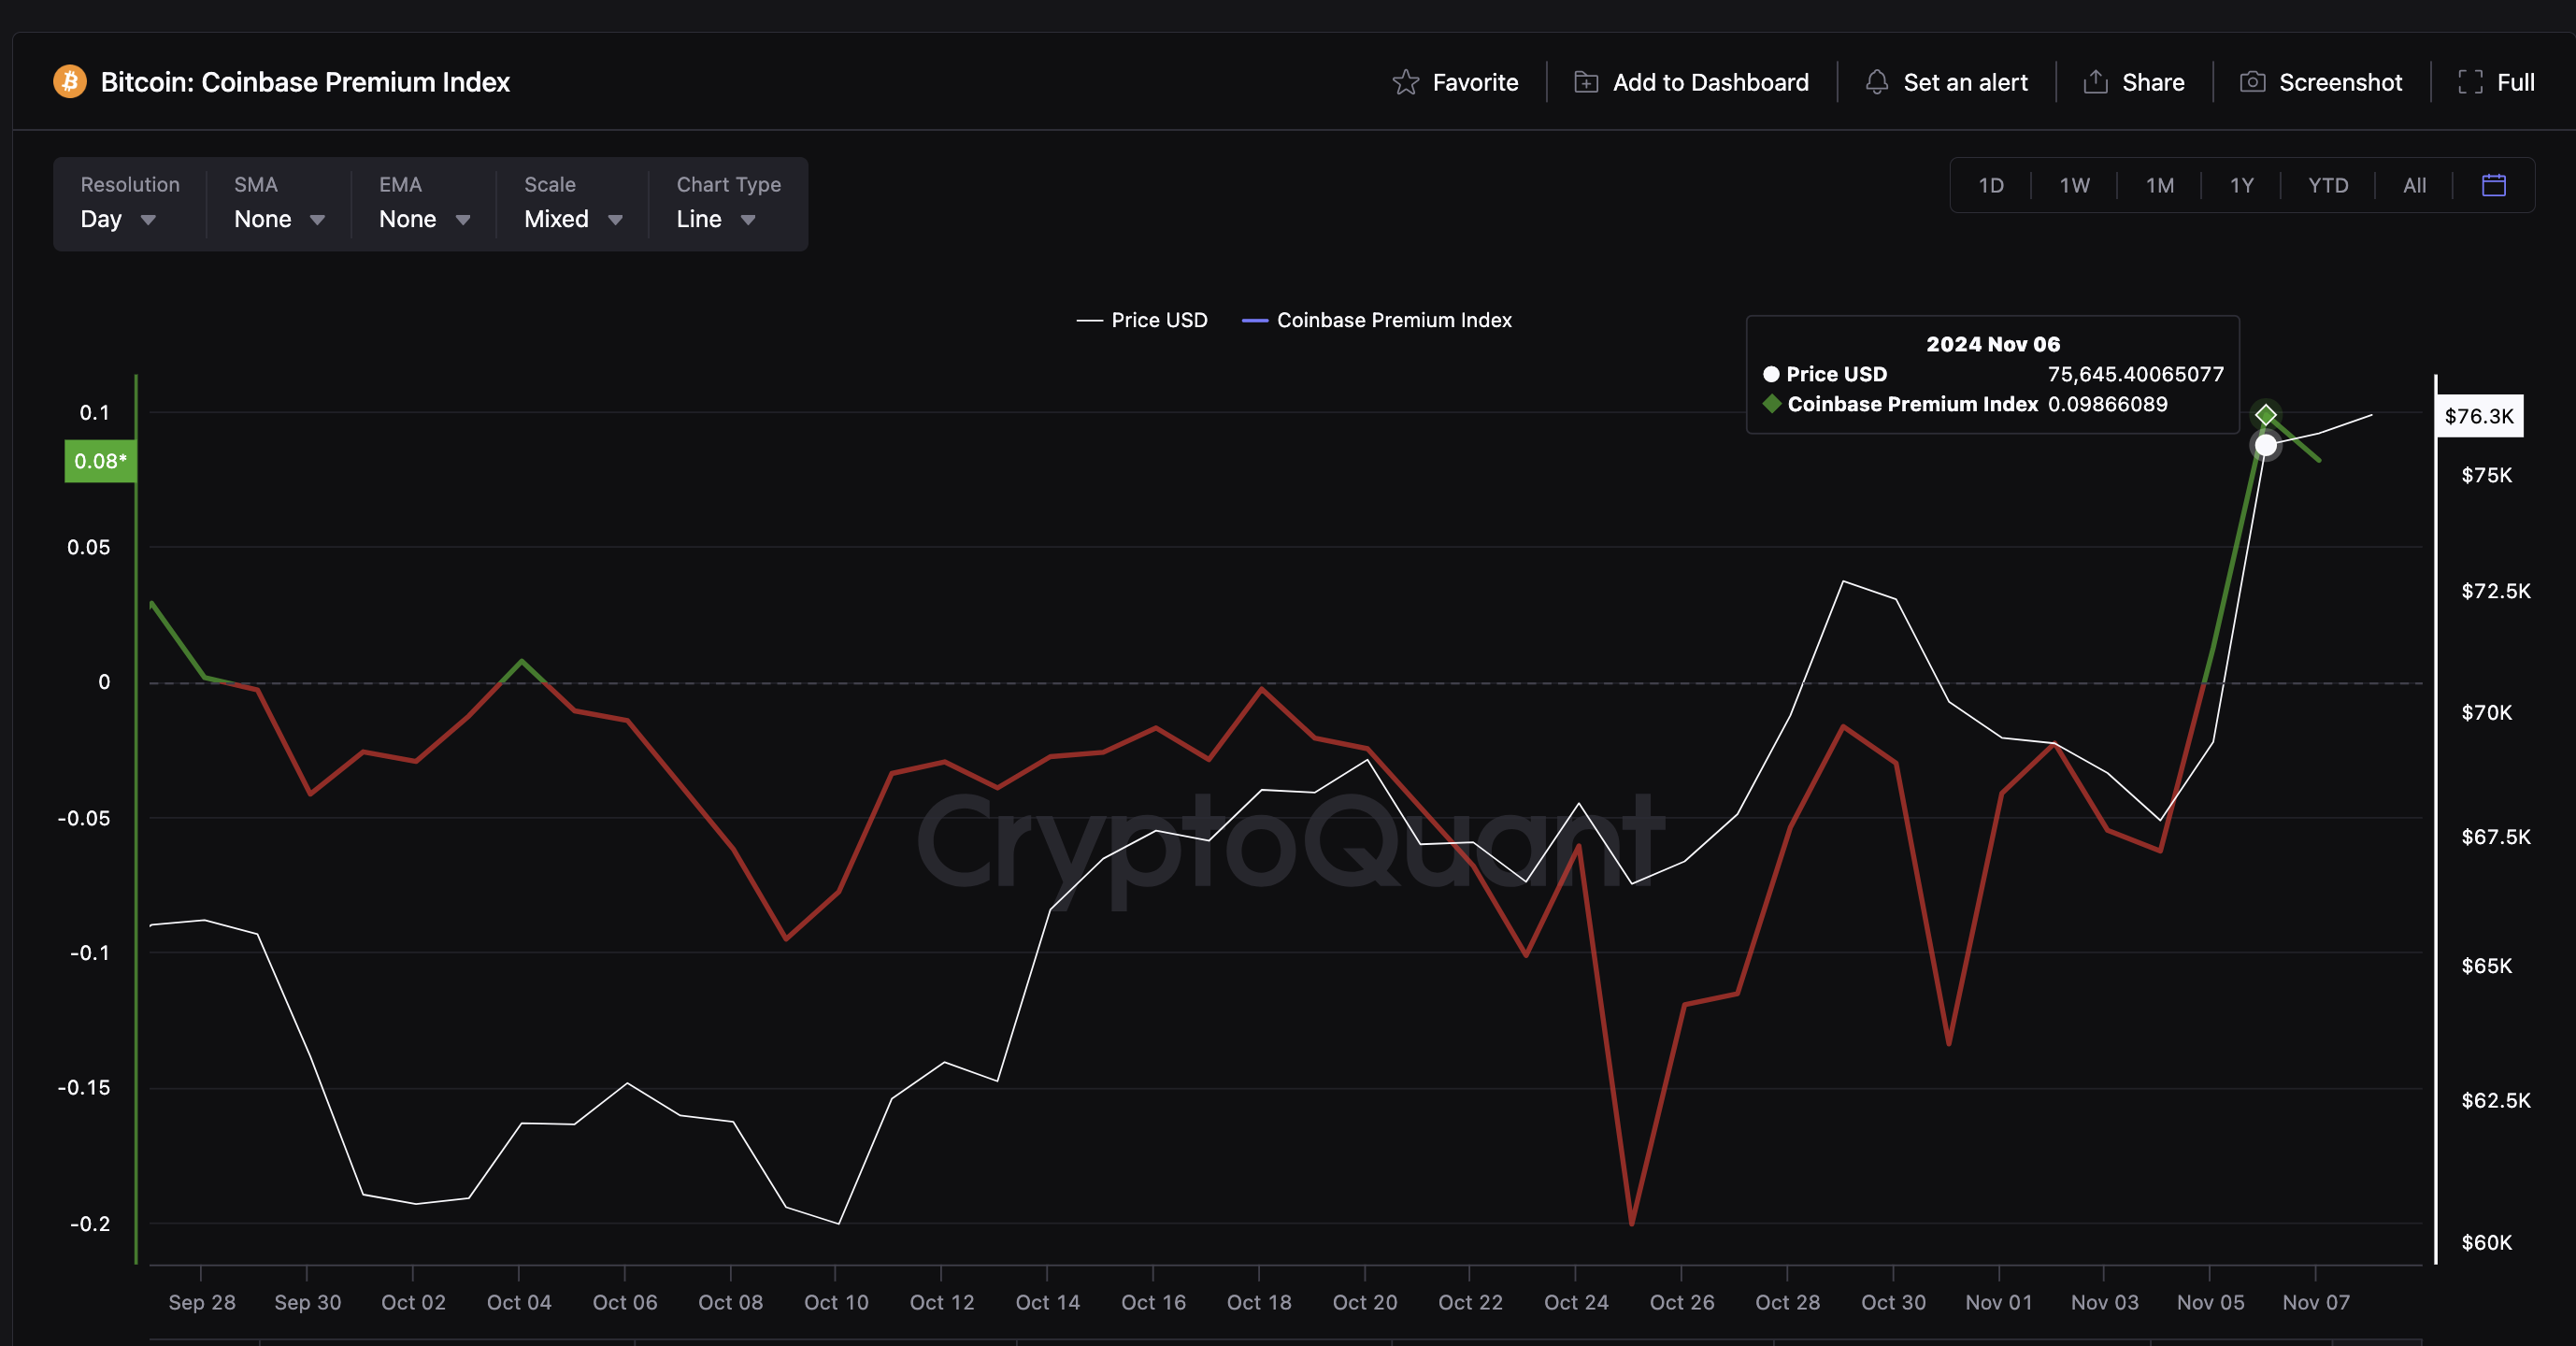
Bitcoin price vs. Coinbase Premium Index (CP Index) | Source: CryptoQuant
The chart above shows that the Bitcoin Coinbase Premium Index has consistently trended upward in the last 14 days. The CP Index rose from -0.02 on October 25 to hit a 220-day peak of 0. 09 on November 7.
This reflects a 145% Bitcoin demand surge among US investors over the last two weeks, propelled by the euphoria of Donald Trump’s victory.
Following the Fed rate cut on November 7, the Bitcoin CP index remains in positive territory, signaling that buying momentum remains strong despite prices trending toward all-time highs.
If this trend persists, Bitcoin price could potentially enter another leg-up toward the $80,000 level in the days ahead.
Bitcoin Price Forecast: $80K hopes alive if $76K support holds
Bitcoin's price action continues to show bullish momentum, with prices on Binance trading above the VWAP, signaling that buyers are paying premiums to acquire BTC.
This demand intensity reinforces the upward trend as traders are eager to lock in positions, pushing prices higher. As long as the $76,000 support holds, the path to an $80,000 breakout remains intact.
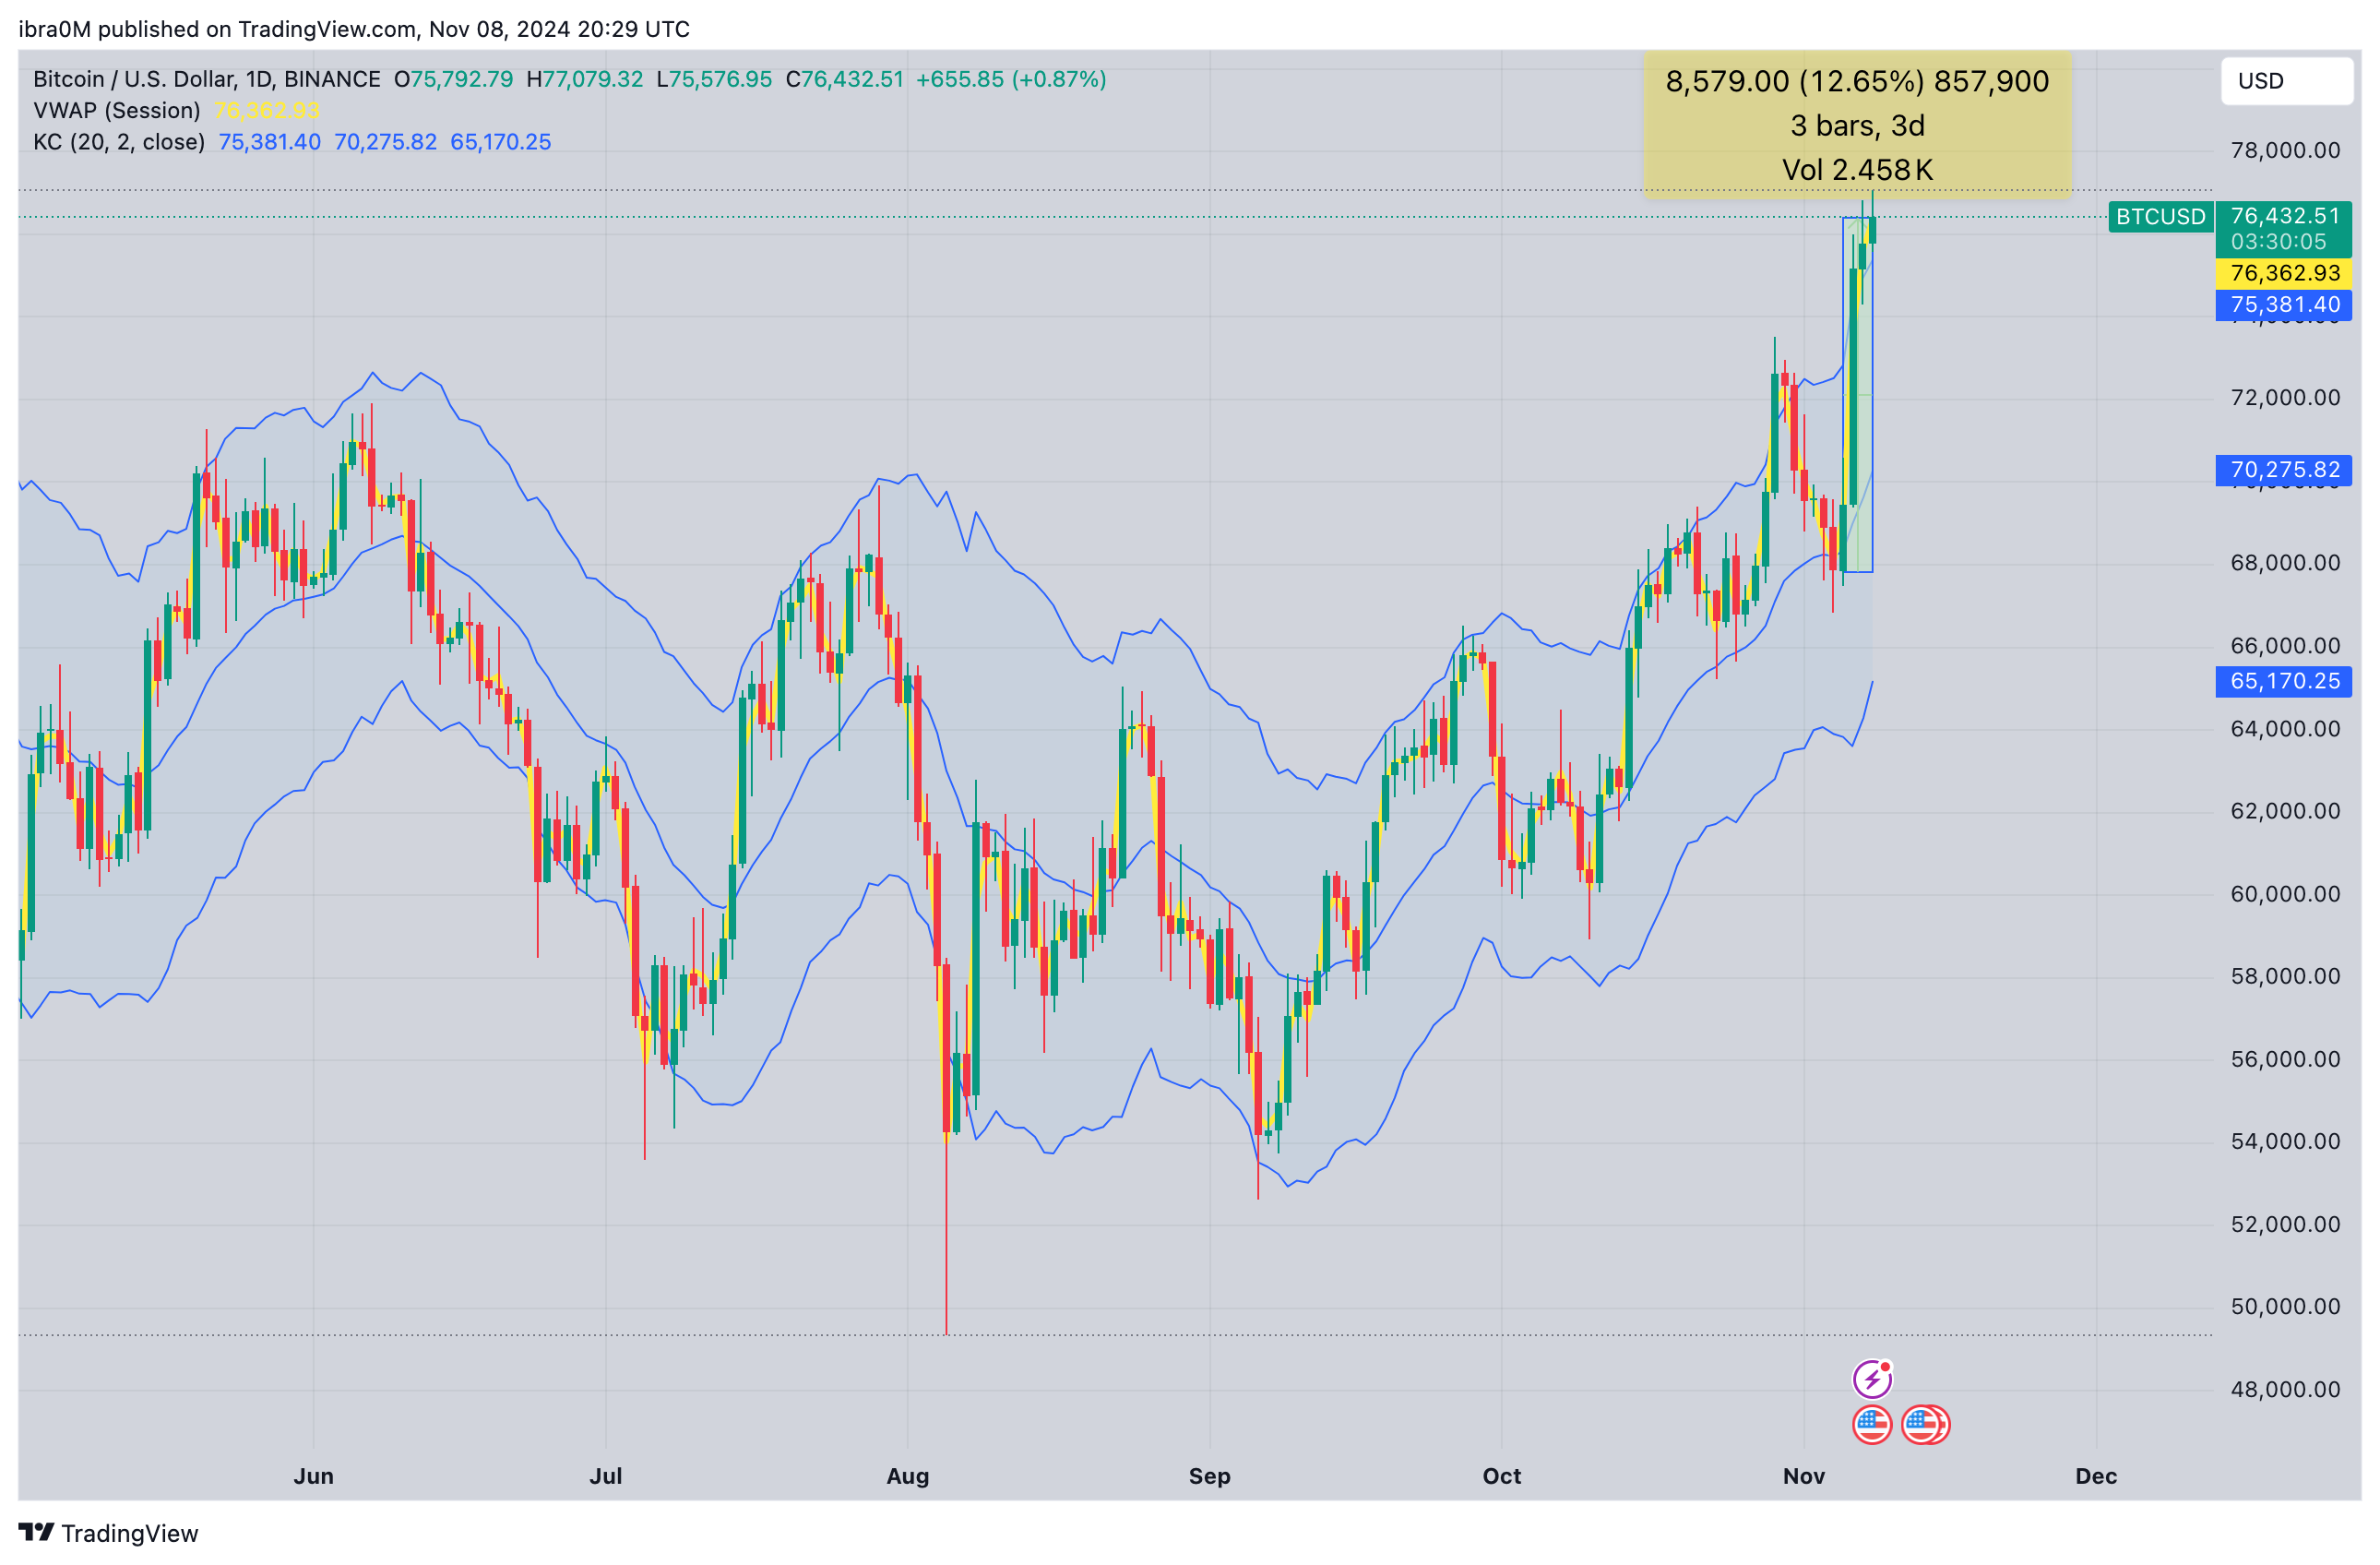
Bitcoin Price Forecast | BTCUSD
In terms of upward price actions, Bitcoin’s next major resistance level lies at the $80,000 milestone price level.
The Keltner Channel bands on the chart also support this bullish outlook, as BTC is trading near the upper band, indicating strong momentum.
On the downside, failure to hold $76,000 could see Bitcoin pull back toward the middle Keltner line around $70,275. However, BTC trending above its current VWAP, suggests buyers remain dominant, keeping the $80,000 target within reach.
Artigos Recomendados


