


Polygon launching new “Aggregation chain” could prevent a 41% decline for MATIC price
- Polygon announced a new scaling paradigm called “Aggregation” after Monolithic & Modular was launched.
- Set to go live on the mainnet in February, the aggregation chain will introduce unified liquidity across the entire Polygon ecosystem.
- MATIC price, on the other hand, is witnessing a bearish Head and Shoulders pattern, which suggests a 41% crash is likely.
MATIC price has a shot at invalidating the bearish momentum building up on its chart owing to crucial network development. Polygon is making advances in the interoperability space, and it is starting with intra-operability with a twist.
Polygon launches ”Aggregation”
Polygon took to X, formerly Twitter, to announce the launch of its new “Aggregation” chain that is set to act as a blockchain scaling paradigm. This would be the next in line after the Monolithic and Modular paradigm. As described by Polygon, Aggregation is,
“A novel solution combining the benefits of monolithic & modular designs by unifying liquidity via safe, near-instant atomic cross-chain txs using ZK proofs.
Put simply, Aggregation leverages the good parts of Monolithic and Modular paradigms by combining the scaling efficiency of Monolithic and the sovereignty obtained from Modular. Furthermore, the “AggLayer” will act as a shared sequencer by operating as a decentralized protocol that enables atomic, synchronous composability across aggregated chains without sacrificing sovereignty.
Set to go live on the Polygon mainnet in February, the development is expected to draw the attention of the crypto community.
Some, however, did not seem to be truly on board with the plans, as a user tweeted,
While others are pining for a more positive response from the price action.
MATIC price gets a lifeline
MATIC price,, currently trading at $0.73, is presently trading below the crucial support line of $0.75. This line had not been broken through in nearly two months, intensifying the bearish momentum.
This momentum first gained strength as MATIC fell through the neckline of $0.75 on a bearish Head and Shoulders price pattern. This bearish reversal formation indicates a likely trend reversal.
Its significance lies in signaling a shift from bullish to bearish sentiment. The connecting neckline, linking the lows of the peaks of the head and two shoulders on either side, becomes crucial, with a confirmed breach beneath it serving as a strong indicator of a potential downtrend.
In the case of MATIC, this neckline is formed at $0.75 and falls below $0.70 or $0.65 will confirm the bearish pattern. However, for the head and shoulders to succeed, MATIC would need to correct to $0.43, which is the target price set according to the pattern. This decline would mark a 41% crash.
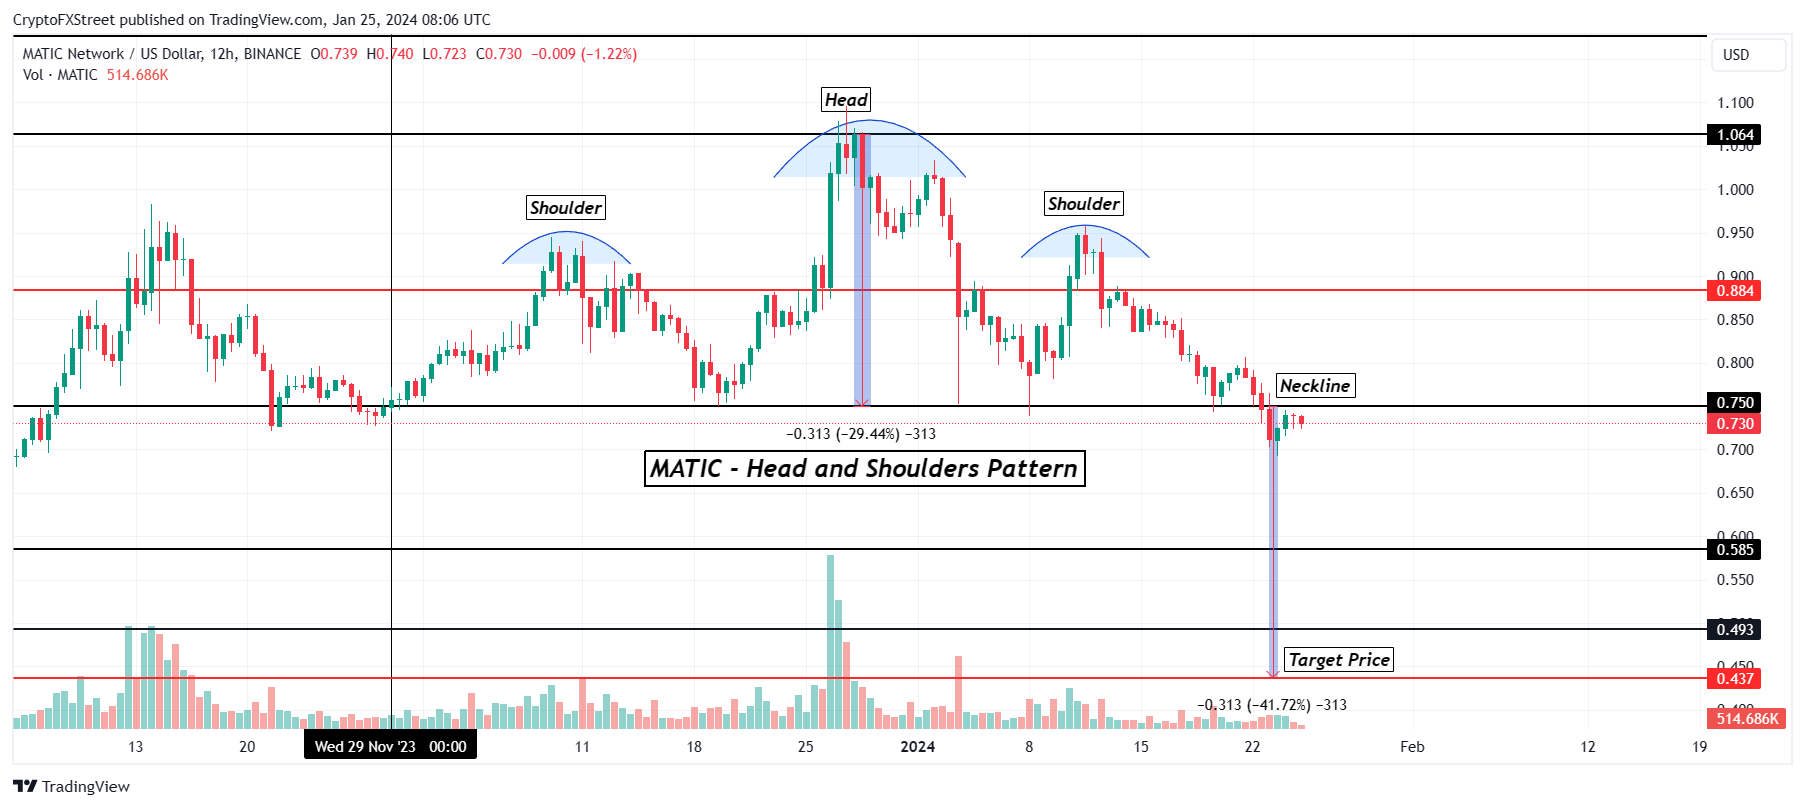
MATIC/USD 1-day chart
But if the altcoin can manage to prevent a decline below the $0.65 mark or bounce off $0.70, it could invalidate the head and shoulders pattern. In doing so, it would also invalidate the bearish thesis and likely shoot up to $0.80 and beyond.
Artigos Recomendados


