


Bitcoin Weekly Forecast: BTC correction deepens as Fed stance, US-Iran risks, mining disruptions weigh
- Bitcoin price extends its correction, trading below $82,000 and posting weekly losses of nearly 5% through Friday.
- US-listed spot ETFs record the largest single-day outflow since mid-November, bringing the total weekly withdrawals to $978 million through Thursday.
- Bearish sentiment strengthens following the Fed’s lack of dovish guidance, escalating US–Iran geopolitical tensions, and disruptions to Bitcoin mining activity.
Bitcoin (BTC) price extends correction, trading below $82,000 after sliding more than 5% so far this week. The bearish price action in BTC was fueled by fading institutional demand, as evidenced by spot Exchange-Traded Funds (ETFs), which recorded $978 million in inflows through Thursday. In addition, this week’s Federal Reserve (Fed) press conference lacked dovish guidance, while US–Iran geopolitical tensions and disruptions to Bitcoin mining activity further supported the Crypto King’s deeper correction.
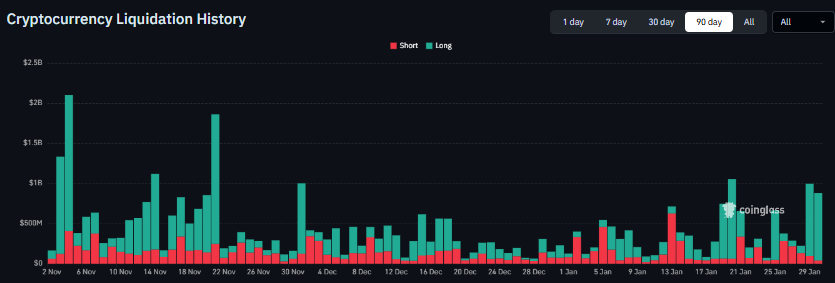
Massive liquidation
Bitcoin price started the first half of the week on a positive note, recovering slightly after a massive correction last week, but failed to close above the $90,000 on Wednesday. The price declined 5.21% on Thursday, erasing recent gains and extending its correction, reaching a low of $81,118 as of Friday.
This sudden price drop sparked a wave of liquidations across the market, wiping out over $1.87 billion in leveraged positions during the latter half of this week, according to Coinglass data. Notably, over 90% were long positions, underscoring the market’s overly bullish positioning.
Fed’s lack of a dovish stance weighs on risky assets
Bitcoin price correction this week was further driven by the Federal Reserve’s interest rate decision. The central bank decided to leave rates unchanged in the 3.50%-3.75% range at the end of its two-day meeting on Wednesday. However, two Fed Governors – Stephen Miran and Christopher Waller – dissented in favor of a 25 basis-point (bps) interest rate cut. This move was anticipated by traders, which kept riskier assets such as Bitcoin in a wait-and-see mode.
However, the lack of dovish guidance following the post-meeting press conference, in which Fed Chair Jerome Powell stated that inflation was still well above the 2% target, weighed on BTC.
In addition, investors remain concerned about threats to the central bank’s independence. A criminal investigation of Powell by the Department of Justice and an evolving effort to remove Fed Governor Lisa Cook from her job have focused attention on the independence of monetary authorities from direct political interference.
Moreover, on Thursday, US President Donald Trump said that he would announce his choice to replace Powell as the next head of the Fed this Friday, with a rising probability that Kevin Warsh could be appointed.
Trump also criticized the central bank reiterating that it should substantially lower interest rates, further signaling political pressure and a threat to the Fed’s independence.
Meanwhile, traders seem convinced that the bank will maintain the status quo through the end of this quarter and possibly until Chair Jerome Powell’s tenure ends in May, although they still price in two more rate cuts in 2026, which could provide longer-term support for BTC.
Rising geopolitical tensions
Riskier assets have remained under pressure since midweek amid escalating tensions between the US and Iran, which continue to weigh on market sentiment. On Thursday, US President Donald Trump was weighing options against Iran that include targeted strikes on security forces and leaders to inspire protesters.
“The arrival of a US aircraft carrier and supporting warships in the Middle East this week has expanded Trump’s capabilities to potentially take military action, after he repeatedly threatened intervention over Iran’s crackdown,” reported Reuters.
Earlier on Wednesday, Trump urged Iran to come to the table and make a deal on nuclear weapons, warning that any future US attack would be more severe than a June bombing campaign. Iran responded with a threat to strike back against the US, Israel and those who support them.
These growing geopolitical tensions have triggered a risk-off sentiment among investors, prompting them to move toward safe-haven assets such as Gold (XAU) and Silver (XAG), whose prices reached new all-time highs on Thursday and have since corrected amid profit-taking activity. In contrast, riskier assets, such as Bitcoin, faced a correction.
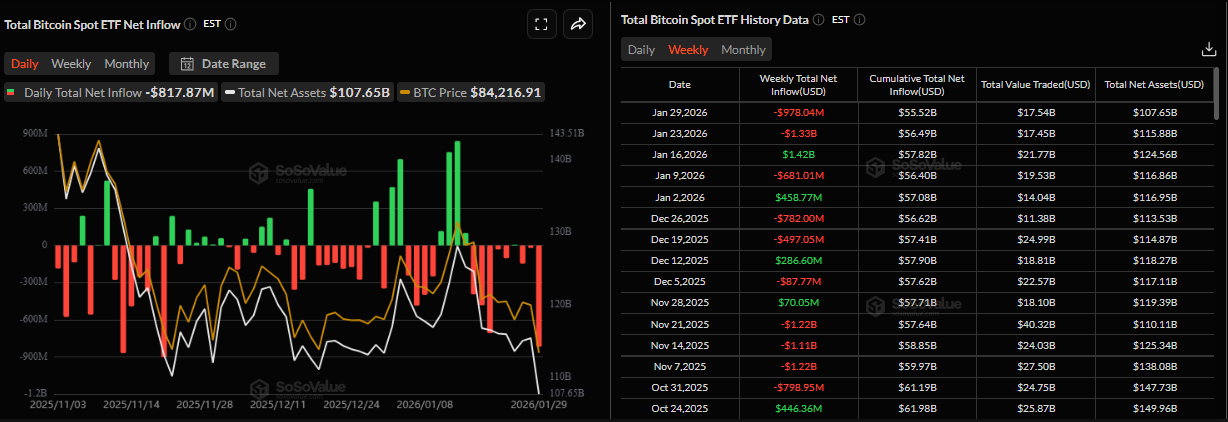
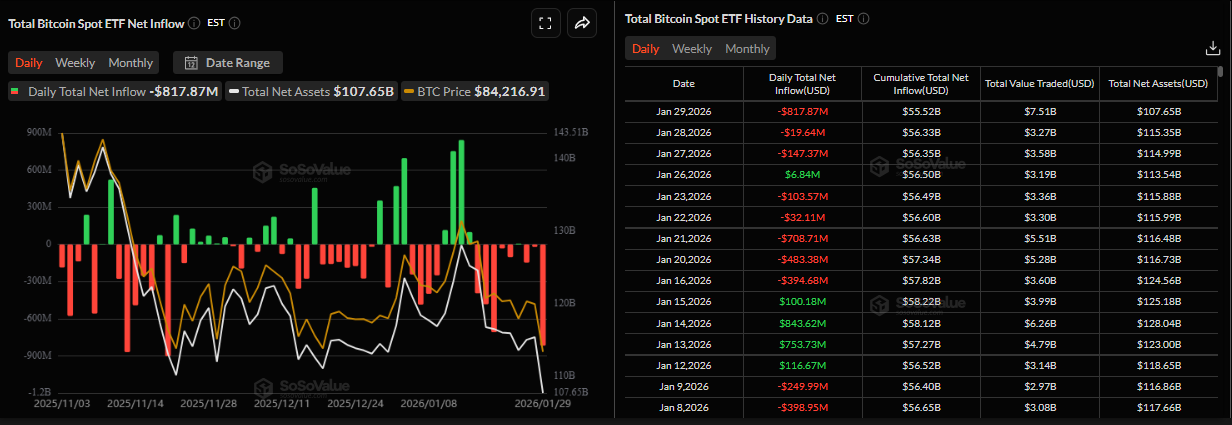
Institutional outflow continues to strengthen
Bitcoin price correction this week was further supported by fading institutional demand. The SoSoValue chart below shows that spot Bitcoin Exchange-Traded Funds (ETFs) recorded a total outflow of $978.04 million through Thursday, marking their second consecutive weekly outflow. Moreover, Thursday’s outflow highlighted the highest single-day outflow of $817.87 million since November 21. If these outflows continue and intensify, BTC could see further correction.
On the corporate front, Strategy (MSTR) announced on Monday that the company purchased 2,932 BTC, following the addition of 22,350 BTC last week, bringing the total holding to 712,647 BTC. This purchase highlights the firm’s continued aggressive accumulation strategy and long-term conviction in Bitcoin despite ongoing market weakness.
However, traders should remain cautious, as the recent decline to $81,000 this week brings Bitcoin closer to Strategy’s average buying price of $76,037, a key level to watch that could serve as an important support zone.
US winter storm disrupts Bitcoin mining operations
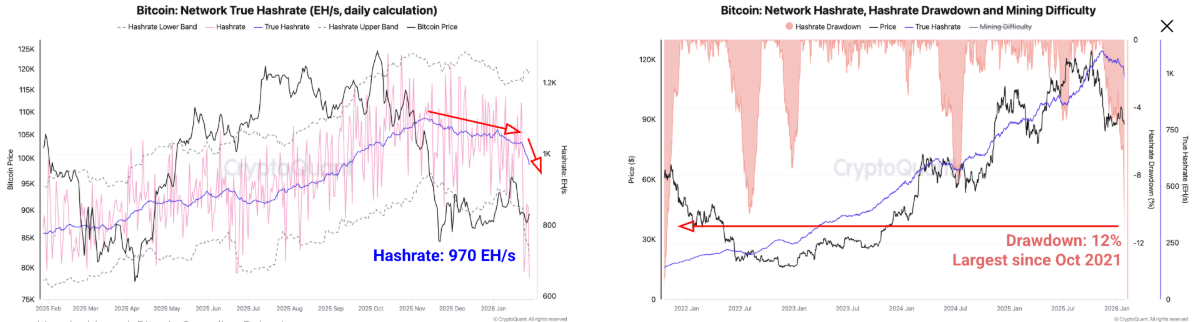
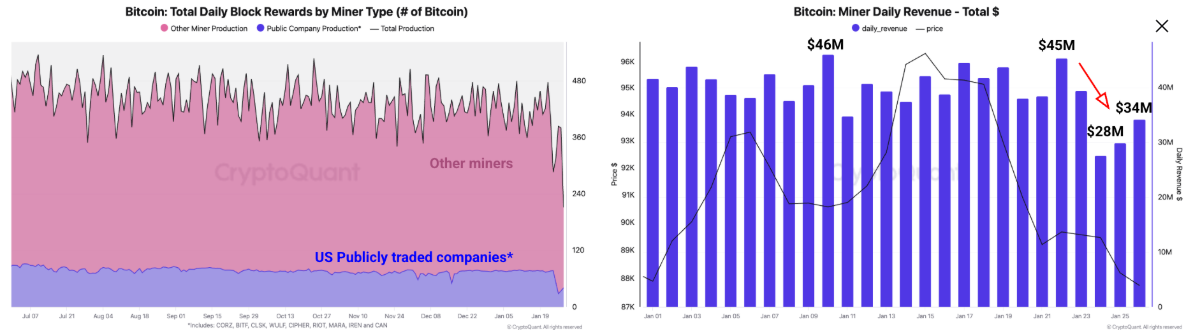
CryptoQuant’s weekly report released on Thursday highlighted that Bitcoin mining activity was disrupted by the US winter storm, leading several large US mining firms to curtail operations.
This shutdown had accelerated a 12% network hashrate drawdown, the largest decline since October 2021, with hashrate falling to 970 EH/s, its lowest level since September 2025, as shown in the chart below.
“The Hashrate has declined 12% since November 11, 2025, compared to a 14% drawdown in October 2021, when Bitcoin’s hashrate was recovering from the China mining ban,” reports CryptoQuant's analyst.
The analyst further explained that Bitcoin’s daily mining revenue declined to its lowest level of the year as mining operations were curtailed in response to the storm.
Daily mining revenues dropped from $45 million on January 22 to a yearly low of $28 million two days later. Daily revenues have not fully recovered, standing at $34 million on January 26.
These disruptions to Bitcoin mining, as reflected by a drop in hashrate, can weigh on the BTC price in the short term by raising concerns about miner stress and potential selling pressure.
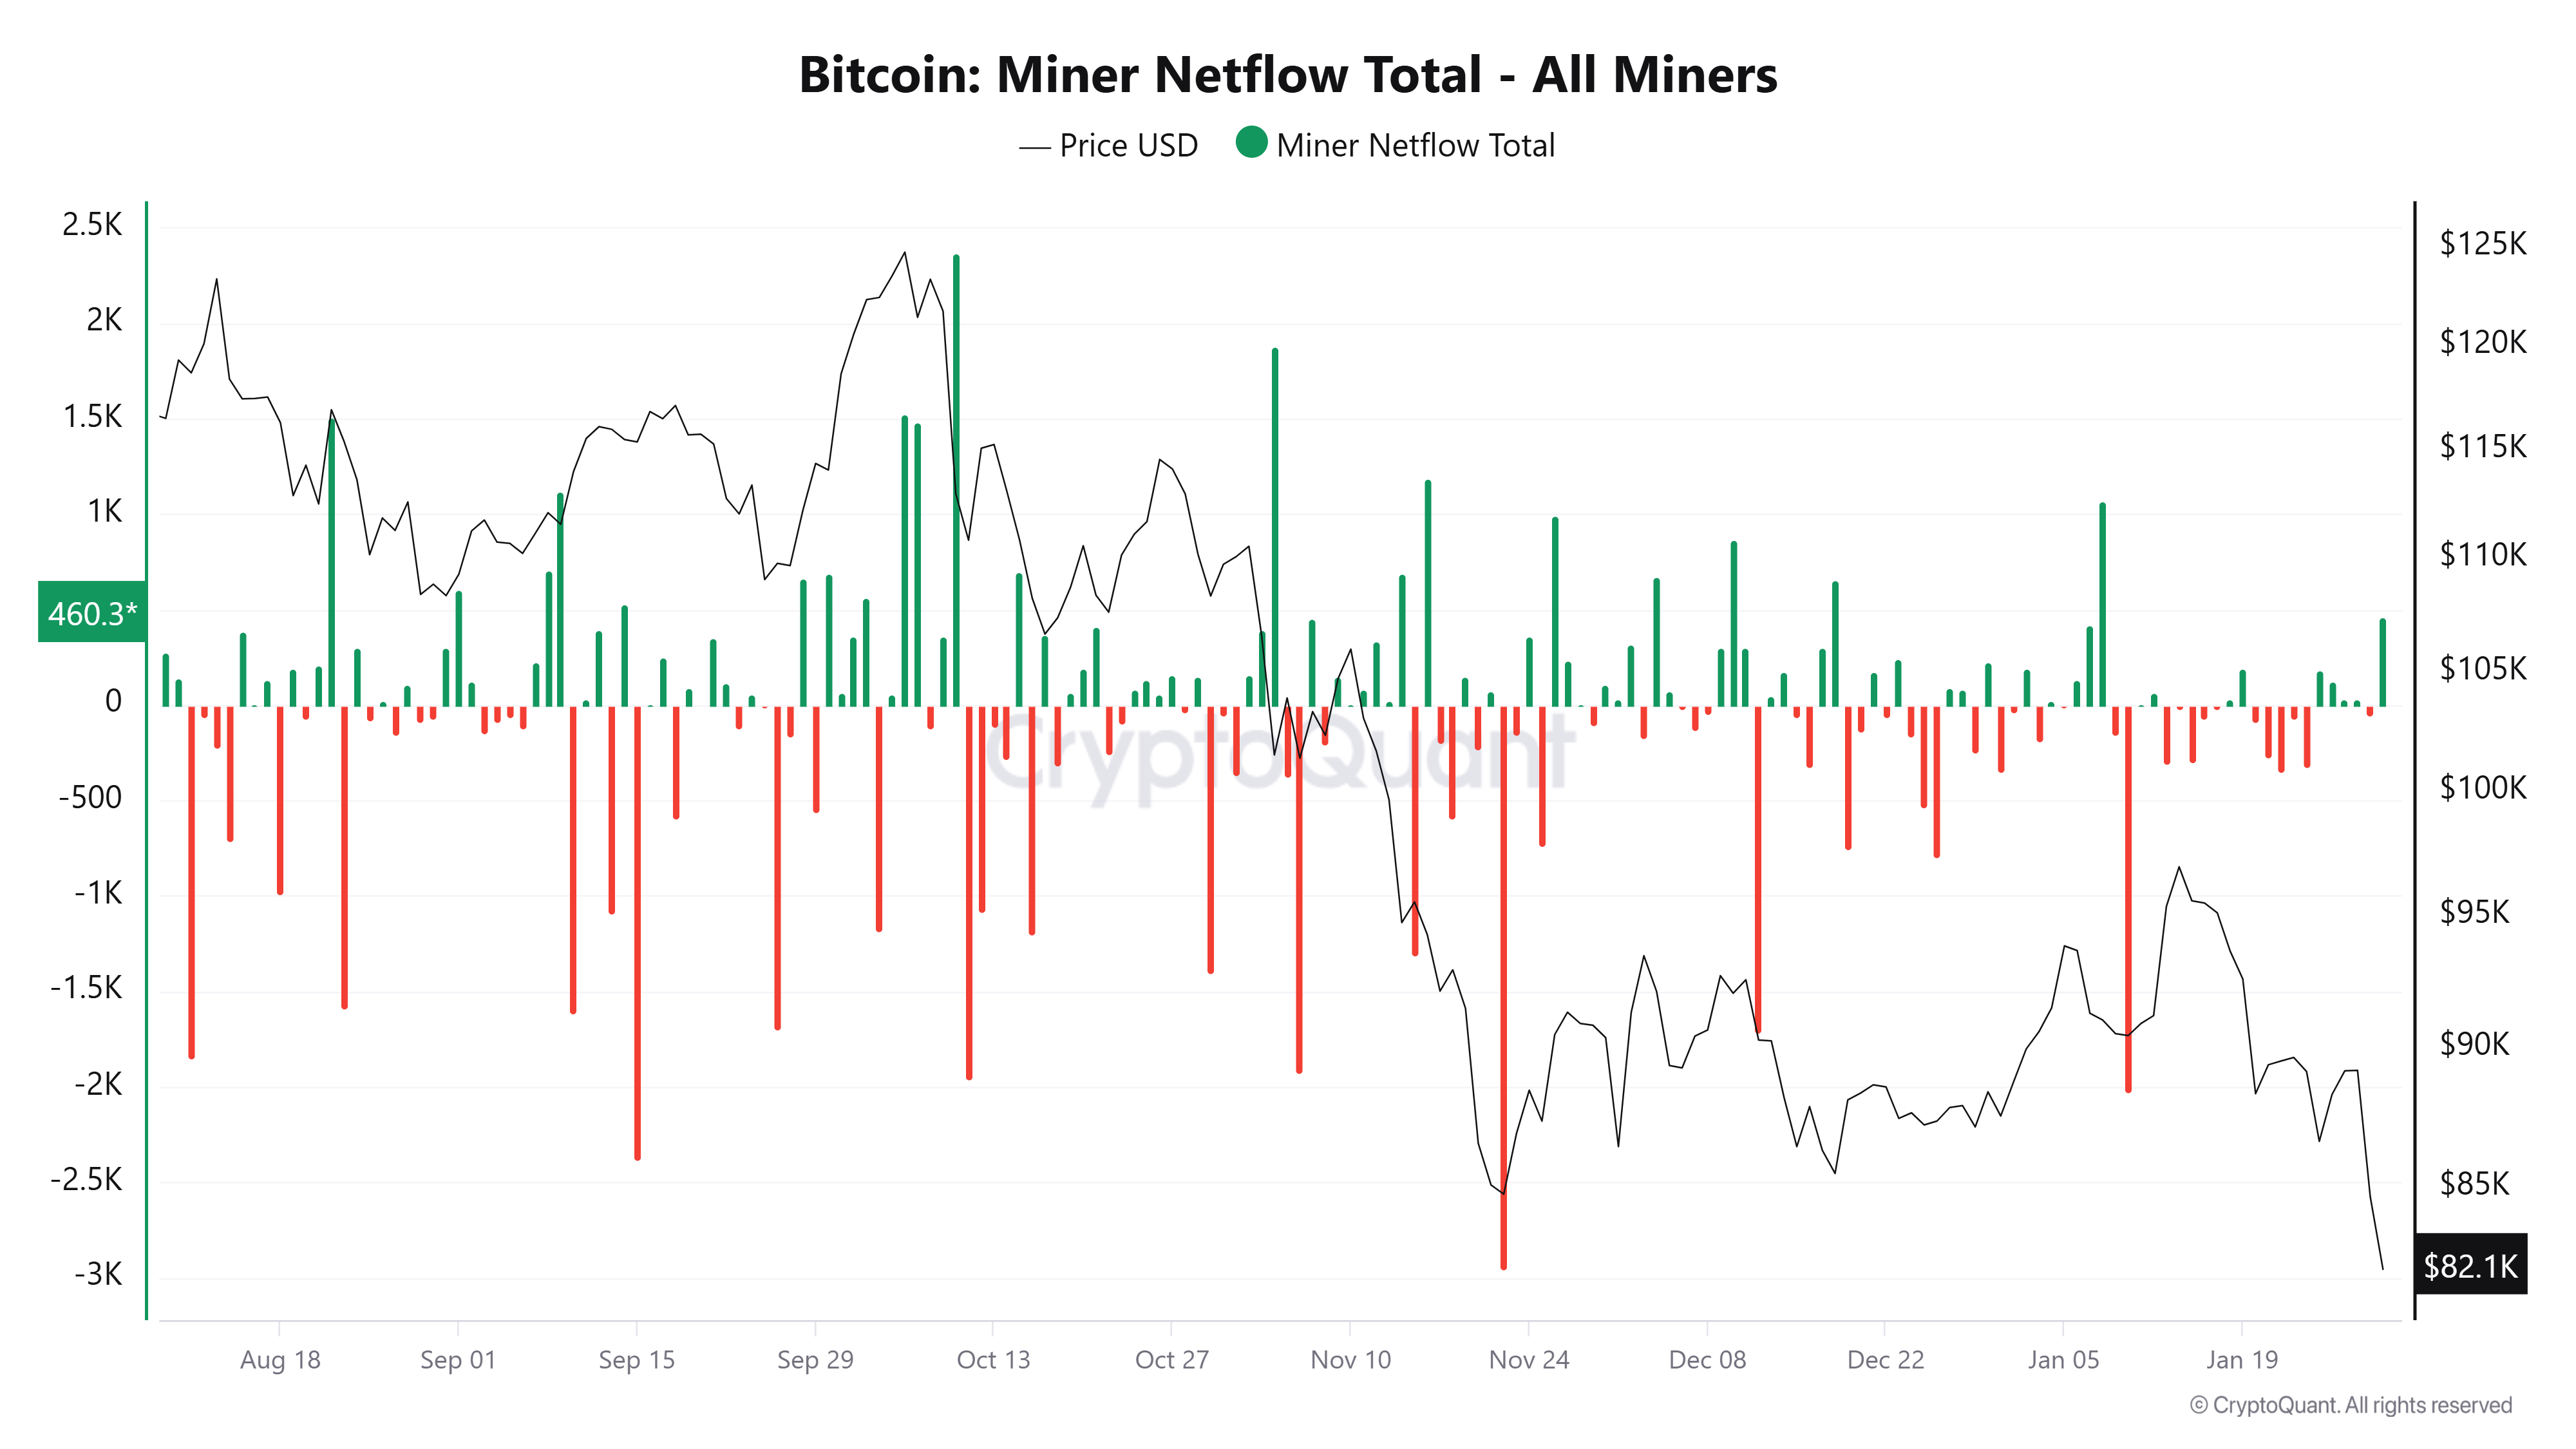
The Bitcoin Miner Netflow Total chart below shows a positive miners’ net flow on Friday, suggesting increased BTC transfers to exchanges and signaling potential selling pressure from miners. If these positive values continue and intensify, BTC could see further price corrections.
Some signs of optimism
The US Commodity Futures Trading Commission (CFTC) and the US Securities and Exchange Commission (SEC) held a joint event on Thursday to discuss harmonization on “Project Crypto”.
“Working together, the agencies are optimistic about what their teams can accomplish, and how collaboration can promote the long-term dynamism of U.S. markets,” posted the US SEC on X.
This ongoing initiative aims to modernize cryptocurrency regulation and could provide greater regulatory clarity for the digital asset industry in the long term.
Where is BTC heading?
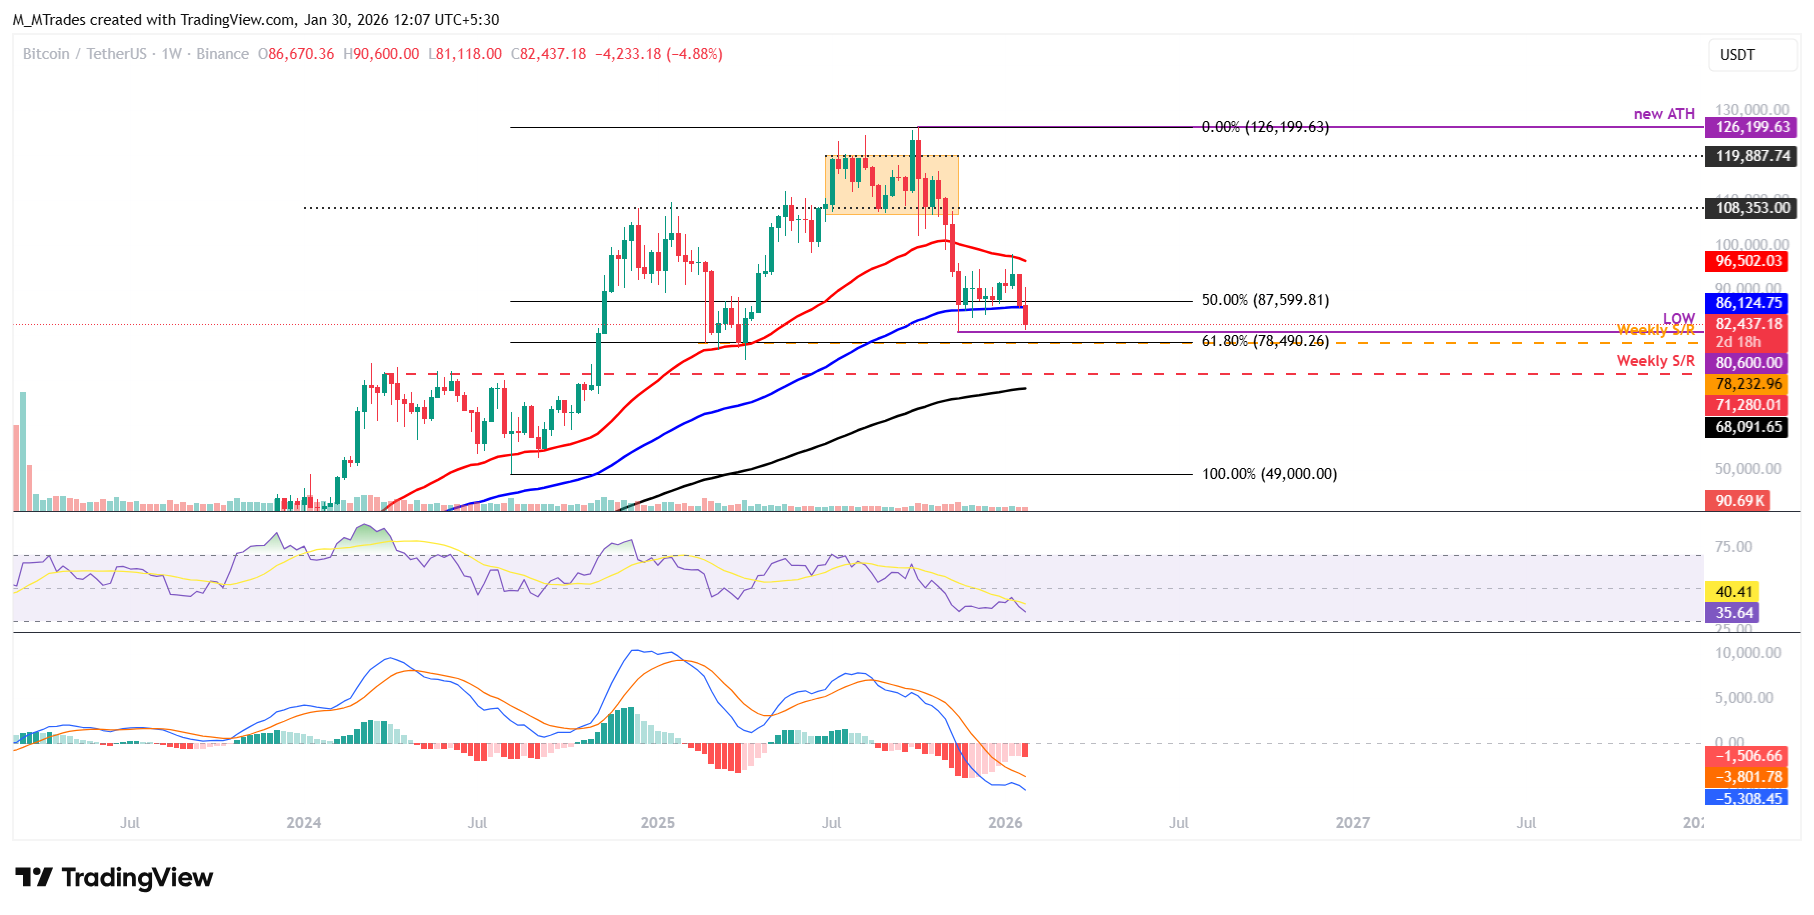
Bitcoin’s weekly chart shows the price retested the 50-week Exponential Moving Average (EMA) at $96,502 mid Januray and declined 7.48% last week. As of this week, BTC continued its correction, slipping below the 100-week EMA at $86,124 and reaching a low of $81,118 so far on Friday.
If BTC closes below the 100-week EMA at $86,124 on a weekly basis, it could extend the decline toward the November low of $80,600. A close below the latter could extend further losses toward the 61.8% Fibonacci retracement level (drawn from the August 2024 low of $49,000 to the October 2025 all-time high of $126,199) at $78,490.
The Relative Strength Index (RSI) on the weekly chart is 35, below the neutral level of 50, and pointing downward, indicating bearish momentum is building up. Moreover, the Moving Average Convergence Divergence (MACD) indicator on the same chart also showed a bearish crossover in mid-August, which remains intact, further supporting the negative outlook.
On the daily chart, BTC failed to close above the upper boundary of a horizontal pattern at $90,000 on Wednesday and corrected 5.21% the next day, closing below the lower consolidation boundary at $85,569. As of Friday, BTC is continuing its correction, trading near $82,500.
If BTC continues its downward trend, it could extend the decline toward the November low of $80,600. A decisive close below this level could extend the fall toward the April 7 low (2025 yearly lows) at $74,508.
The RSI on the daily chart reads 30, pointing downward toward its oversold territory, indicating strong bearish momentum. Moreover, the MACD indicator showed a bearish crossover on January 20, which remains intact with rising red histogram bars below the neutral level, further supporting the negative outlook.
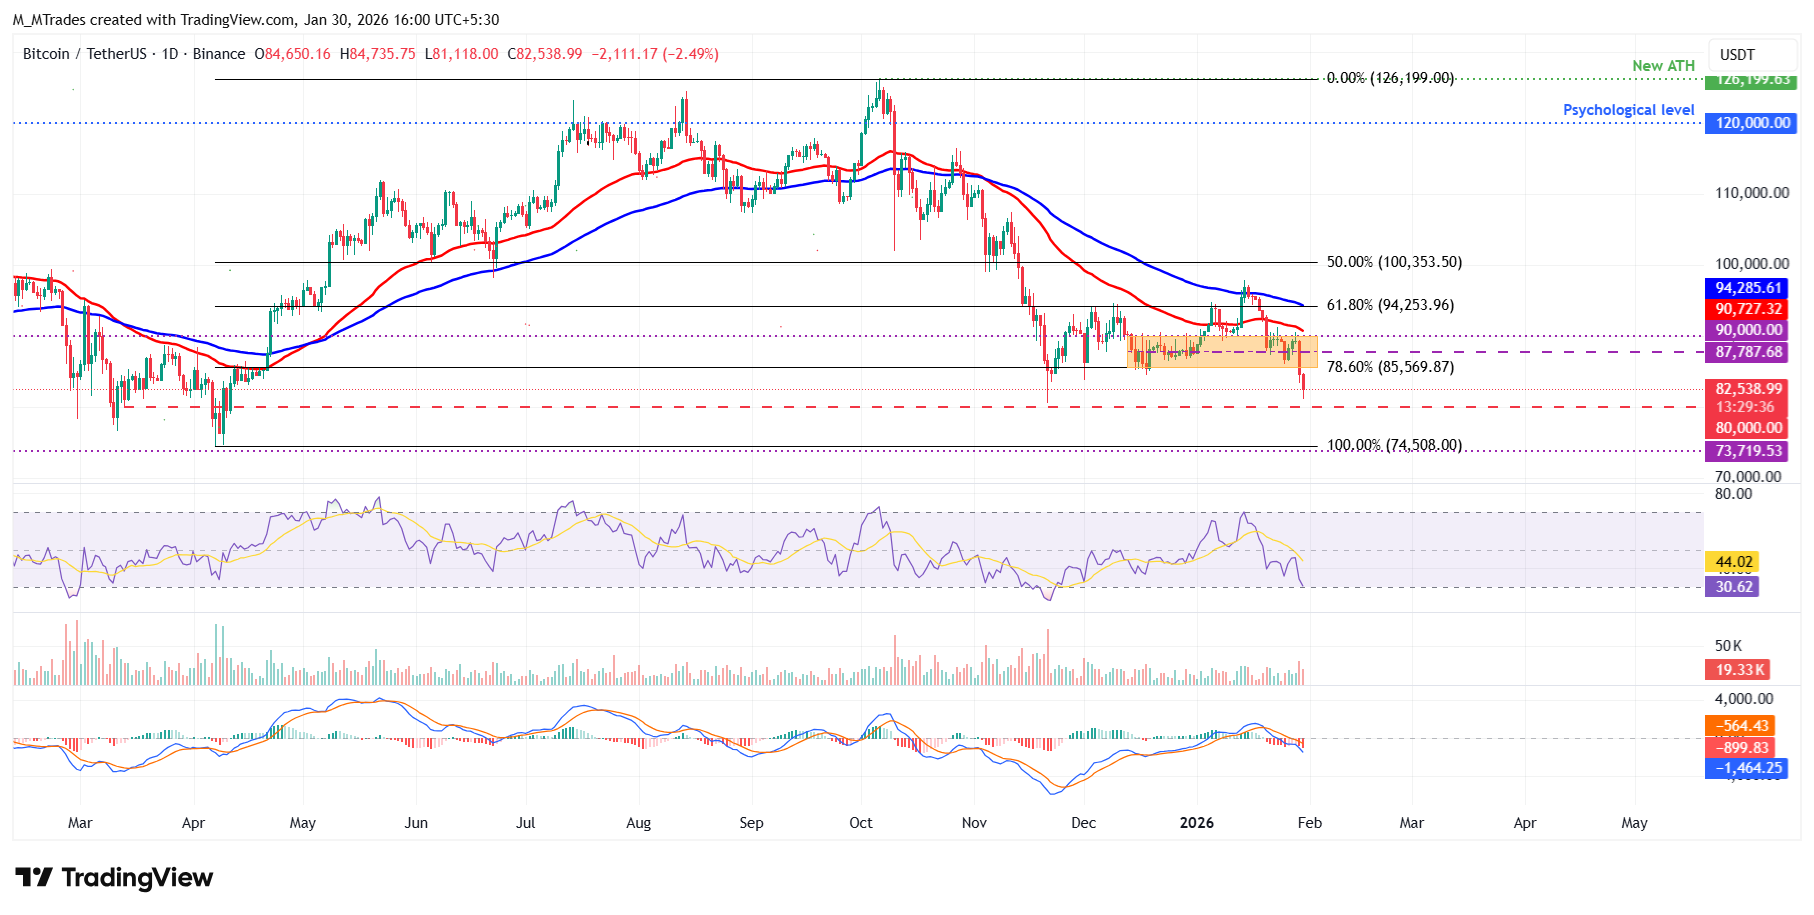
On the other hand, if BTC recovers, it could extend the advance toward the previously broken lower consolidation boundary at $85,569, which coincides with the 78.6% Fibonacci retracement (drawn from the April 7 low of $74,508 to the October 6 all-time high of $126,199).
Bitcoin, altcoins, stablecoins FAQs
Bitcoin is the largest cryptocurrency by market capitalization, a virtual currency designed to serve as money. This form of payment cannot be controlled by any one person, group, or entity, which eliminates the need for third-party participation during financial transactions.
Altcoins are any cryptocurrency apart from Bitcoin, but some also regard Ethereum as a non-altcoin because it is from these two cryptocurrencies that forking happens. If this is true, then Litecoin is the first altcoin, forked from the Bitcoin protocol and, therefore, an “improved” version of it.
Stablecoins are cryptocurrencies designed to have a stable price, with their value backed by a reserve of the asset it represents. To achieve this, the value of any one stablecoin is pegged to a commodity or financial instrument, such as the US Dollar (USD), with its supply regulated by an algorithm or demand. The main goal of stablecoins is to provide an on/off-ramp for investors willing to trade and invest in cryptocurrencies. Stablecoins also allow investors to store value since cryptocurrencies, in general, are subject to volatility.
Bitcoin dominance is the ratio of Bitcoin's market capitalization to the total market capitalization of all cryptocurrencies combined. It provides a clear picture of Bitcoin’s interest among investors. A high BTC dominance typically happens before and during a bull run, in which investors resort to investing in relatively stable and high market capitalization cryptocurrency like Bitcoin. A drop in BTC dominance usually means that investors are moving their capital and/or profits to altcoins in a quest for higher returns, which usually triggers an explosion of altcoin rallies.
Artigos Recomendados


