


Decentraland Price Forecast: MANA extends gains as open interest rises to a 3-month high
- Decentraland price extends gains on Friday, rallying over 13% so far this week.
- Open Interest surges to a 3-month high and daily active addresses and trading volume rising, suggesting further gains for MANA.
- Technical analysis suggests further gains as the bulls maintain momentum.
Decentraland (MANA) extends gains, trading at $0.173 at the time of writing on Friday after rallying more than 13% so far this week. On-chain and derivatives data back this rally as Open Interest (OI) hit a 3-month high alongside rising daily active addresses and trading volume. On the technical side, bulls are in control of the momentum, which could push MANA to higher levels.
Bullish derivatives and on-chain data
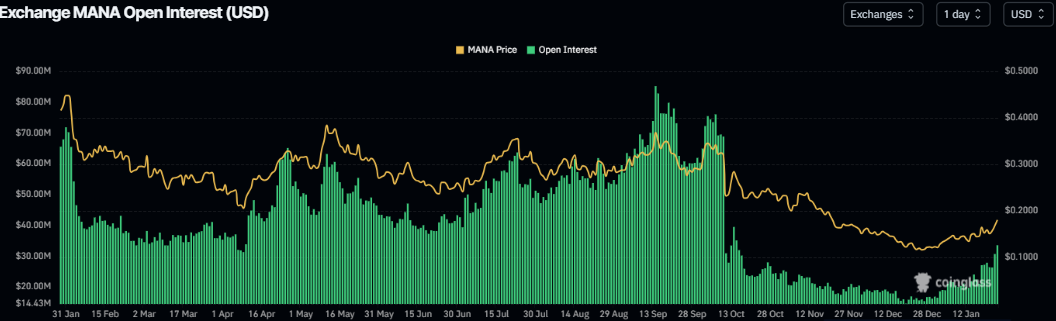
CoinGlass’ data show that the futures’ OI in Decentraland at exchanges reaches $33.49 million on Friday, up from $20.99 million last Saturday, levels not seen since October 16. An increasing OI represents new or additional money entering the market and new buying, which could fuel the current MANA price rally.
Santiment’s Daily Active Addresses index, which tracks network activity over time, paints a bullish picture for Decentraland. A rise in the metric signals greater blockchain usage, while declining addresses point to lower demand for the network.
In MANA’s case, Daily Active Addresses rise to 1,196 on Friday, the highest level since December 22, 2024, from 562 on Monday. This indicates that demand for Decentraland usage is increasing, which bodes well for MANA price.
 [12-1769154354651-1769154354653.40.10, 23 Jan, 2026].png)
Santiment data indicate that the MANA ecosystem’s trading volume (the aggregate trading volume generated by all exchange applications on the chain) reached $124.77 million on Sunday, the highest since October 11, and has since steadied around $90.60 million on Friday. This volume rise indicates a surge in traders’ interest and liquidity in Decentraland, boosting its bullish outlook.
 [12-1769154375974-1769154375976.45.09, 23 Jan, 2026].png)
Decentraland Price Forecast: MANA bulls in control of the momentum
Decentraland price closed above the 50-day Exponential Moving Average (EMA) at $0.152 on Saturday, but faced rejection from the 100-day EMA at $0.176 the next day. During this week, MANA have been trading between the two averages. As of writing on Friday, MANA is testing the 100-day EMA at $0.176.
If MANA closes above the 100-day EMA at $0.176 on a daily basis, it could extend the rally to the 200-day EMA at $0.218, which coincides with the 50% Fibonacci retracement from the September 13 high at $0.391 to the October 10 low of $0.046.
The Relative Strength Index (RSI) on the daily chart reads 65, above the neutral level of 50, indicating strong bullish momentum. In addition, the Moving Average Convergence Divergence (MACD) showed a bullish crossover at the end of December, which remains in effect, with green histogram bars above the neutral level, further supporting the positive view.
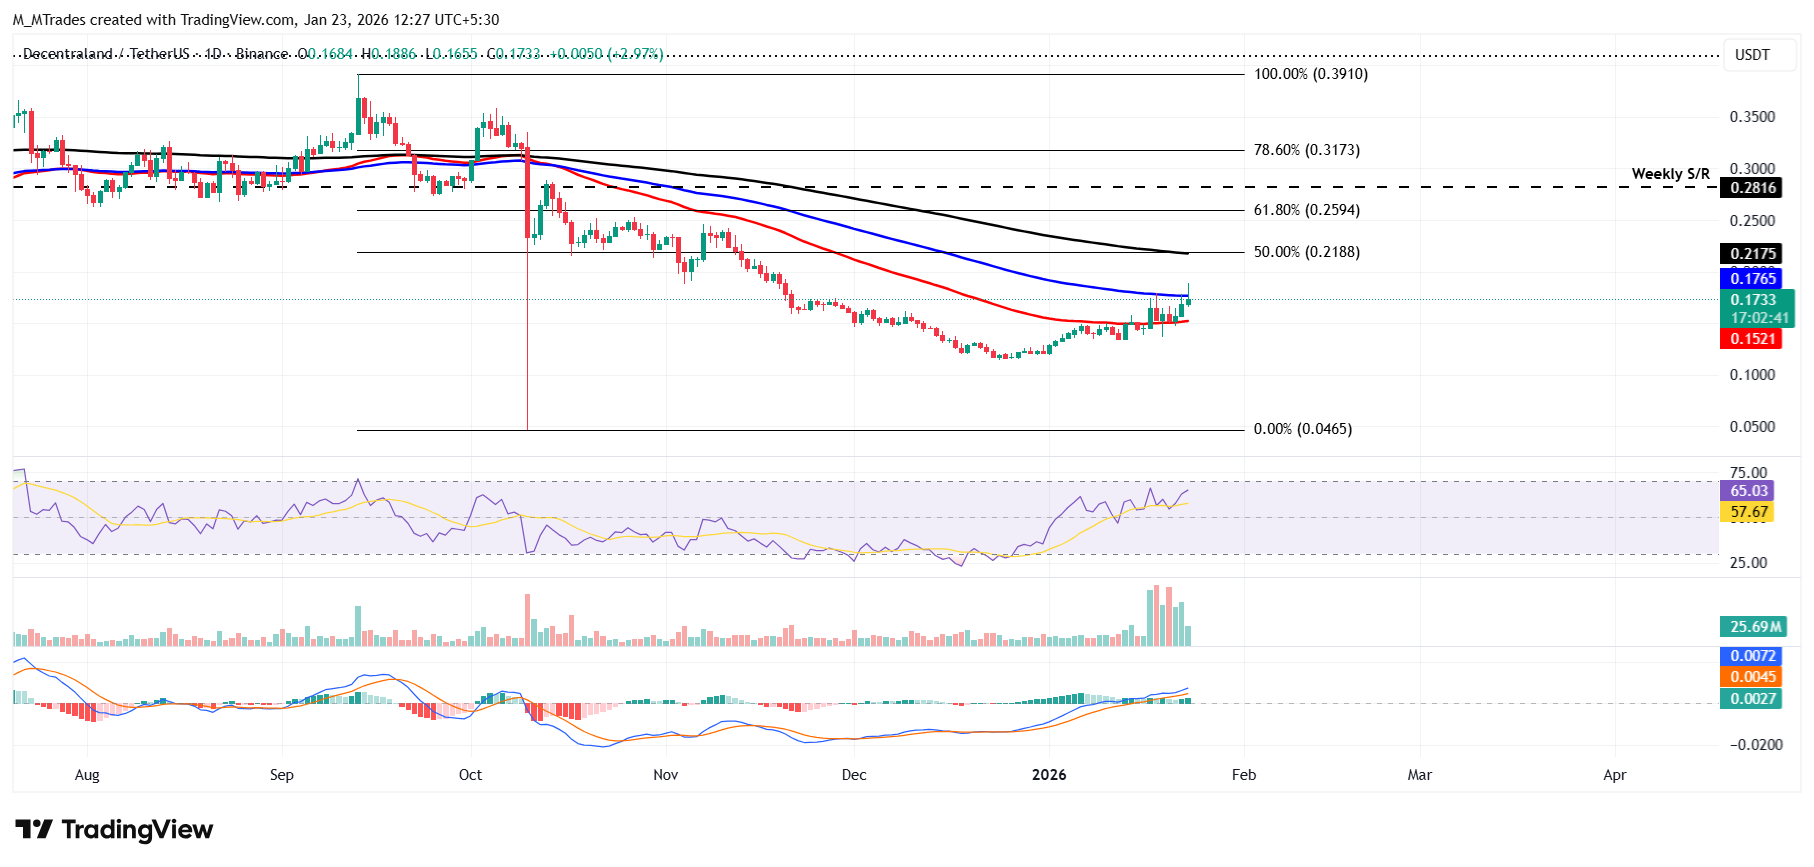
However, if MANA faces a correction, it could extend the decline toward the 50-day EMA at $0.152.
Artigos Recomendados


