Monero Price Forecast: XMR risks deeper correction as rally fatigues at $800 record high

Fonte Fxstreet
  • Monero edges lower by over 1% on Thursday, after reaching an all-time high of $800 on the previous day.
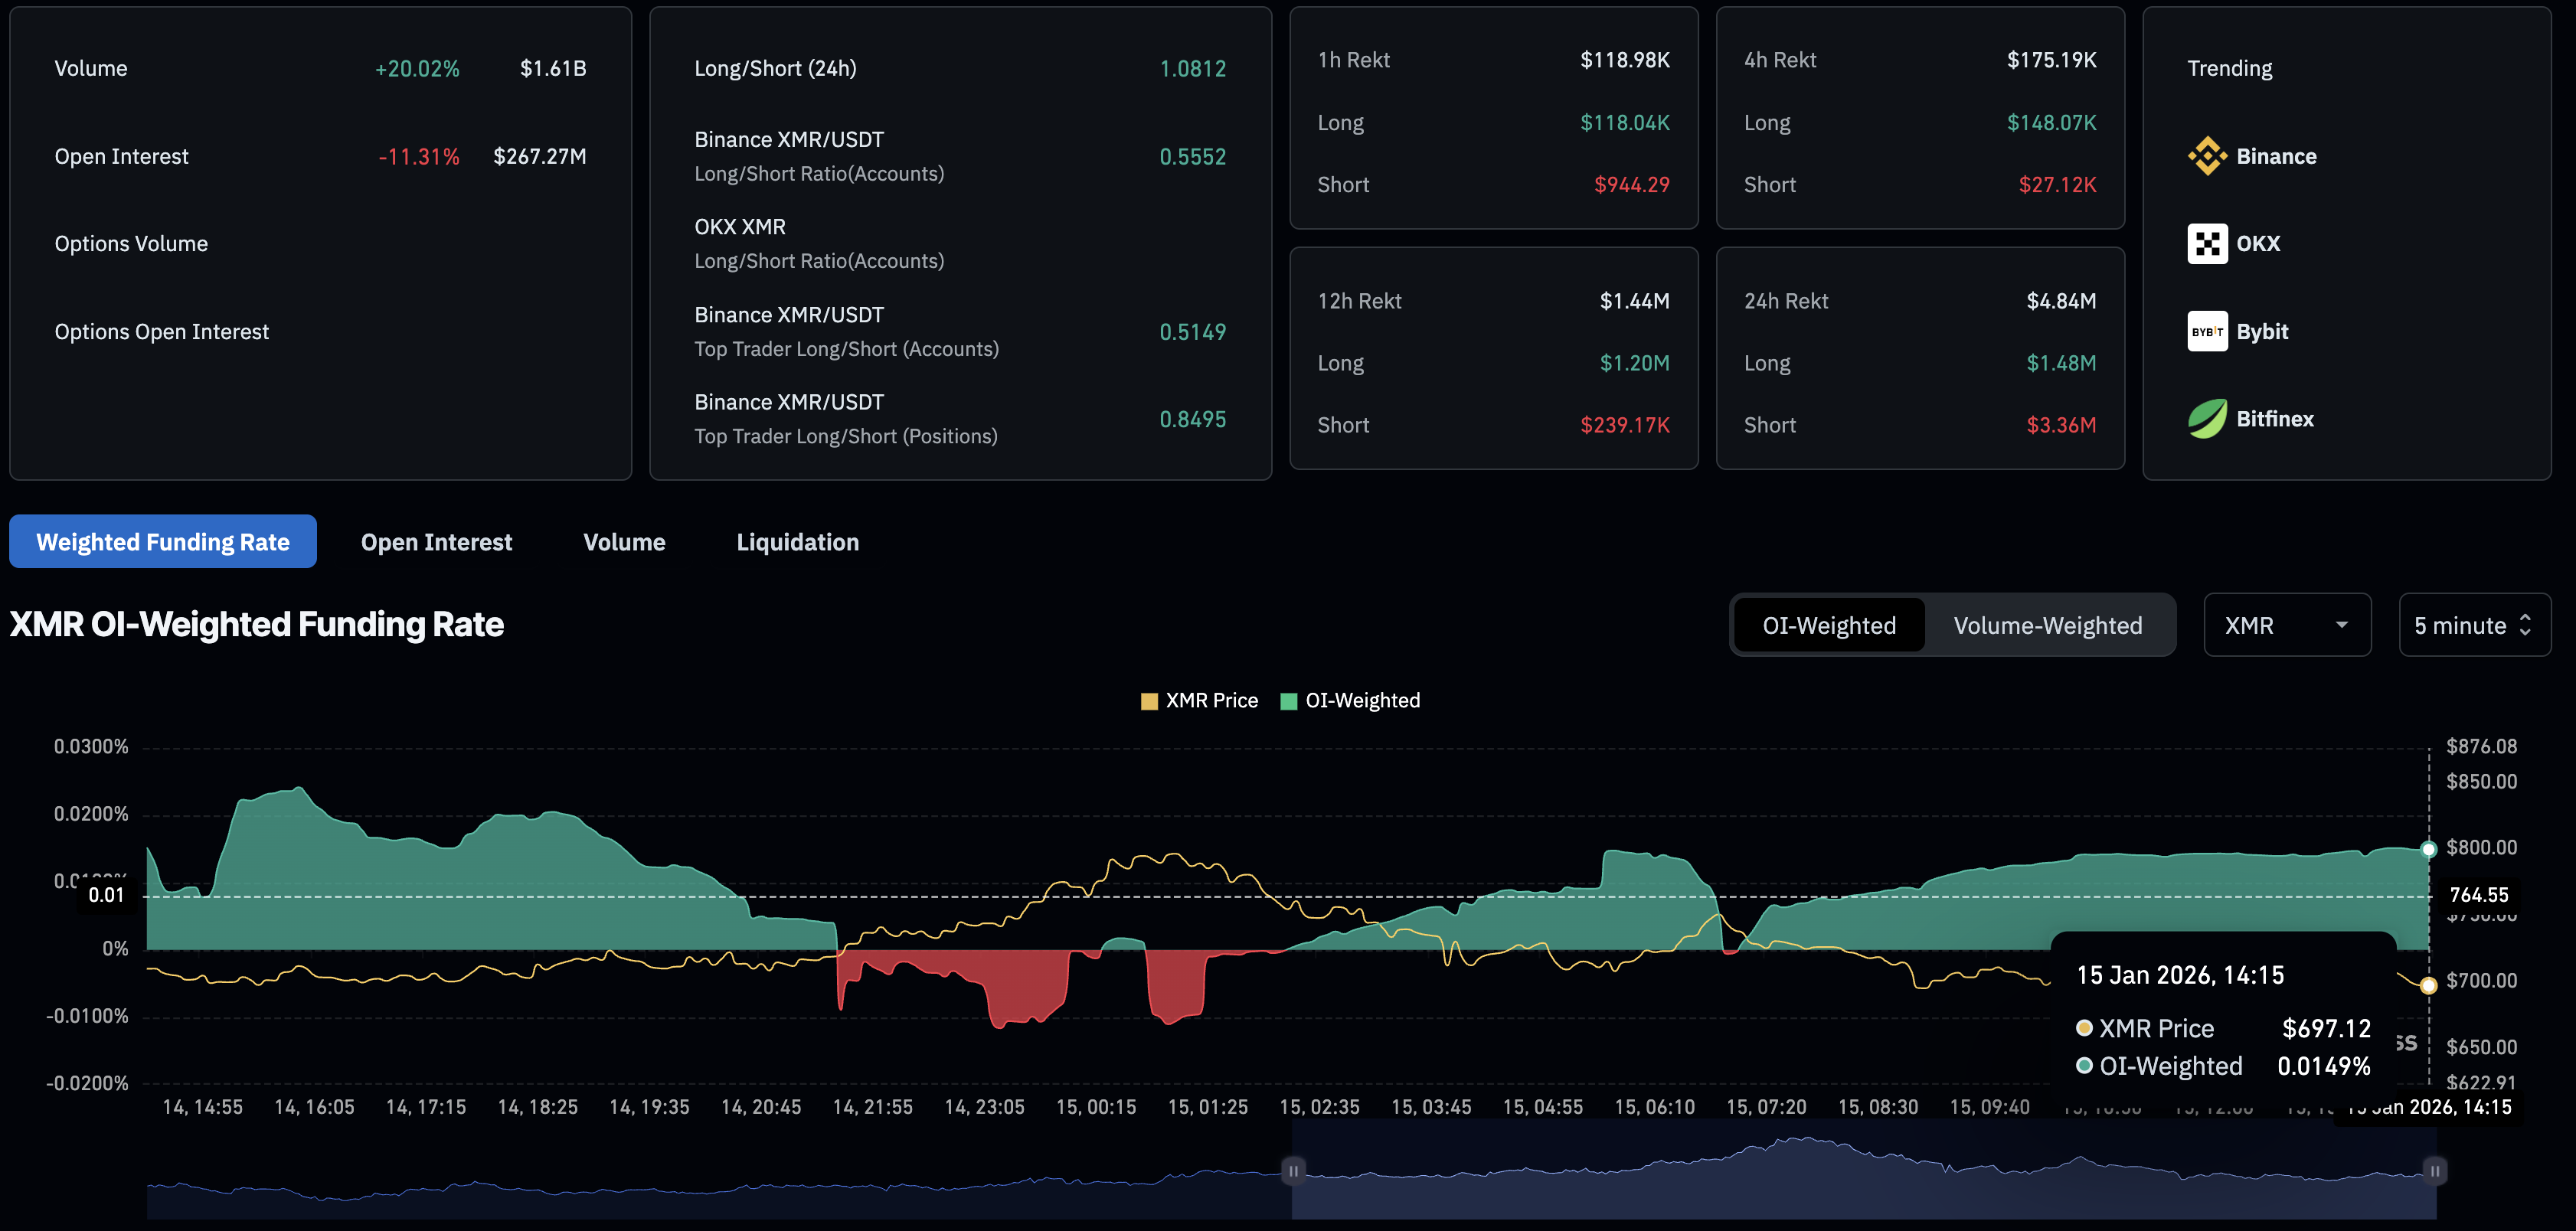
  • A sudden decline in XMR futures Open Interest at record high levels suggests market sentiment is cooling.
  • The technical outlook suggests profit-taking could send Monero to the $640 support.

Monero (XMR) edges lower on Thursday, holding around $700 at the time of writing as the rally cools off after reaching a record high of $800 on the previous day, signaling a potential cycle top. Derivatives data suggest a risk-off shift among traders that could affect the spot market demand. Technically, Monero now flashes downside risk toward $640 as holders lock in profit.

XMR derivatives flash weakening retail sentiment

Monero carries a bullish bias as the privacy coins narrative has dominated the cryptocurrency market over the past two months. However, the recent pullback in XMR aligns with a delay in the CLARITY bill, flashing market-wide bearish caution. 

CoinGlass data shows an over 11% decline in XMR Open Interest (OI) in the last 24 hours to $267.27 million – a drop in the notional value of all active positions – indicating reduced demand for Monero derivatives as traders reduce leverage or close positions. 

The 24-hour liquidation data show short liquidations of $3.36 million, nearly three times the $1.48 million in long liquidations. However, over the last 12 hours, long liquidations totaling $1.20 million, roughly five times the $239,170 in short liquidations, suggest a shift toward a sell-side bias. 

Still, bullish interest in the privacy coin persists, as the OI-weighted funding rate remains steady at 0.0149%, risking a further boost in long liquidations.

XMR derivatives data. Source: CoinGlass

Upcycle fatigue cramps the Monero bull run

Monero edges lower by over 1% at the time of writing on Thursday, breaking the last seven days of uptrend. The privacy coin trades near $700, struggling below the R4 Pivot Point at $711, with long-wick candles on the daily logarithmic chart.

If XMR closes the day in the red, a short-term bearish bias points to the R3 Pivot Point at $640 as the immediate target. 

Still, technical indicators on the daily timeframe largely back the prevailing bullish cycle. The 20-day EMA at $527 rises above the 50-day at $463 and the 200-day at $366, reinforcing a bullish alignment. As long as XMR holds well above these averages, which serve as dynamic supports, it would keep a near-term bias toward higher prices.  

Additionally, the Moving Average Convergence Divergence (MACD) indicator extends above the signal line on the daily chart, with both lines holding in positive territory. A widening positive histogram suggests strengthening bullish momentum. 

Meanwhile, the Relative Strength Index (RSI) at 83 is overbought, which could cap near-term gains and prompt consolidation.


XMR/USDT daily logarithmic chart.

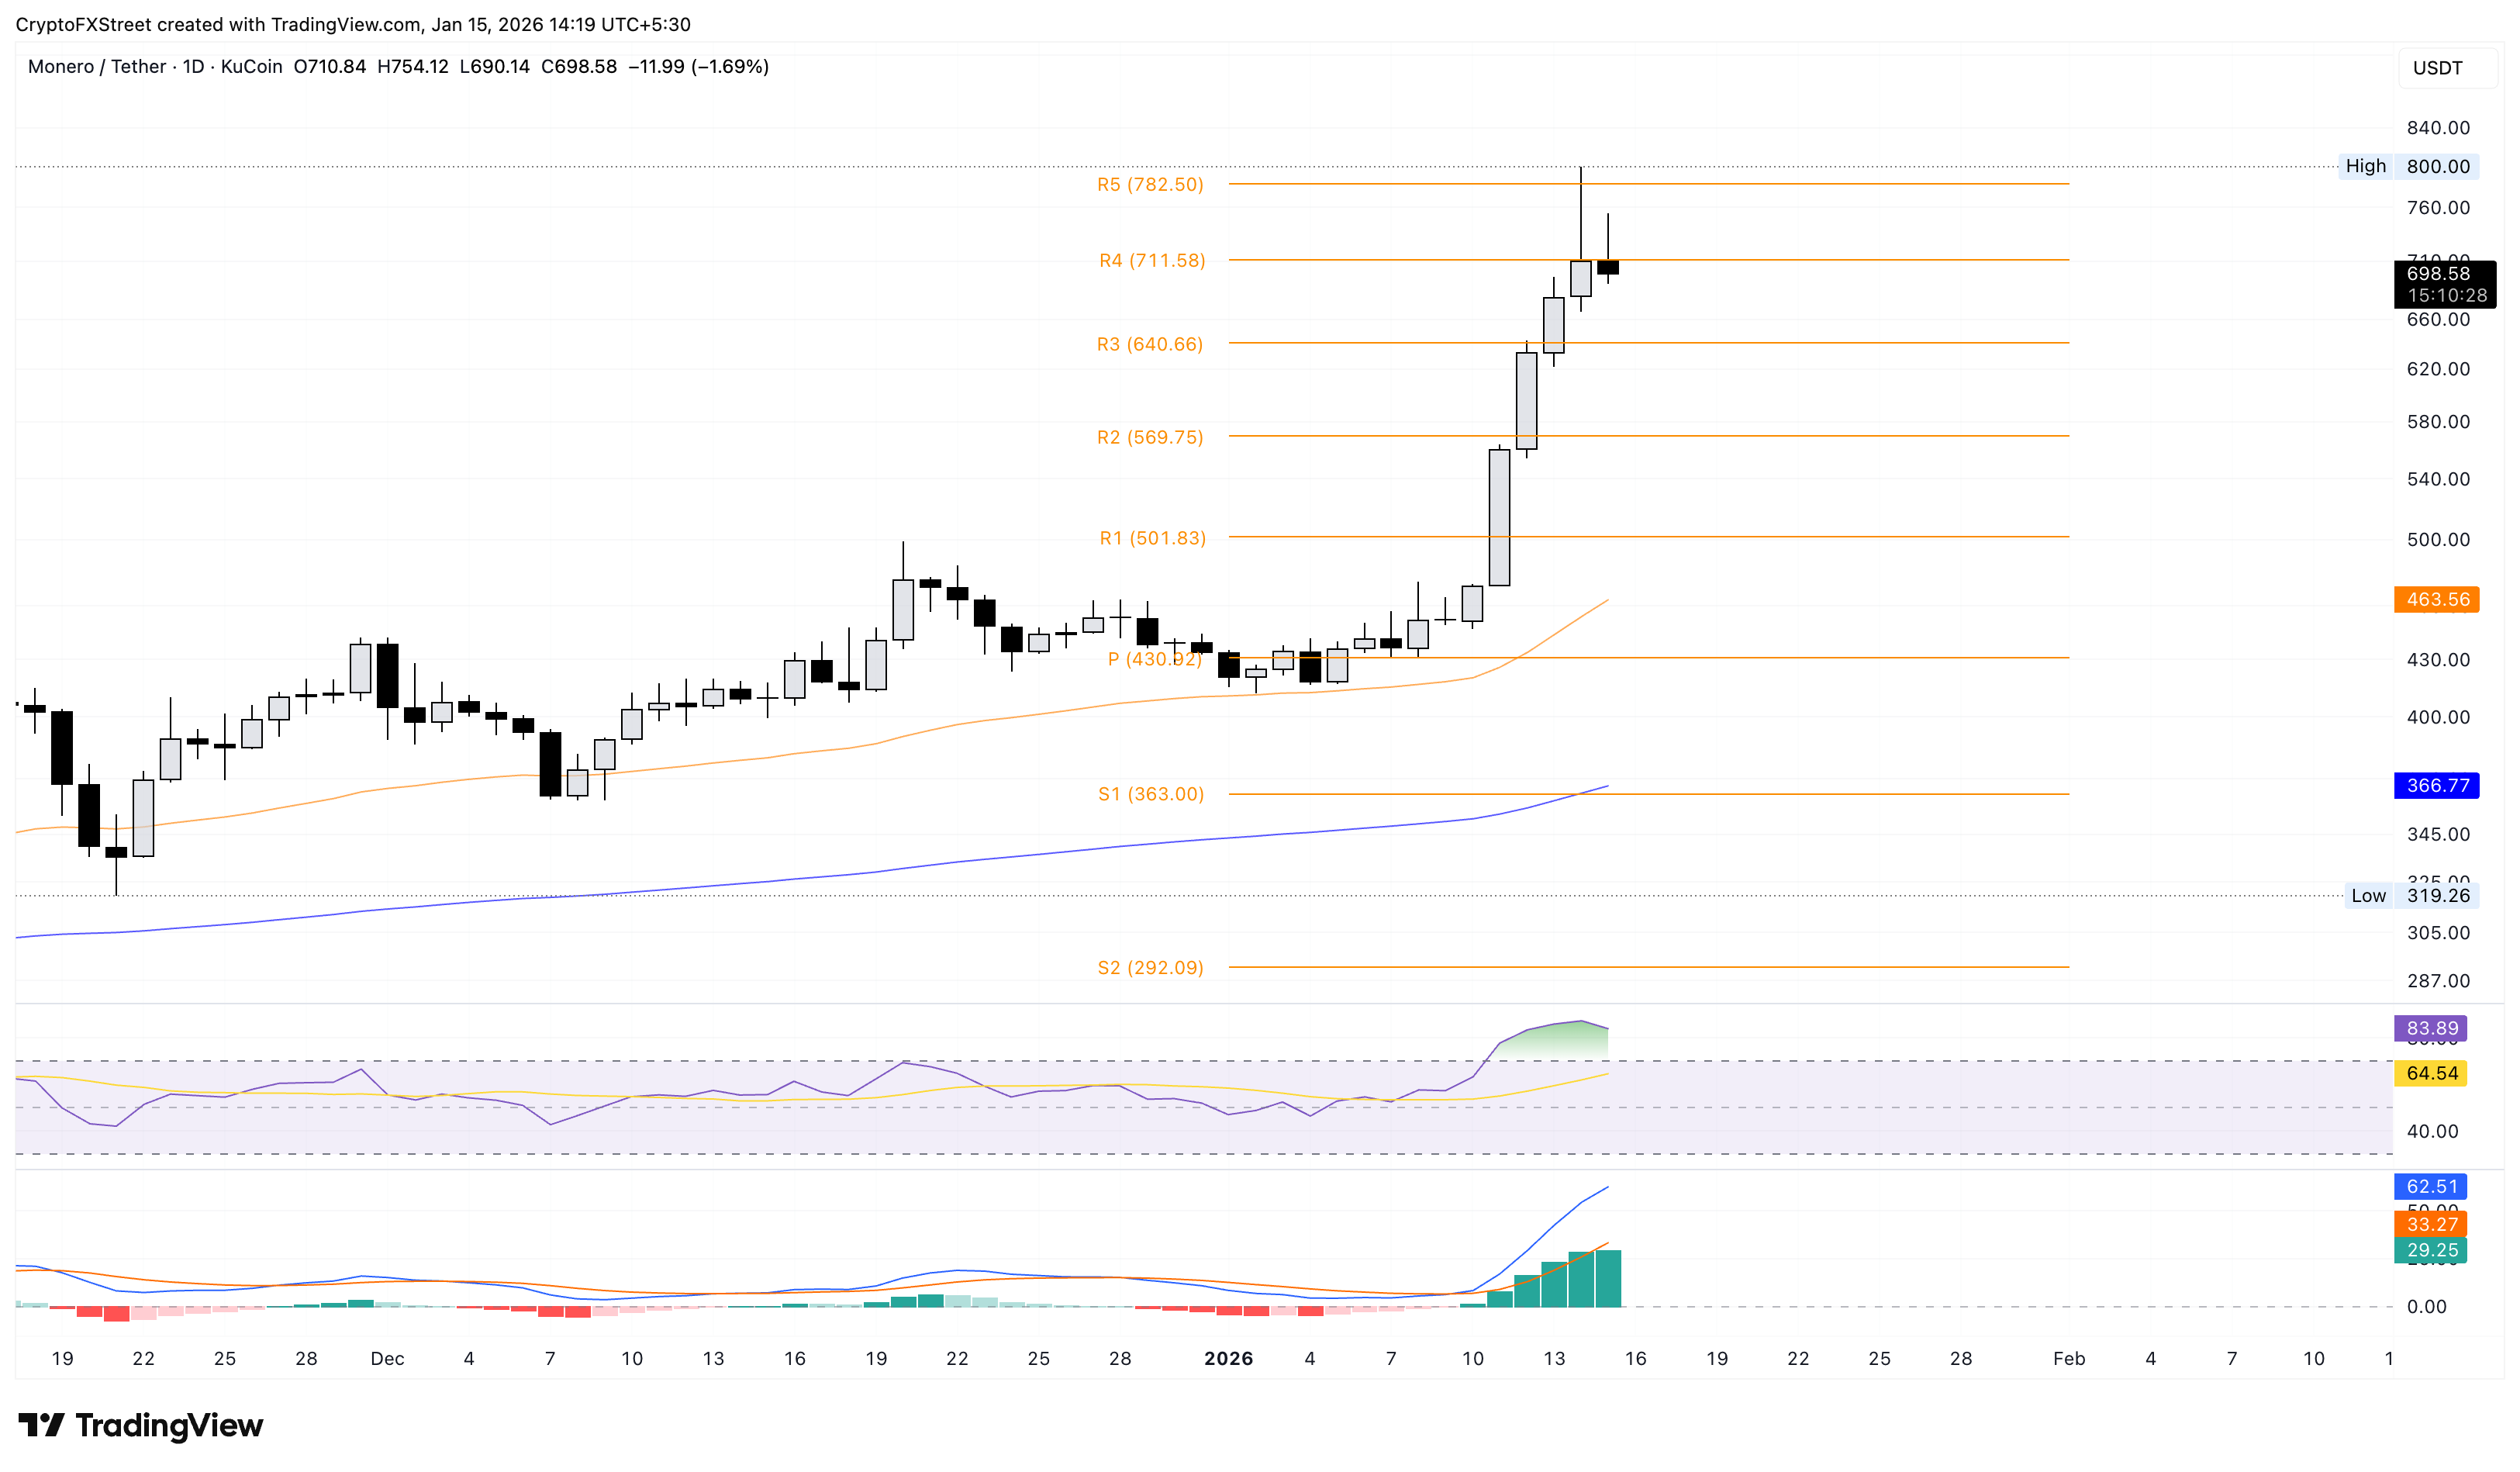
Looking up, a potential closing above $711 could boost the XMR rally back to $800. 

(The technical analysis of this story was written with the help of an AI tool.)

Isenção de responsabilidade: Apenas para fins informativos. O desempenho passado não é indicativo de resultados futuros.
placeholder
Mercados em 2026: Ouro, Bitcoin e o Dólar voltarão a fazer história? — Veja o que pensam as principais instituiçõesApós um ano turbulento, o que esperar dos mercados de commodities, forex e criptomoedas em 2026?
Autor  Mitrade Team
25 dez. 2025
Após um ano turbulento, o que esperar dos mercados de commodities, forex e criptomoedas em 2026?
placeholder
Bitcoin oscila nos US$ 90 mil sob expectativa de decisão sobre tarifas comerciais nos Estados UnidosO Bitcoin (BTC) iniciou a sessão desta sexta-feira gravitando em torno da marca psicológica dos US$ 90.000, enquanto os investidores se preparam para anúncios cruciais vindos de Washington. O mercado de criptoativos opera em um estado de cautela extrema, refletindo a ansiedade global sobre as novas políticas comerciais norte-americanas.
Autor  Pedro Augusto Prazeres
1 Mês 12 Dia Seg
O Bitcoin (BTC) iniciou a sessão desta sexta-feira gravitando em torno da marca psicológica dos US$ 90.000, enquanto os investidores se preparam para anúncios cruciais vindos de Washington. O mercado de criptoativos opera em um estado de cautela extrema, refletindo a ansiedade global sobre as novas políticas comerciais norte-americanas.
placeholder
Bitcoin atinge máxima de US$ 95,4 mil; adiamento da Lei Clarity sinaliza resiliência do mercadoO Bitcoin atingiu uma nova máxima semanal de 95.472 dólares nesta terça-feira, 13 de janeiro de 2026. O movimento de alta ocorreu em um momento de calmaria institucional, enquanto legisladores norte-americanos adiavam as discussões sobre a Lei Clarity.
Autor  Pedro Augusto Prazeres
Ontem 02: 23
O Bitcoin atingiu uma nova máxima semanal de 95.472 dólares nesta terça-feira, 13 de janeiro de 2026. O movimento de alta ocorreu em um momento de calmaria institucional, enquanto legisladores norte-americanos adiavam as discussões sobre a Lei Clarity.
placeholder
Ibovespa renova máxima histórica em meio a tensões diplomáticas e descolamento do dólarO Ibovespa encerrou a sessão desta quarta-feira em patamar inédito, registrando uma valorização de 1,96% aos 165.145,98 pontos. O ganho de mais de 3 mil pontos reflete um ajuste de expectativas do mercado frente ao cenário político local e à força das commodities.
Autor  Pedro Augusto Prazeres
11 horas atrás
O Ibovespa encerrou a sessão desta quarta-feira em patamar inédito, registrando uma valorização de 1,96% aos 165.145,98 pontos. O ganho de mais de 3 mil pontos reflete um ajuste de expectativas do mercado frente ao cenário político local e à força das commodities.
placeholder
Ethereum rompe padrão técnico e sinaliza retomada rumo aos US$ 4 milO Ethereum demonstra uma recuperação vigorosa nas últimas jornadas, registrando uma valorização próxima de 7% em um intervalo de apenas 24 horas. Esse movimento consolidou uma estrutura de alta no gráfico de 12 horas, indicando que o mercado encontrou um suporte sólido para testar patamares superiores.
Autor  Pedro Augusto Prazeres
11 horas atrás
O Ethereum demonstra uma recuperação vigorosa nas últimas jornadas, registrando uma valorização próxima de 7% em um intervalo de apenas 24 horas. Esse movimento consolidou uma estrutura de alta no gráfico de 12 horas, indicando que o mercado encontrou um suporte sólido para testar patamares superiores.
goTop
quote