

Ethereum Price Forecast: ETH investor caution persists despite exchange supply shrinking to May levels
- Ethereum fails to break above the 200-day EMA amid short-term bearish market dynamics.
- The balance of Ethereum on Binance exchange falls to its lowest level since May, hinting at a potential bullish turnaround.
- Ethereum derivatives market has been muted since mid-October as risk-off sentiment persists among retail investors.
Ethereum (ETH) falls for the second consecutive day, trading below $3,500 at the time of writing on Tuesday as bearish waves trigger a cascade of losses in the broader cryptocurrency market.
The largest smart contracts token failed to sustain recovery toward $3,700 on Monday primarily due to potential profit-taking, risk-off sentiment, and sticky macroeconomic uncertainty.
Institutional demand for Ethereum Exchange Traded Funds (ETFs) is also on the back foot. As reported, all nine US-listed ETFs recorded zero inflows on Monday, emphasising the prevailing risk-off sentiment.
Ethereum supply on exchanges narrows
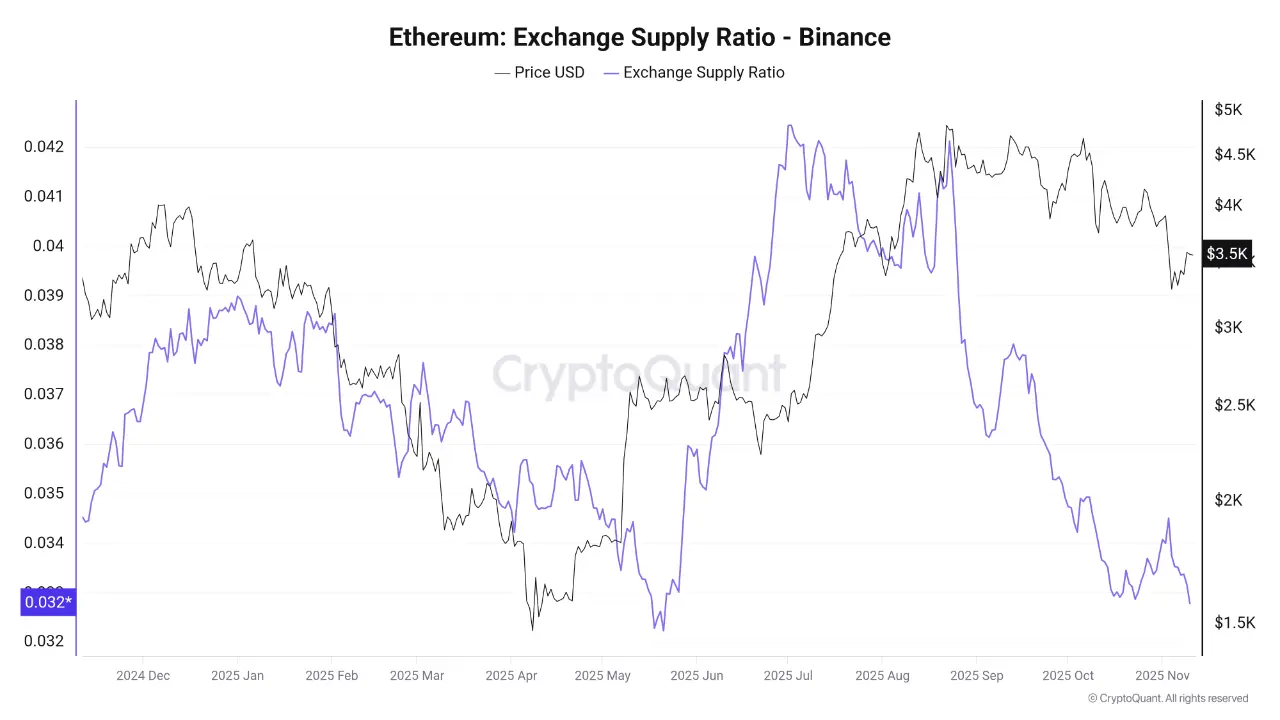
The balance of Ethereum on Binance, the largest crypto trading platform by volume, has been steadily declining since peaking in June and July, according to CryptoQuant. According to the chart below, the ETH supply ratio remains at 0.0327, the lowest level since May.
"This continuous decrease in the available Ethereum supply on exchanges typically indicates a movement of coins into cold or private wallets — a behavior considered bullish in the medium to long term, as a reduction in the supply available for sale alleviates market pressure," Arab Chain stated via CryptoQuant.
If the decline in supply persists, it could lead to a liquidity crunch for Ethereum available on the open market. This imbalance could trigger an upswing in Ethereum's price, bolstered by improving risk appetite among retail investors.
Still, investors should be cautiously optimistic, as the exchange supply crunch may have little effect on the price in the near term. Ethereum may enter into choppy sideways action or even decline in the short term. Navigating this transition phase is critical for both short-term and long-term investors.
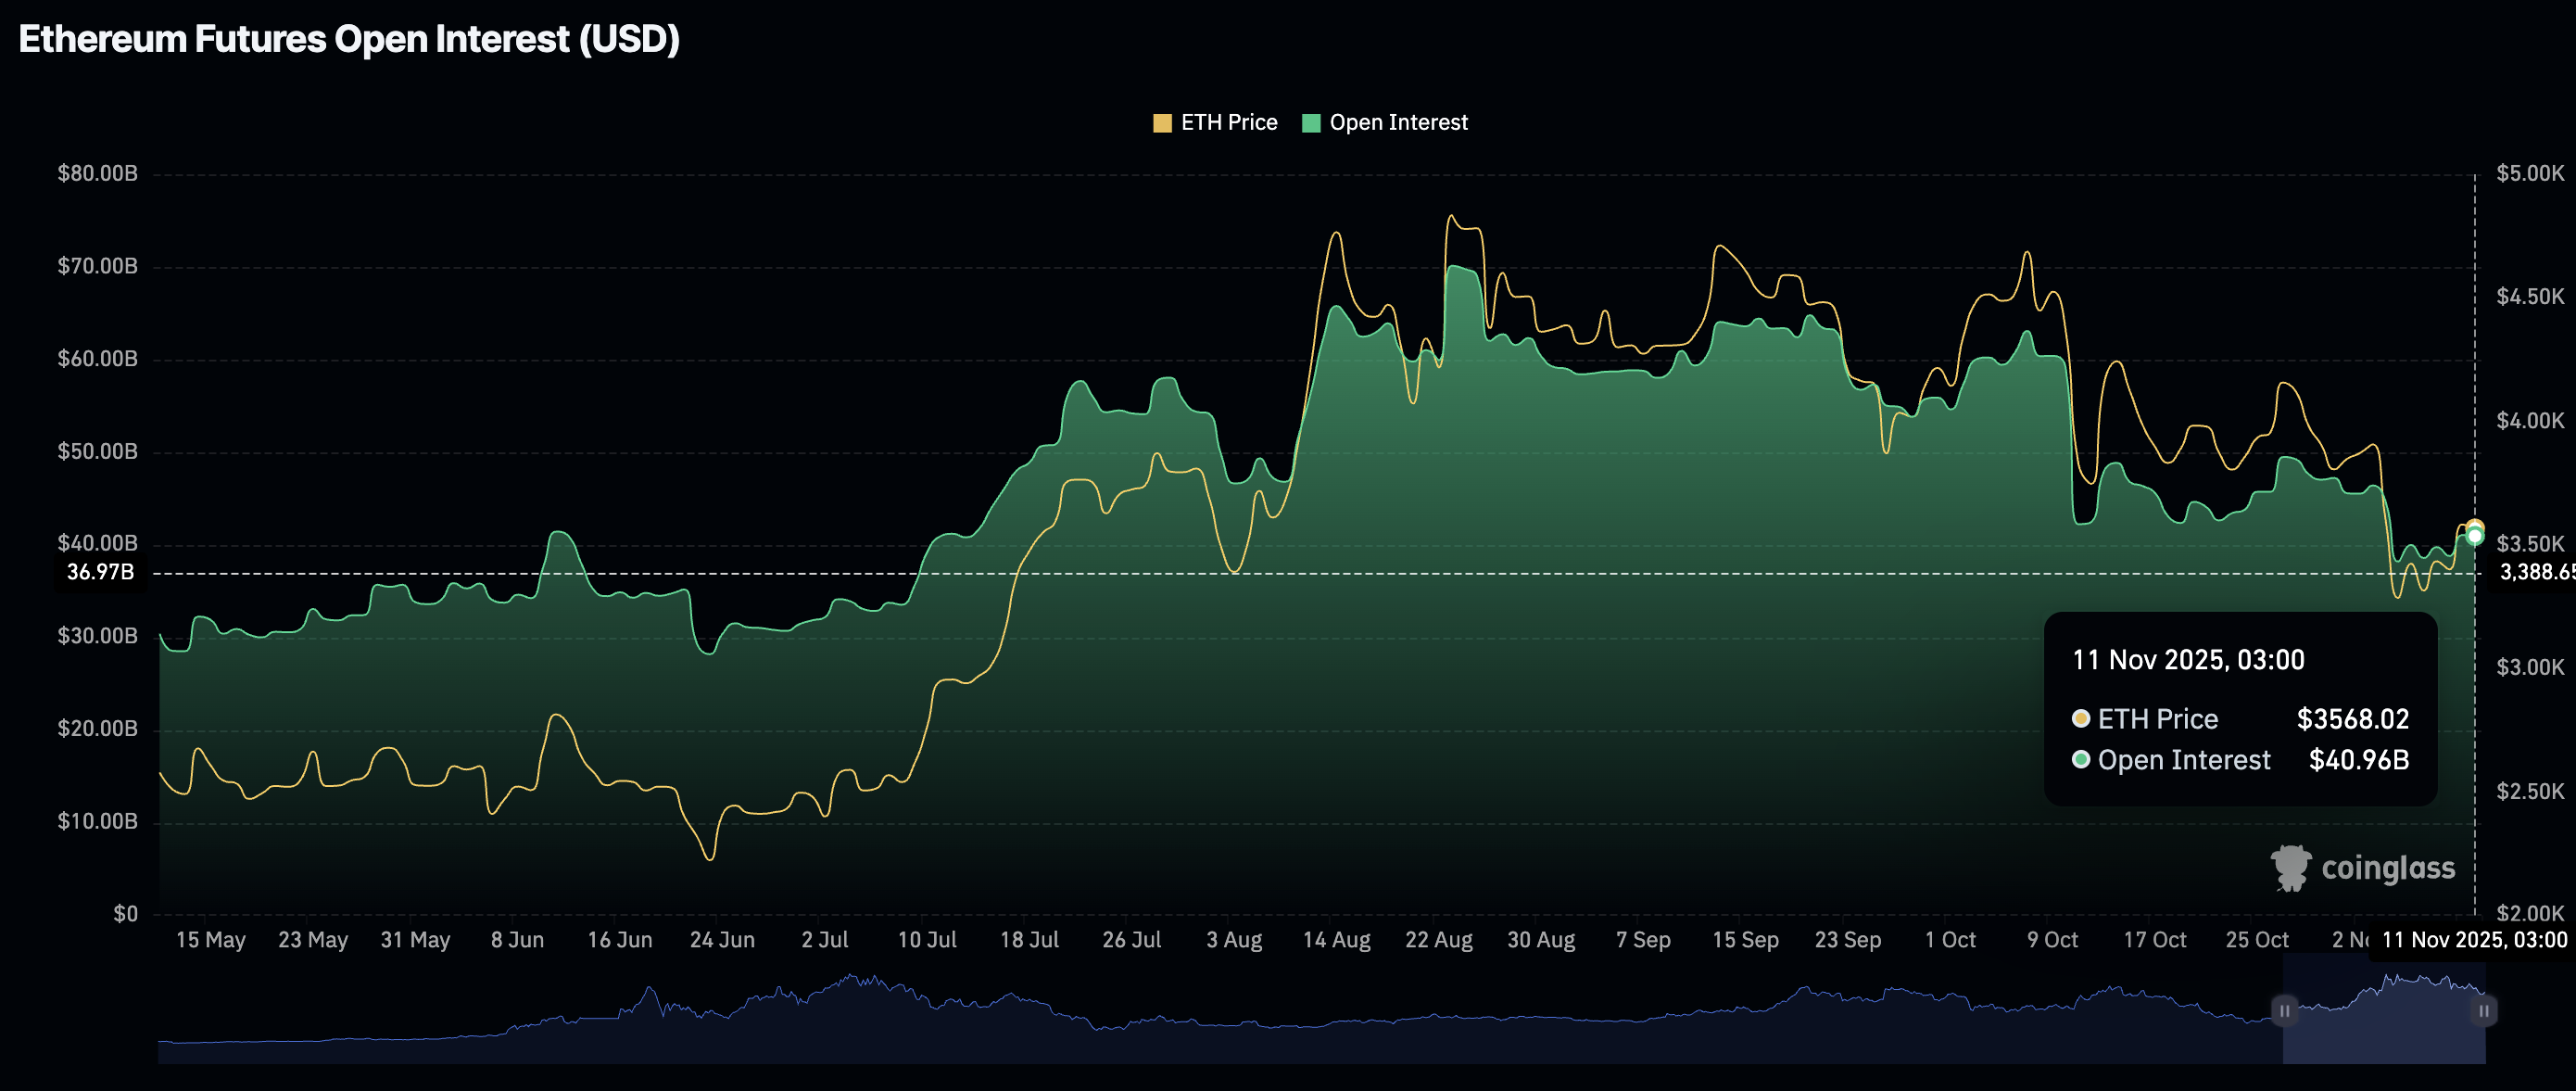
Retail demand for Ethereum has also not picked up following the October 10 deleveraging event, which saw over $19 billion in crypto assets liquidated in a single day.
The ETH futures Open Interest (OI) averages $41 billion at the time of writing, down from $46 billion on November 1. OI has to steadily rise to support Ethereum's recovery in the short to medium term.
Technical outlook: Ethereum gives back gains amid bearish signals
Ethereum is trading below $3,500 and key moving averages, including the 200-day Exponential Moving Average (EMA) at $3,594, the 100-day EMA at $3,878 and the 50-day EMA at $3,888 on the daily chart.
The smart contracts token is largely weighed down by potential profit-taking and reduced risk-on sentiment following Monday's upswing to highs around $3,656.
The Relative Strength Index (RSI) at 41 points to a further move toward oversold conditions, signaling that bullish momentum is fading. Ethereum may extend its down leg toward the next support at $3,350, which was last tested on Sunday.
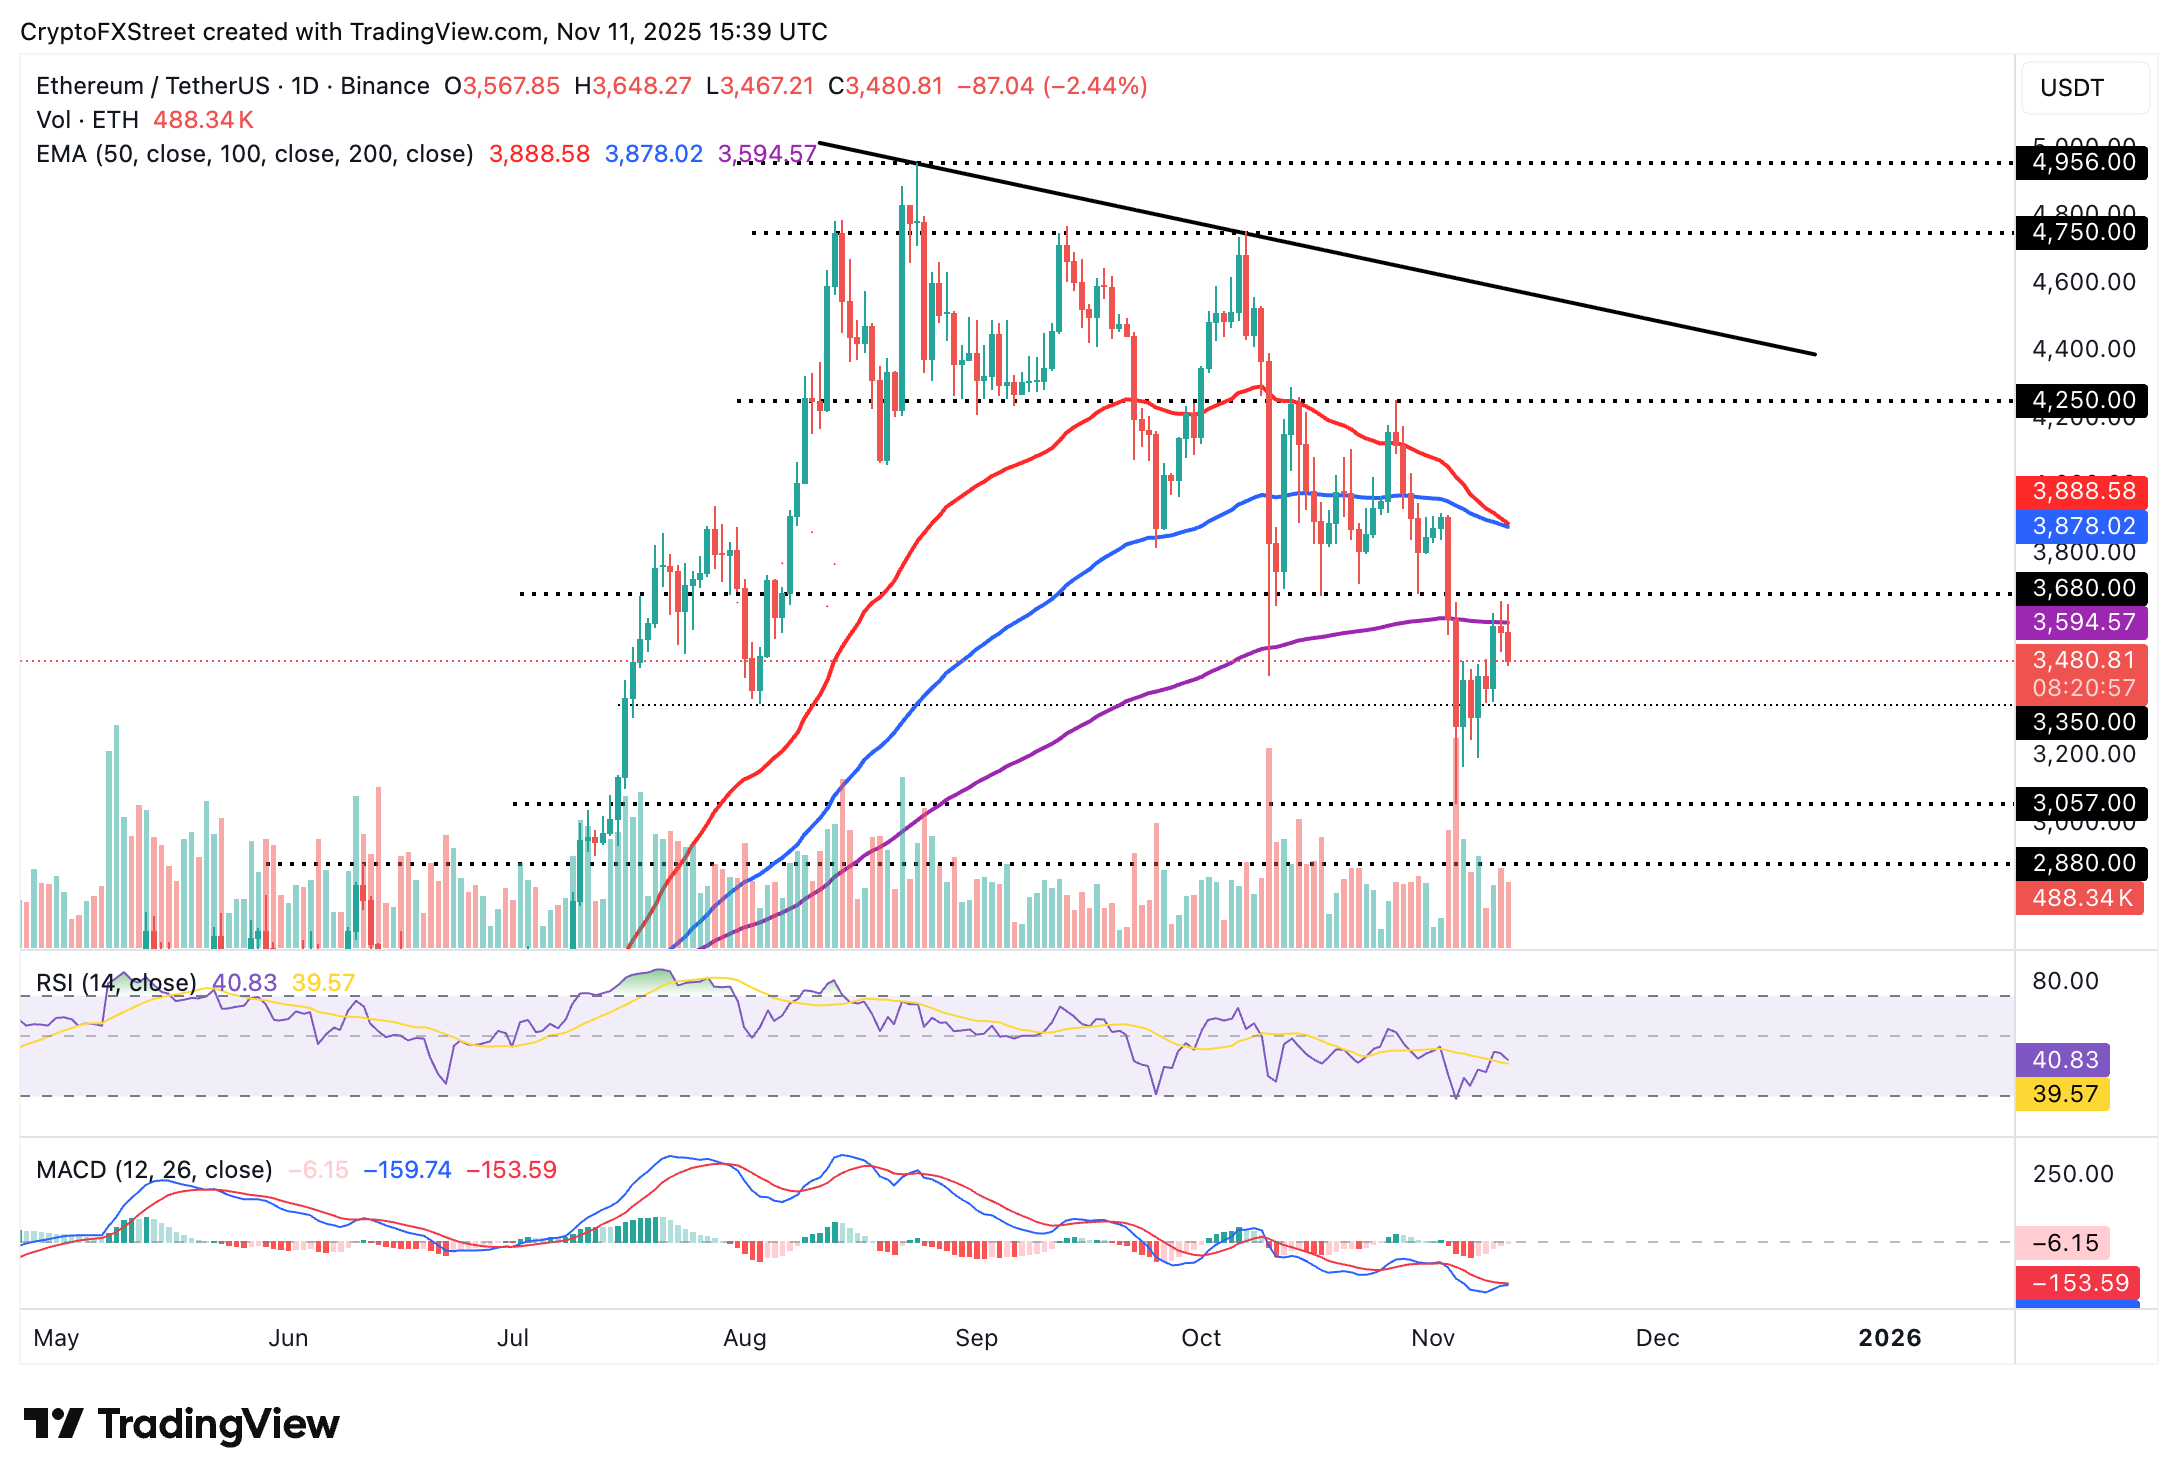
Conversely, the MACD is poised to flash a buy signal on the same chart if the blue line crosses and settles above the red line and the indicator generally rises. A buy signal would encourage bulls to seek exposure, further tailwinding a breakout above the 200-day EMA at $3,695.
Cryptocurrency metrics FAQs
The developer or creator of each cryptocurrency decides on the total number of tokens that can be minted or issued. Only a certain number of these assets can be minted by mining, staking or other mechanisms. This is defined by the algorithm of the underlying blockchain technology. On the other hand, circulating supply can also be decreased via actions such as burning tokens, or mistakenly sending assets to addresses of other incompatible blockchains.
Market capitalization is the result of multiplying the circulating supply of a certain asset by the asset’s current market value.
Trading volume refers to the total number of tokens for a specific asset that has been transacted or exchanged between buyers and sellers within set trading hours, for example, 24 hours. It is used to gauge market sentiment, this metric combines all volumes on centralized exchanges and decentralized exchanges. Increasing trading volume often denotes the demand for a certain asset as more people are buying and selling the cryptocurrency.
Funding rates are a concept designed to encourage traders to take positions and ensure perpetual contract prices match spot markets. It defines a mechanism by exchanges to ensure that future prices and index prices periodic payments regularly converge. When the funding rate is positive, the price of the perpetual contract is higher than the mark price. This means traders who are bullish and have opened long positions pay traders who are in short positions. On the other hand, a negative funding rate means perpetual prices are below the mark price, and hence traders with short positions pay traders who have opened long positions.
Artigos Recomendados


