
Crypto Today: Bitcoin, Ethereum, XRP pull back even as ETF inflows signal risk-on sentiment
- Bitcoin corrects near the 50-day EMA on Monday following $522 million in ETF inflows.
- Ethereum bulls appear fatigued under $4,200 despite a sudden increase in institutional demand.
- XRP remains in a tight range as bulls struggle to sustain recovery.
Bitcoin (BTC) shows signs of cooling off on Tuesday after extending its up leg above $114,000 the previous day. Sentiment in the broader cryptocurrency market remains relatively subdued, with main altcoins, including Ethereum (ETH) and Ripple (XRP), experiencing a slight correction following the gains accrued on Monday.
Institutional interest in Bitcoin and Ethereum is making a comeback, as evidenced by significant inflows into Exchange Traded Funds (ETFs). Still, market participants must consider the slow retail demand, which could suppress price action ahead of a short to medium-term breakout.
Data spotlight: Bitcoin, Ethereum attract institutional interest
Bitcoin spot ETFs experienced inflows of approximately $522 million on Monday, marking the end of two consecutive days of outflows. Institutional demand for ETFs has been a key driver of the Bitcoin price rally to new record highs of $124,474 reached on August 14.
A steady uptake of these financial products purchased directly on stock exchanges like NASDAQ could uphold Bitcoin's short-term bullish outlook toward the $116,000 round-number resistance and the medium-term target between $120,000 and the all-time high.

Bitcoin ETF stats | Source: CoinGlass
Ethereum also experienced significant spot ETF inflows on Monday, totaling $547 million. None of the nine ETFs in the United States (US) saw outflows, with Fidelity's FETH leading with inflows of $202 million, followed by BlackRock's ETHA with $154 million.
So far, ETH ETFs have a cumulative total net inflow of $13.67 billion and total net assets of $27.54 billion. Institutional demand continues to play a major role in Ethereum's uptrend, particularly the push to its record high of $4,956 on August 24.
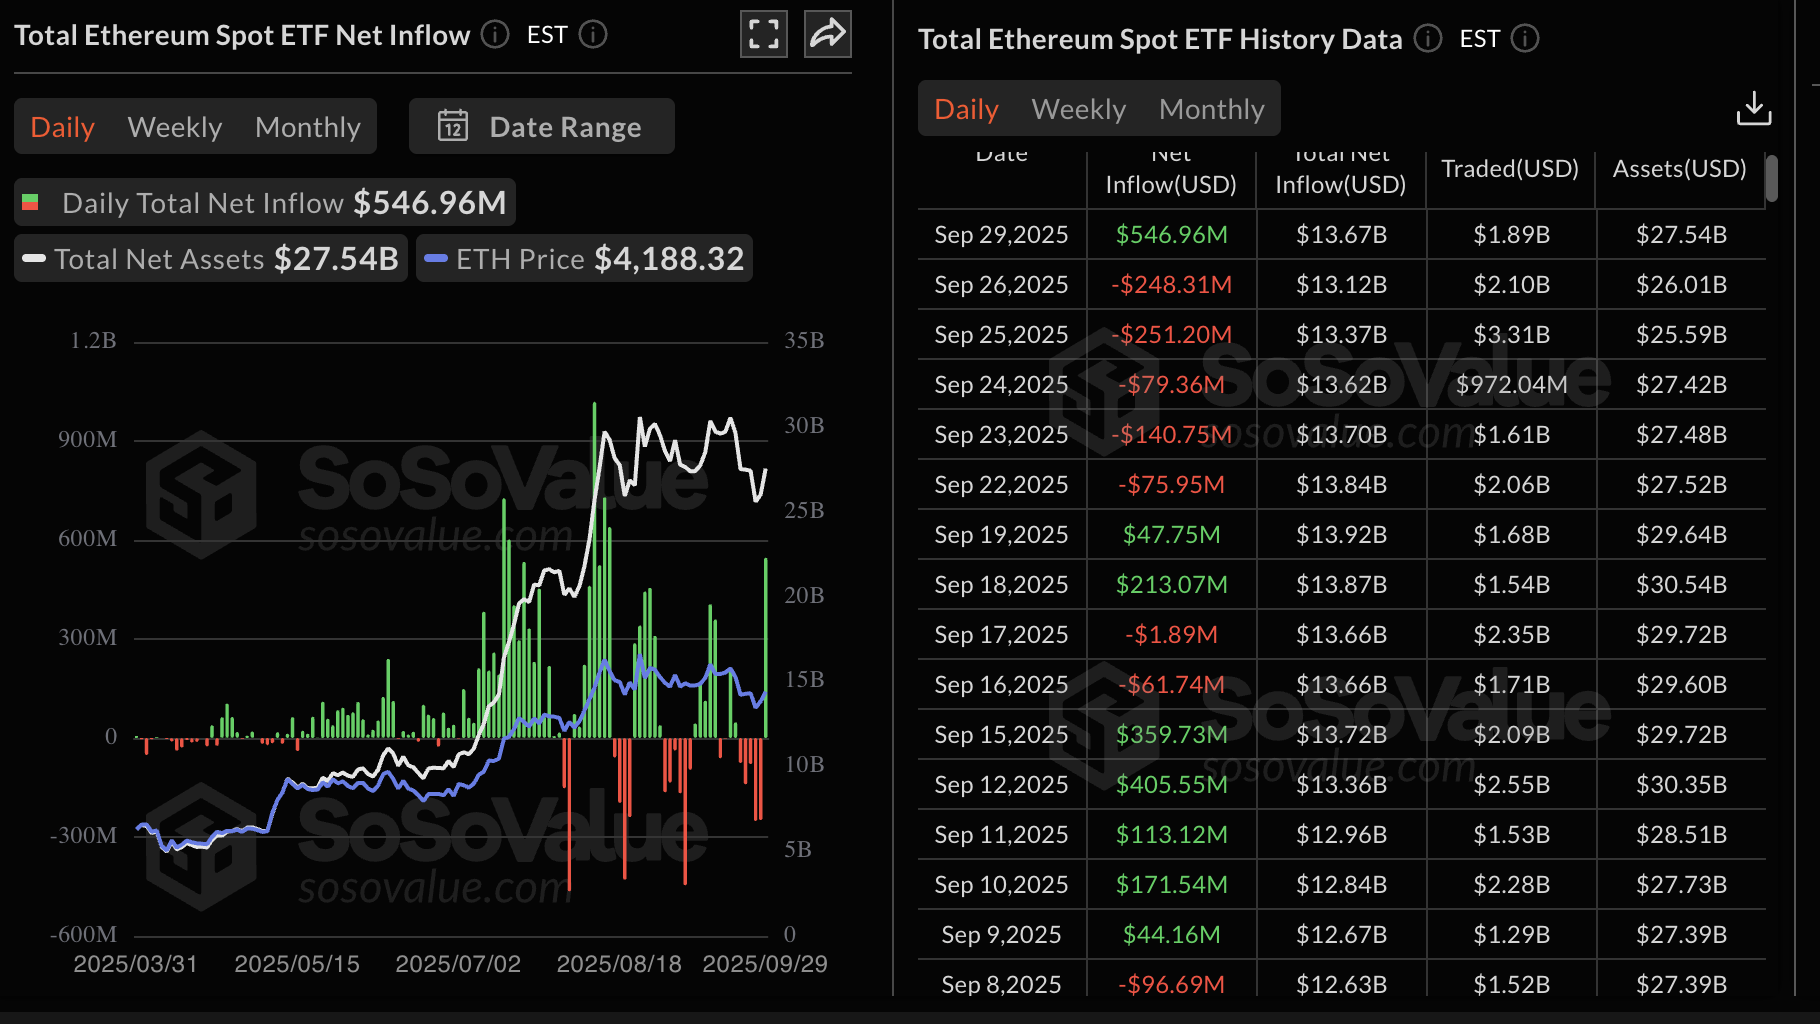
Ethereum ETF stats | Source: CoinGlass
Meanwhile, retail interest in XRP has stabilized at lower levels after the spike in volatility last week. According to CoinGlass data, Open Interest (OI), representing the notional value of outstanding futures contracts, averaged at $7.58 billion on Tuesday, down from $8.96 billion on September 19.
If OI increases, it would indicate that traders have a strong conviction in XRP's ability to sustain the uptrend and are willing to pile into long positions. Conversely, declining OI implies that investors are losing confidence in the cross-border money remittance token and its ecosystem, likely keeping the price suppressed.
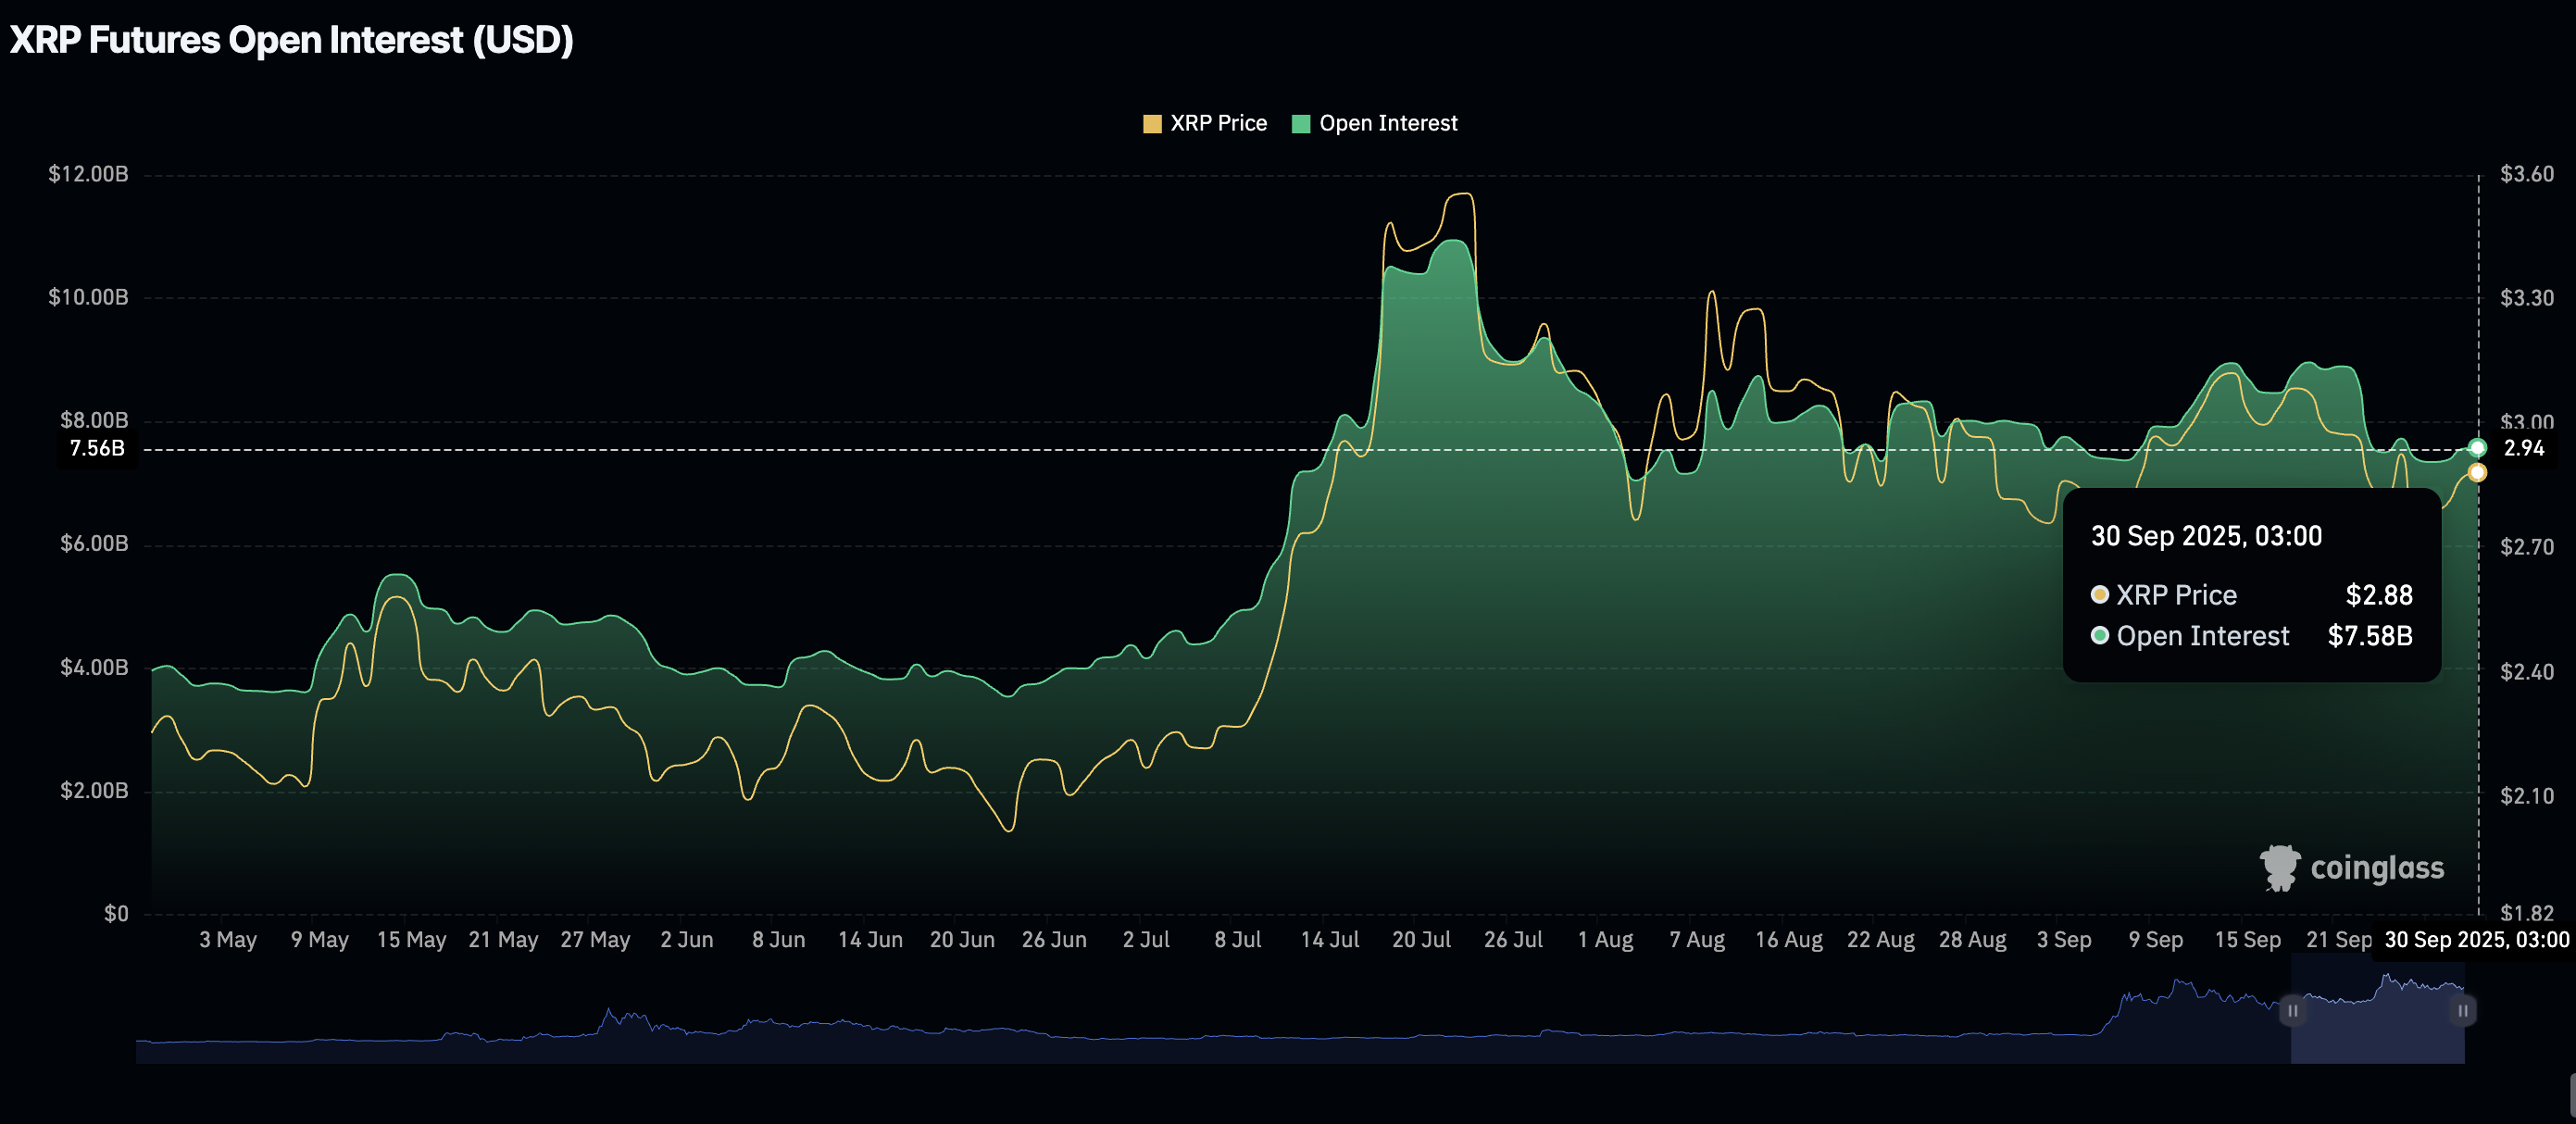
XRP Open Interest | Source: CoinGlass
Chart of the day: Bitcoin uptrend stalls
Bitcoin bulls are struggling to hold the price around the 50-day Exponential Moving Average (EMA), currently at $113,337 on the daily chart. Monday's recovery failed to sustain above the $114,000 level, signaling short-term profit-taking. The Relative Strength Index (RSI) sits in the neutral zone after peaking at 53 the previous day as bullish momentum fades.
The Moving Average Convergence Divergence (MACD) indicator was close to triggering a buy signal, but the red histogram bars below the mean line reinforce the bearish grip. Risk-off sentiment could prevail if the blue line remains below the red signal line.
Key areas of interest for traders are the 100-day EMA at $111,830, which could absorb selling pressure if headwinds intensify, and the support range marked in green around $107,000 on the same daily chart. This area represents Bitcoin's strongest support above $100,000; therefore, if broken, declines could accelerate, triggering additional liquidations.
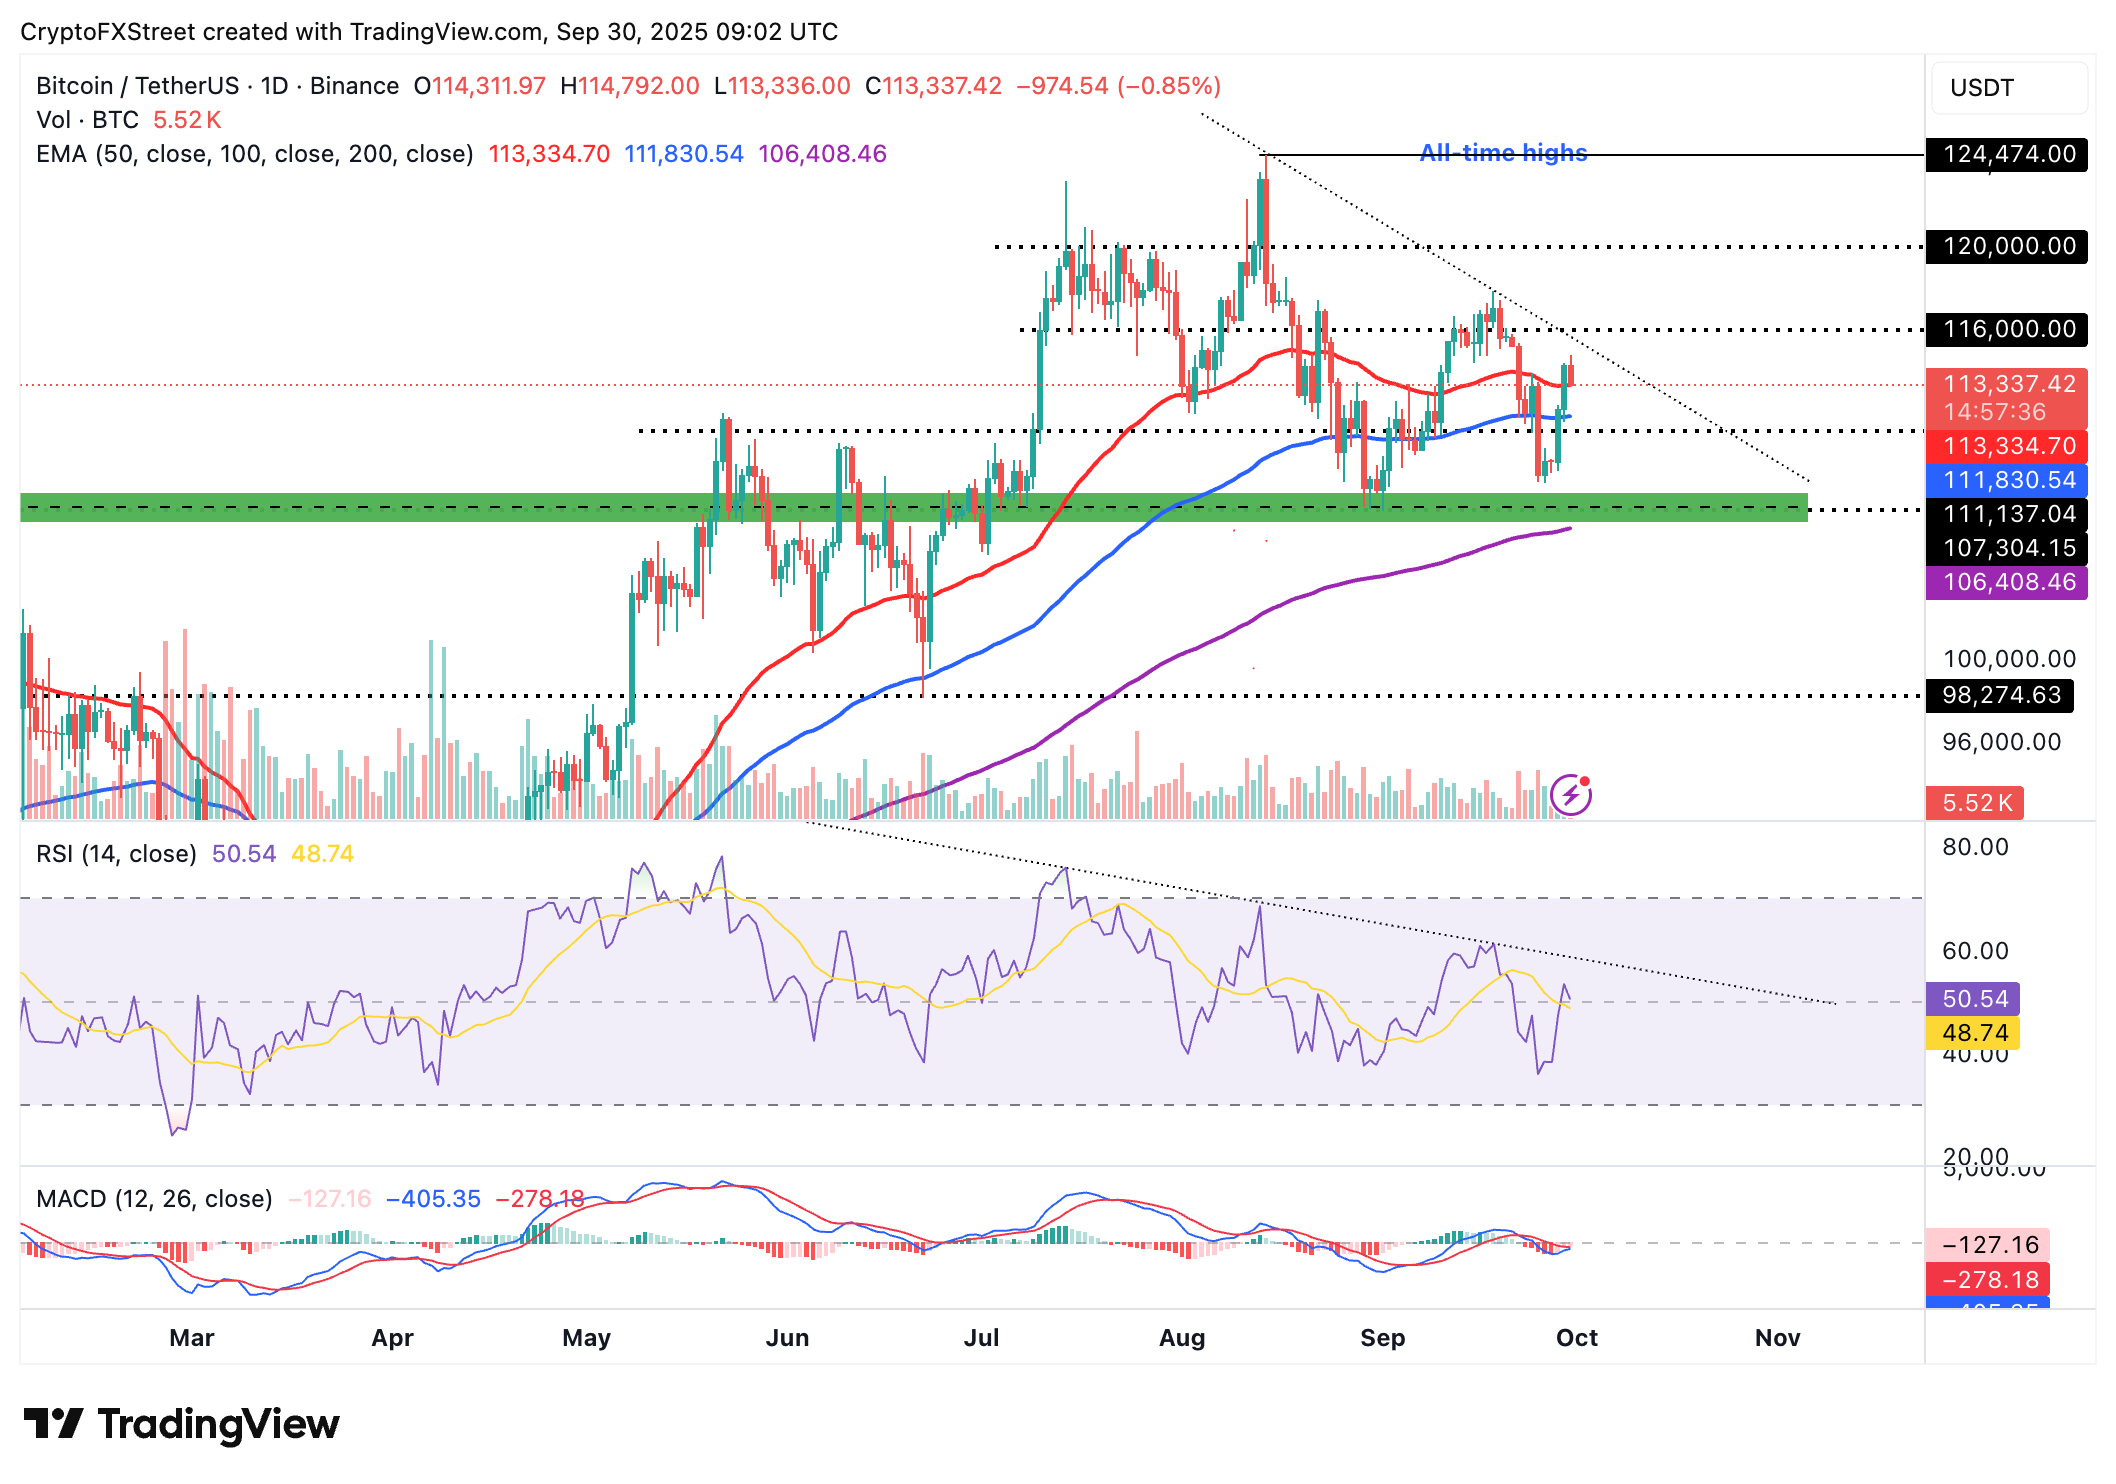
BTC/UDSDT daily chart
Altcoins update: Ethereum, XRP in choppy consolidation
Ethereum is edging lower after testing the 50-day EMA resistance at $4,210. With the signal line having crossed below the RSI earlier in the day on the daily chart, this pullback could extend in upcoming sessions. The MACD reinforces the short-term risk-off sentiment, prompting investors to consider reducing their risk exposure. The blue MACD line, which is holding below the red signal line, signals dwindling bullish momentum.
Key moving averages provide a supportive floor: The 100-day EMA at $3,871 and the 200-day EMA at $3,425 both align for a medium-term bullish technical outlook. Hence, breaking above the 50-day EMA could reaffirm bulls and position the Ethereum price for gains toward the medium-term target of $4,500, followed by the record high of $4,956.
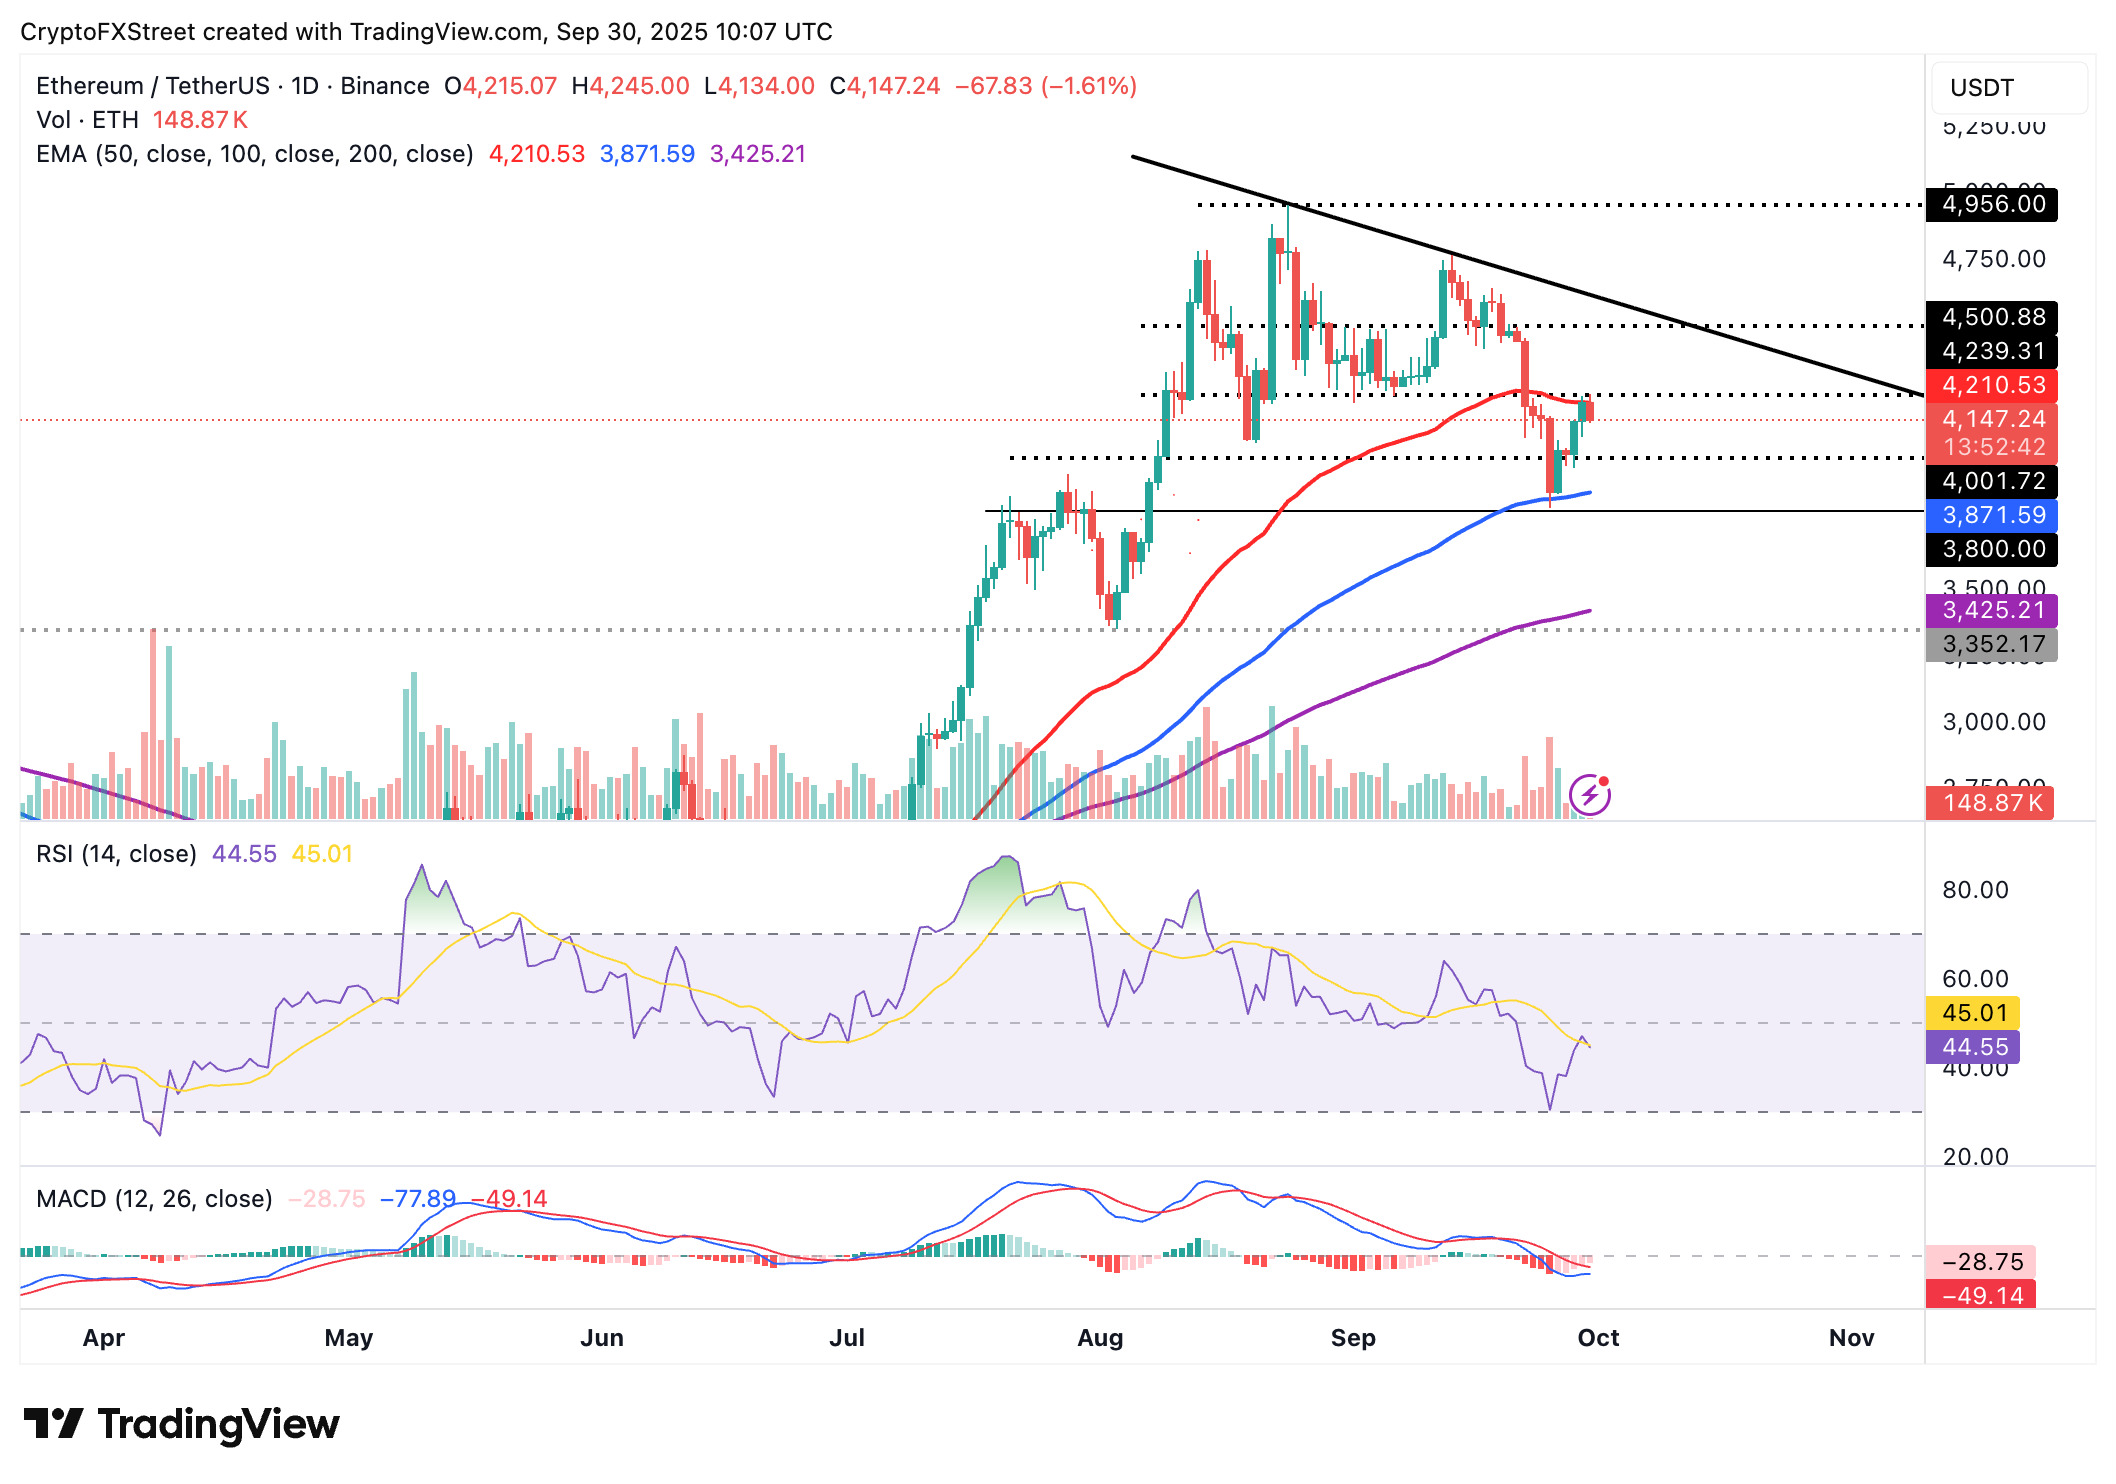
ETH/USDT daily chart
As for XRP, the price fluctuates between support provided by the 100-day Exponential Moving Average (EMA) at $2.83 and the 50-day EMA resistance at $2.92. Bears appear intent on extending the ongoing correction below the 100-day EMA, a critical support level, and potentially breaking under the next demand zone at $2.70, which was previously tested on Friday.
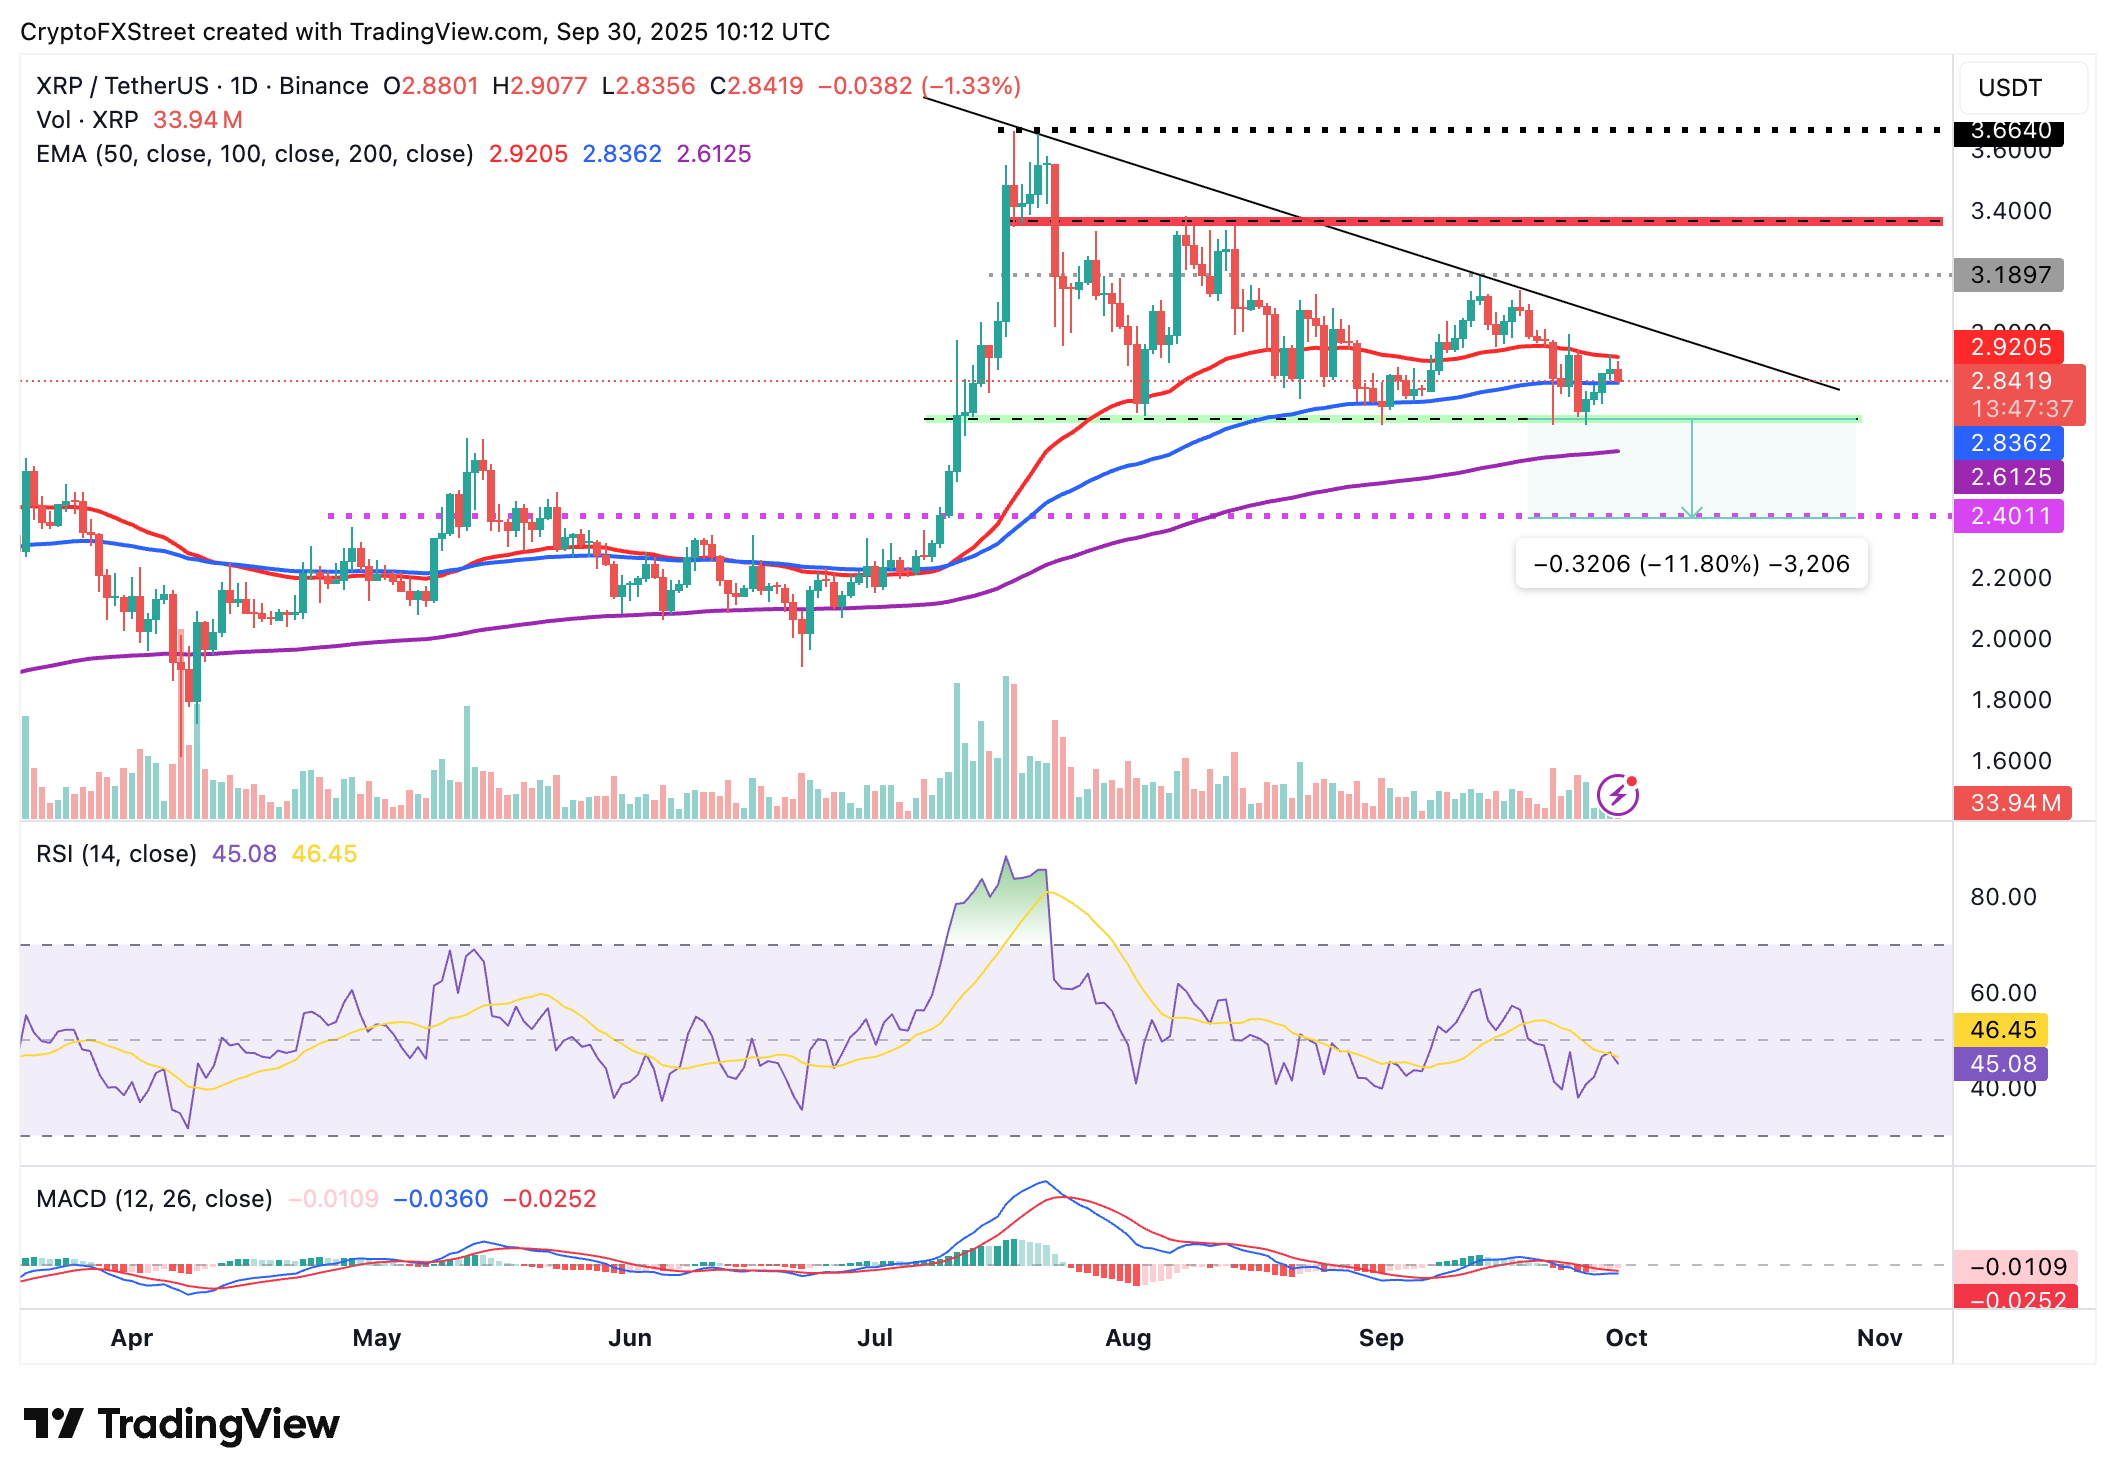
XRP/USDT daily chart
Key milestones would include a sustained break above the short-term 50-day EMA at $2.92, followed by gains above the descending trendline and the supply zone at $3.18. On the other hand, losing ground below the demand zone at $2.70 could encourage risk-on sentiment, increasing the probability of XRP resuming the downtrend toward the 200-day EMA at $2.61.
Crypto ETF FAQs
An Exchange-Traded Fund (ETF) is an investment vehicle or an index that tracks the price of an underlying asset. ETFs can not only track a single asset, but a group of assets and sectors. For example, a Bitcoin ETF tracks Bitcoin’s price. ETF is a tool used by investors to gain exposure to a certain asset.
Yes. The first Bitcoin futures ETF in the US was approved by the US Securities & Exchange Commission in October 2021. A total of seven Bitcoin futures ETFs have been approved, with more than 20 still waiting for the regulator’s permission. The SEC says that the cryptocurrency industry is new and subject to manipulation, which is why it has been delaying crypto-related futures ETFs for the last few years.
Yes. The SEC approved in January 2024 the listing and trading of several Bitcoin spot Exchange-Traded Funds, opening the door to institutional capital and mainstream investors to trade the main crypto currency. The decision was hailed by the industry as a game changer.
The main advantage of crypto ETFs is the possibility of gaining exposure to a cryptocurrency without ownership, reducing the risk and cost of holding the asset. Other pros are a lower learning curve and higher security for investors since ETFs take charge of securing the underlying asset holdings. As for the main drawbacks, the main one is that as an investor you can’t have direct ownership of the asset, or, as they say in crypto, “not your keys, not your coins.” Other disadvantages are higher costs associated with holding crypto since ETFs charge fees for active management. Finally, even though investing in ETFs reduces the risk of holding an asset, price swings in the underlying cryptocurrency are likely to be reflected in the investment vehicle too.
Artigos Recomendados


