
Dog-based meme coins DOGE and SHIB rebound as bullish sentiment creeps back in
- Dogecoin price rebounds above $0.223 on Thursday after finding support around its key level earlier in the week.
- Shiba Inu price holds support around $0.000011, eyeing a potential recovery move.
- Both dog-based meme coin funding rates have flipped into positive territory, and momentum indicators suggest fading of bearish pressure.
Dogecoin (DOGE) and Shiba Inu (SHIB) prices are showing signs of resilience after a recent pullback, with both meme coins rebounding from key support levels. DOGE trades above $0.223 while SHIB steadies above $0.000011 at the time of writing on Thursday. Derivatives data for these dog-based meme coins indicate a positive funding rate and a fading bearish pressure, suggesting a further recovery on the horizon.
DOGE and SHIB show bullish sentiment
CoinGlass data indicates a bullish outlook for dog-based meme coins as reflected in a positive spike in funding rate data. The metric, as shown in the graph below, has flipped to a positive rate for both meme coins on Wednesday, with respective readings of 0.0086% for DOGE and 0.0088% for SHIB, indicating that longs are paying shorts. Historically, when funding rates have shown a massive positive spike, the prices of DOGE and SHIB have rallied sharply.
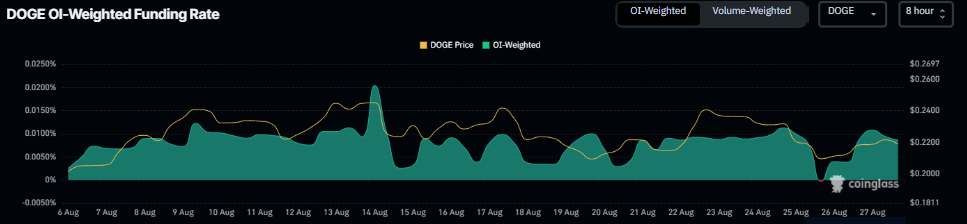
DOGE funding rate chart. Source: Coinglass
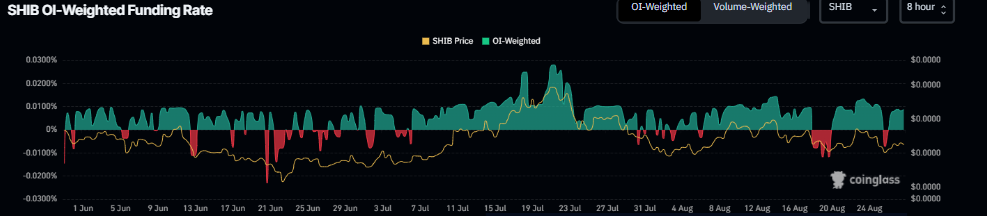
SHIB funding rate chart. Source: Coinglass
DOGE Price Forecast: Rebounds from key support zone
Dogecoin price found support around its 100-day Exponential Moving Average (EMA) at $0.211 on Tuesday, recovering slightly the next day. This level also coincides with the 200-day EMA, making it a key support zone. At the time of writing on Thursday, it extends its recovery trading above $0.223.
If the support level at $0.211 continues to hold, DOGE could extend the recovery toward its daily resistance at $0.247.
The Relative Strength Index (RSI) on the daily chart is approaching its neutral level of 50, indicating a fading of bearish momentum. The Moving Average Convergence Divergence (MACD) lines are also converging, indicating indecisiveness among traders.
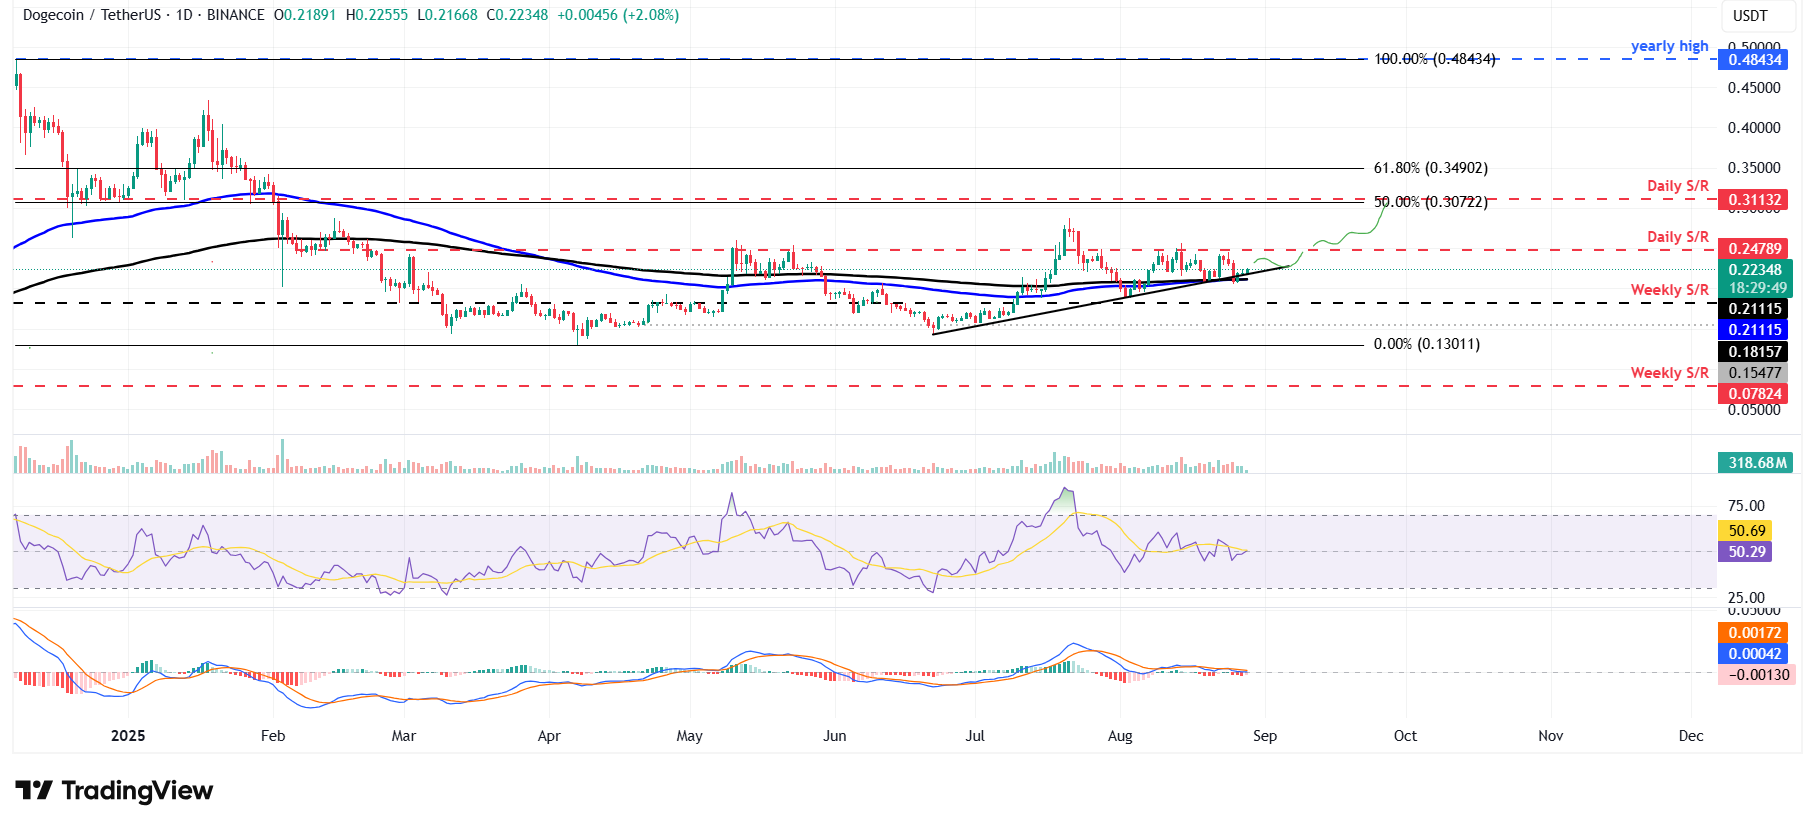
DOGE/USDT daily chart
However, if DOGE faces a correction and closes below its support at $0.211, it could extend the decline toward its weekly support at $0.181.
SHIB Price Forecast: Signs of recovery
Shiba Inu price found support around its daily level at $0.000011 on Tuesday and recovered 5%. At the time of writing on Thursday, it hovers at around $0.000012.
If SHIB continues its recovery, it could extend the gains toward its 200-day EMA at $0.000014.
The RSI indicator is pointing upward toward its neutral level of 50, indicating fading bearish momentum. For the recovery rally to be sustained, the RSI must move above its neutral level.
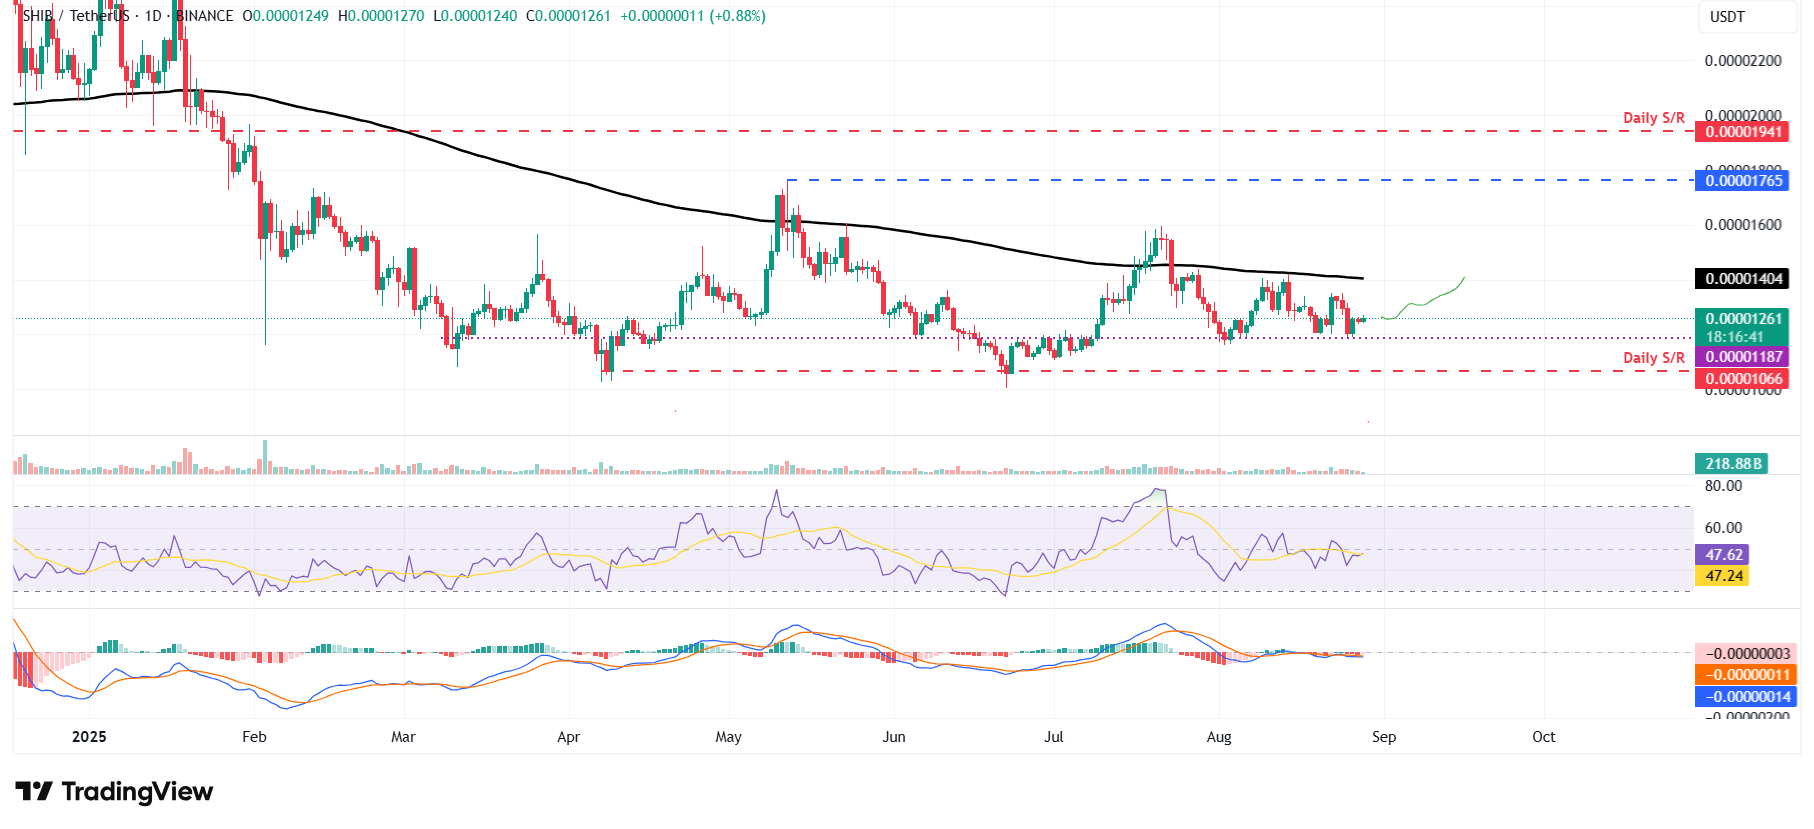
SHIB/USDT daily chart
On the other hand, if SHIB faces a correction, it could extend the decline toward its daily support at $0.000011.
Artigos Recomendados


