


Gold retreats slightly as Fed puts breaks on quick easing cycle
- Gold trades marginally lower on Thursday after the Federal Reserve’s more-sober-than-expected policy assessment.
- Gold spiked higher following cooler US inflation data on Wednesday, however, it pulled back after the Fed meeting.
- XAU/USD might have formed a bearish Head-and-Shoulders pattern on the daily chart.
Gold (XAU/USD) trades marginally lower in familiar territory in the $2,310s on Thursday, after some volatile whipsaws. The yellow metal remains broadly stuck in the range between $2,270 and $2,450, the parameters of which were pegged out in April and early May.
Gold has steadied after its spike higher on Wednesday due to the release of less-inflationary US data, which recalibrated near-term interest-rate expectations lower, benefiting Gold.
A more sober assessment by the US Federal Reserve (Fed) after their meeting later on Wednesday, however, stopped bulls in their tracks, after Fed Chair Jerome Powell advocated a cautious data-dependent approach to interest rates going forward.
Gold volatile on snap revisions to interest-rate outlook
Gold shot higher in the minutes following the release of US Consumer Price Index (CPI) data for May on Wednesday.
Headline CPI showed prices steadied month-over-month in May from the 0.3% increase in April, and edged up by 3.3% year-over-year compared to 3.4% previously. The readings were below economists's expectations of 0.1% MoM and 3.4% YoY.
CPI ex Food & Energy showed prices rose 0.2% MoM from 0.3% in April and 3.4% YoY from 3.6% previously. This was also below expectations of 0.3% and 3.5%, respectively.
The cooler-than-expected CPI data led to a sell-off in the US Dollar (USD) which is negatively correlated to Gold.
Gold price itself rose over half a percent to a peak of $2,342 after the release. Lower inflation suggests interest rates are more likely to fall, which in turn reduces the opportunity cost of holding Gold, making it more attractive to investors.
The data provided a counterweight to US Nonfarm Payrolls (NFP) data on Friday, which reflected a buoyant labor market and rising wages in the US. These were expected to put upside pressure on inflation.
Fed pours cold water on rate cut hopes
Market optimism at the possibility of lower interest rates, however, was quickly curtailed by a more sober assessment from those that are responsible for setting interest rates, the officials of the US Federal Reserve.
The Fed did not see fit to alter interest rates at their June meeting on Wednesday, as expected. However, they did radically dial down projections of future rate cuts in their attached Summary of Economic Projections (SEP), or dot-plot. This showed Fed officials now on average project only one 0.25% reduction in 2024, compared to three 0.25% cuts in the previous March SEP.
“The revised Summary of Economic Projections, the so called dot-plot published alongside the policy statement, showed that 4 of 19 officials saw no rate cuts in 2024, 7 projected a 25 basis points (bps) rate reduction, while 8 marked down a 50 bps cut in the policy rate,” says Eren Sengezer, Lead Analyst at FXStreet.
Gold retreated on the news, pulling back down to close the day at $2,325.
Traders of the precious metal now await US Producer Price Index data, or “factory gate prices” at 12:30 GMT on Thursday for more intelligence regarding the outlook for inflation and interest rates.
Technical Analysis: Gold potentially forming Head-and-Shoulders
Gold is potentially forming a bearish Head-and-Shoulders (H&S) price pattern. These patterns generally occur at market tops and signal a change of trend. If the H&S is valid it may be an indication that the medium-term bull trend is reversing.
XAU/USD Daily Chart
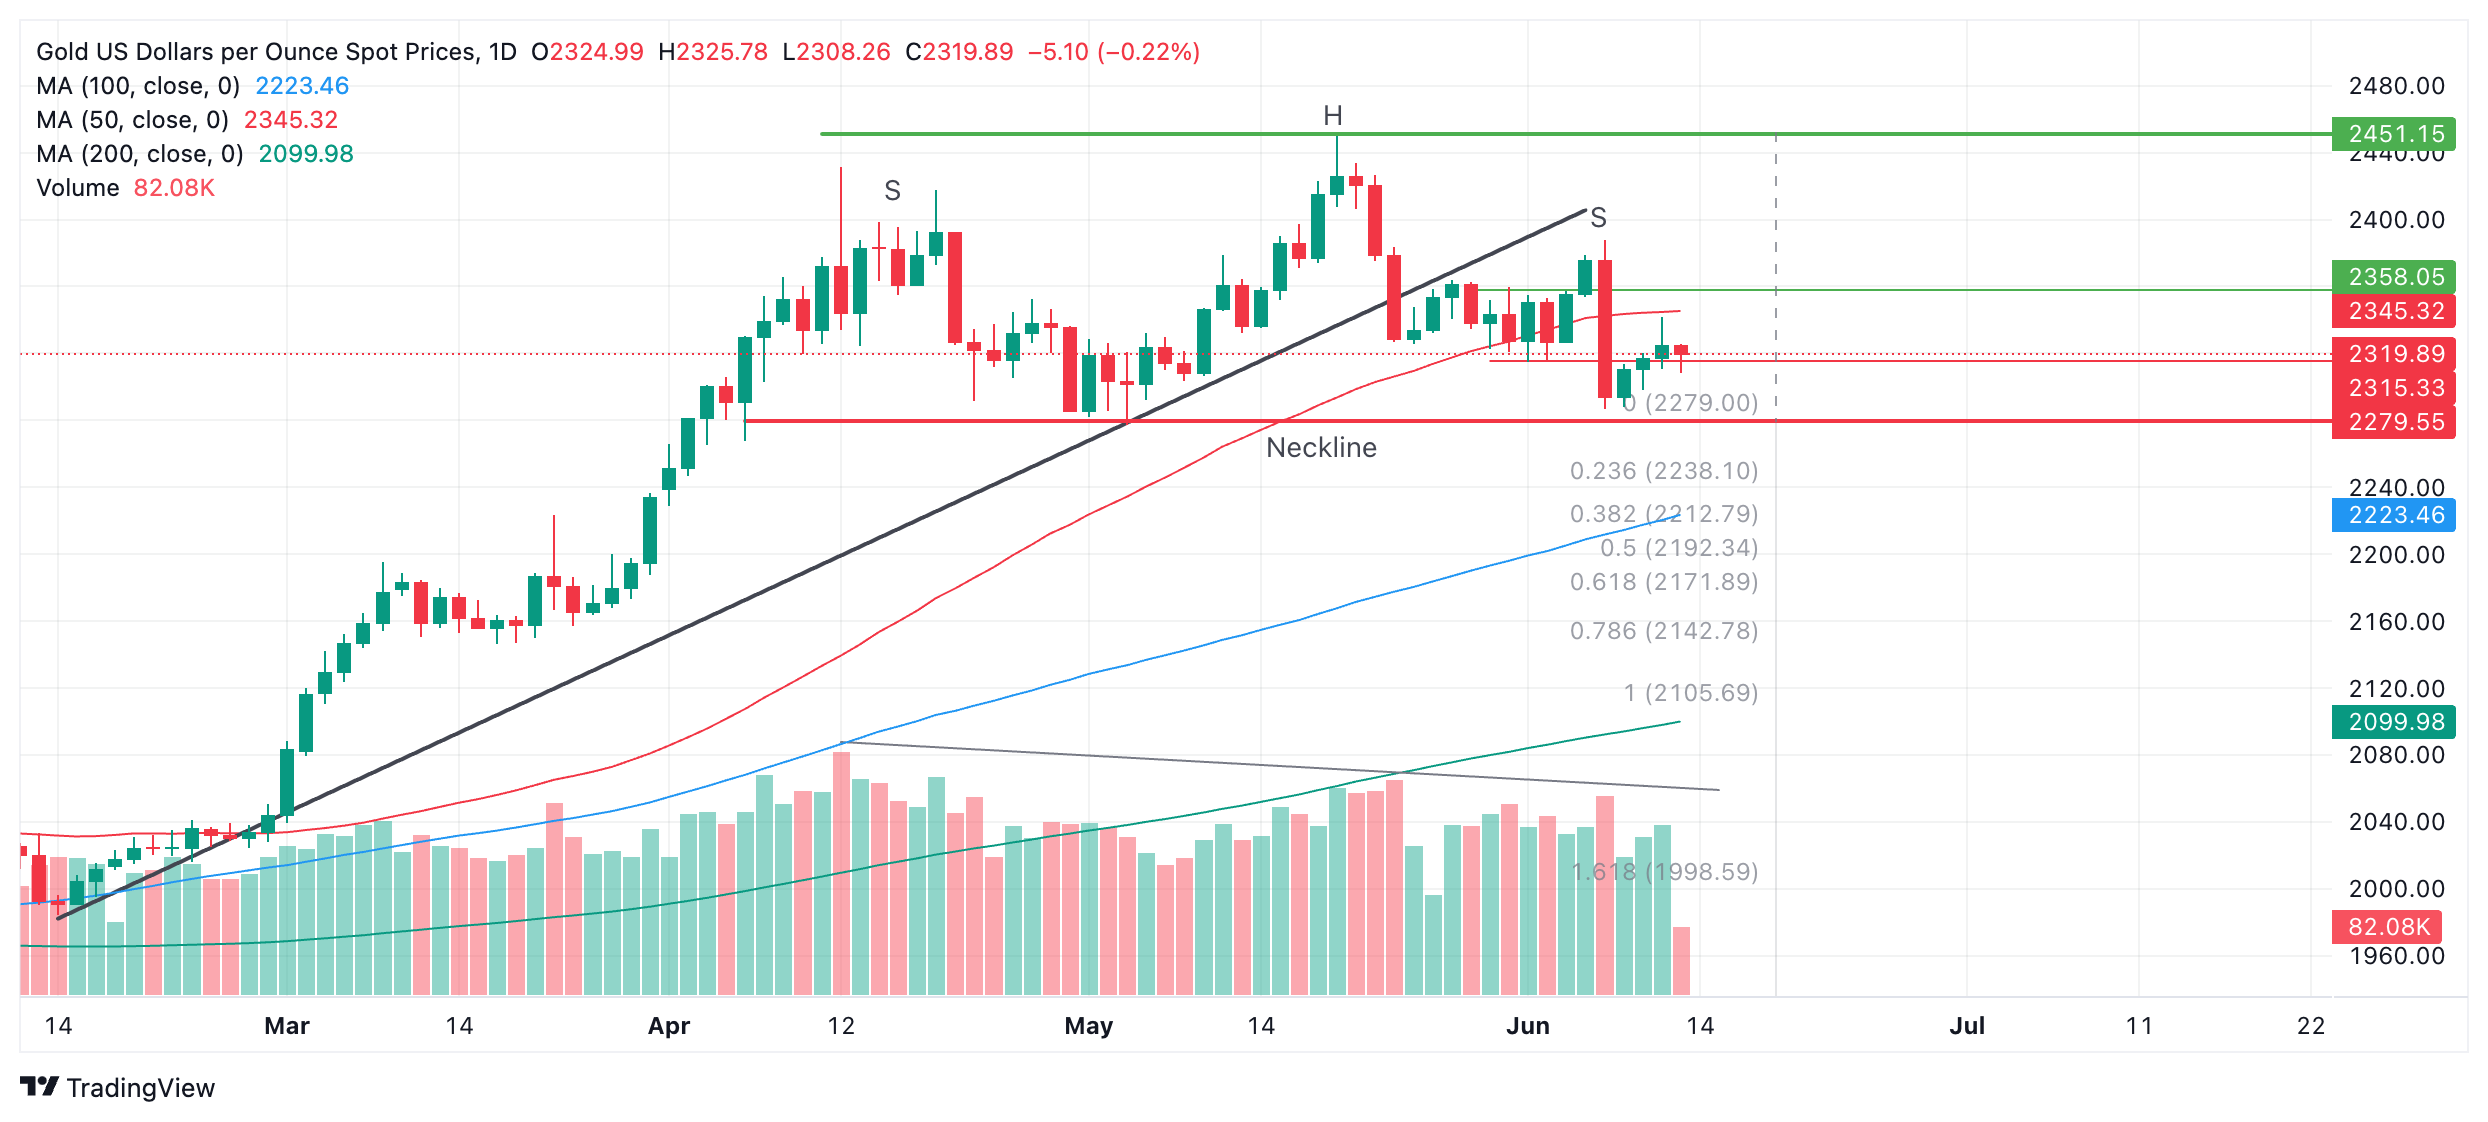
The H&S pattern began forming in April and has now completed a left and right shoulder (labeled “S”) and a “head” (labeled “H”). The so-called “neckline” of the pattern appears to be at the $2,279 support level (red line).
Declining trade volume during its development corroborates the pattern.
A decisive break below the neckline would validate the H&S pattern and activate downside targets. The first, more conservative, target would be $2,171, calculated by taking the 0.618 Fibonacci ratio of the height of the pattern and extrapolating it lower from the neckline. The second target would be at $2,106, the full height of the pattern extrapolated lower.
A break above $2,345, however, would bring the H&S into doubt and could signal a continuation higher, to an initial target at the $2,450 peak.
Economic Indicator
Fed Interest Rate Decision
The Federal Reserve (Fed) deliberates on monetary policy and makes a decision on interest rates at eight pre-scheduled meetings per year. It has two mandates: to keep inflation at 2%, and to maintain full employment. Its main tool for achieving this is by setting interest rates – both at which it lends to banks and banks lend to each other. If it decides to hike rates, the US Dollar (USD) tends to strengthen as it attracts more foreign capital inflows. If it cuts rates, it tends to weaken the USD as capital drains out to countries offering higher returns. If rates are left unchanged, attention turns to the tone of the Federal Open Market Committee (FOMC) statement, and whether it is hawkish (expectant of higher future interest rates), or dovish (expectant of lower future rates).
Read more.Last release: Wed Jun 12, 2024 18:00
Frequency: Irregular
Actual: 5.5%
Consensus: 5.5%
Previous: 5.5%
Source: Federal Reserve
Artigos Recomendados


