

Australian Dollar declines despite improved Consumer Sentiment index
- The Australian Dollar inches lower possibly due to investors' caution as looming inflation data.
- Australia's Westpac Consumer Confidence rose by 1.7% MoM in June, marking the highest level since February.
- The US Dollar may limit its downside strong US business activity data dampened expectations for Fed rate cuts.
The Australian Dollar (AUD) inches lower on Tuesday despite an improvement in Australia's Westpac Consumer Confidence Index, released on Tuesday. This decline could be attributed to the investors' caution ahead of this week's Australian inflation data. However, the AUD/USD pair may limit its downside due to the hawkish stance of the Reserve Bank of Australia (RBA).
The RBA Governor Michele Bullock said during her latest press conference that the Board discussed potential rate hikes, dismissing considerations of rate cuts in the near term, as per ABC News. Markets have significantly reduced their expectations for a RBA’s rate cut this year, with an easing not anticipated until April next year.
The US Dollar trades on a softer note ahead of key US economic data due later this week. The revised US Gross Domestic Product (GDP) for the first quarter (Q1) is set to be released on Thursday, followed by the Personal Consumption Expenditure (PCE) Price Index on Friday.
Daily Digest Market Movers: Australian Dollar edges lower due to risk aversion
- Australia's Westpac Consumer Confidence rose by 1.7% month-over-month in June, rebounding from a 0.3% decline the previous month. This marks the first increase in four months and the highest level since February.
- According to the CME FedWatch Tool, investors are pricing in nearly 67.7% odds of a Fed rate cut in September, compared to 61.5% a week earlier.
- On Tuesday, the People's Bank of China injected 300 billion Yuan via seven-day reverse repos, maintaining the reverse repo rate at 1.8%. Any change in the Chinese economy could impact the Australian market, as China and Australia are close trade partners.
- On Friday, the US Composite PMI for June surpassed expectations, rising to 54.6 from May’s reading of 54.5. This figure marked the highest level since April 2022. The Manufacturing PMI increased to a reading of 51.7 from a 51.3 figure, exceeding the forecast of 51.0. Similarly, the Services PMI rose to 55.1 from 54.8 in May, beating the consensus estimate of 53.7.
- As per a Reuters report, Fed Reserve Bank of Minneapolis President Neel Kashkari noted on Thursday that it will probably take a year or two to get inflation back to 2%.
Technical Analysis: Australian Dollar hovers around 0.6650
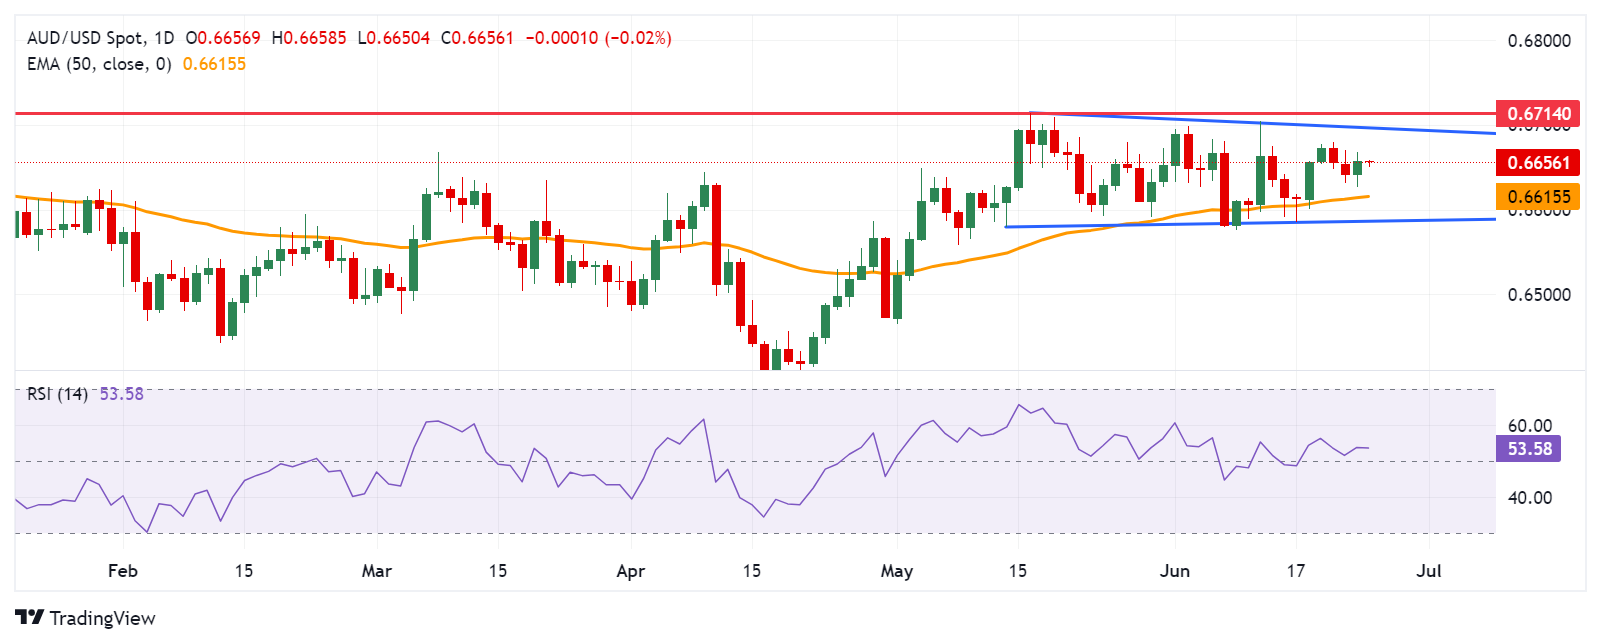
The Australian Dollar trades around 0.6650 on Tuesday. Analysis of the daily chart shows a neutral bias for the AUD/USD pair as it consolidates within a rectangle formation. The 14-day Relative Strength Index (RSI) is positioned slightly above the 50 level, indicating a potential bullish bias.
The AUD/USD pair may find support around the 50-day Exponential Moving Average (EMA) at 0.6615, with additional support near 0.6585, marking the lower boundary of the rectangle formation.
On the upside, the AUD/USD pair may encounter resistance near the upper boundary of the rectangle formation around 0.6695, aligned with the psychological level of 0.6700. Beyond that, potential resistance levels include the high of 0.6714 observed since January.
AUD/USD: Daily Chart
Australian Dollar price today
The table below shows the percentage change of the Australian Dollar (AUD) against listed major currencies today. The Australian Dollar was the weakest against the Japanese Yen.
| USD | EUR | GBP | CAD | AUD | JPY | NZD | CHF | |
| USD | -0.02% | -0.03% | -0.03% | -0.03% | -0.14% | -0.05% | -0.09% | |
| EUR | 0.02% | -0.03% | -0.01% | -0.01% | -0.10% | -0.03% | -0.07% | |
| GBP | 0.03% | 0.01% | 0.00% | 0.00% | -0.09% | -0.02% | -0.05% | |
| CAD | 0.03% | 0.01% | 0.00% | 0.00% | -0.09% | -0.02% | -0.06% | |
| AUD | 0.03% | 0.00% | -0.01% | -0.01% | -0.10% | -0.03% | -0.05% | |
| JPY | 0.14% | 0.12% | 0.11% | 0.11% | 0.07% | 0.07% | 0.05% | |
| NZD | 0.04% | 0.03% | 0.02% | 0.02% | 0.02% | -0.07% | -0.04% | |
| CHF | 0.08% | 0.06% | 0.05% | 0.05% | 0.05% | -0.04% | 0.03% |
The heat map shows percentage changes of major currencies against each other. The base currency is picked from the left column, while the quote currency is picked from the top row. For example, if you pick the Euro from the left column and move along the horizontal line to the Japanese Yen, the percentage change displayed in the box will represent EUR (base)/JPY (quote).
Australian Dollar FAQs
One of the most significant factors for the Australian Dollar (AUD) is the level of interest rates set by the Reserve Bank of Australia (RBA). Because Australia is a resource-rich country another key driver is the price of its biggest export, Iron Ore. The health of the Chinese economy, its largest trading partner, is a factor, as well as inflation in Australia, its growth rate, and Trade Balance. Market sentiment – whether investors are taking on more risky assets (risk-on) or seeking safe havens (risk-off) – is also a factor, with risk-on positive for AUD.
The Reserve Bank of Australia (RBA) influences the Australian Dollar (AUD) by setting the level of interest rates that Australian banks can lend to each other. This influences the level of interest rates in the economy as a whole. The main goal of the RBA is to maintain a stable inflation rate of 2-3% by adjusting interest rates up or down. Relatively high interest rates compared to other major central banks support the AUD, and the opposite for relatively low. The RBA can also use quantitative easing and tightening to influence credit conditions, with the former AUD-negative and the latter AUD-positive.
China is Australia’s largest trading partner so the health of the Chinese economy is a major influence on the value of the Australian Dollar (AUD). When the Chinese economy is doing well it purchases more raw materials, goods and services from Australia, lifting demand for the AUD, and pushing up its value. The opposite is the case when the Chinese economy is not growing as fast as expected. Positive or negative surprises in Chinese growth data, therefore, often have a direct impact on the Australian Dollar and its pairs.
Iron Ore is Australia’s largest export, accounting for $118 billion a year according to data from 2021, with China as its primary destination. The price of Iron Ore, therefore, can be a driver of the Australian Dollar. Generally, if the price of Iron Ore rises, AUD also goes up, as aggregate demand for the currency increases. The opposite is the case if the price of Iron Ore falls. Higher Iron Ore prices also tend to result in a greater likelihood of a positive Trade Balance for Australia, which is also positive of the AUD.
The Trade Balance, which is the difference between what a country earns from its exports versus what it pays for its imports, is another factor that can influence the value of the Australian Dollar. If Australia produces highly sought after exports, then its currency will gain in value purely from the surplus demand created from foreign buyers seeking to purchase its exports versus what it spends to purchase imports. Therefore, a positive net Trade Balance strengthens the AUD, with the opposite effect if the Trade Balance is negative.
Artigos Recomendados


