
Australian Dollar remains subdued following PMI data, eyes on Middle East conflict
- The Australian Dollar depreciates as market sentiment weakens following US attacks on Iran's three nuclear facilities.
- Australia’s Services PMI improved to 51.3 in June from 50.6 prior, while the Composite PMI increased to 51.2 from 50.5.
- Fed Governor Christopher Waller said that the US central bank could start cutting interest rates as soon as next month.
The Australian Dollar (AUD) depreciated against the US Dollar (USD) on Monday, extending its losses for the third successive session. The AUD/USD pair remains weaker amid dampened risk sentiment, driven by the escalating Middle East tension.
US President Donald Trump announced late Saturday that he had "obliterated" Iran's three nuclear facilities, including Fordow, Natanz, and Isfahan, in strikes overnight, in coordination with an Israeli assault. Iranian parliament approved a measure to close the strait. Iran has threatened to close the strait in the past but has never followed through on the move, per Reuters.
S&P Global reported that the preliminary Australia Manufacturing Purchasing Managers Index (PMI) remained consistent at a 51.0 reading in June. Meanwhile, the Services PMI edged higher to 51.3 from the previous reading of 50.6, while the Composite PMI improved to 51.2 in June from 50.5 prior.
Australian Dollar declines due to increased risk aversion
- The US Dollar Index (DXY), which measures the value of the US Dollar against six major currencies, is losing ground and trading at around 99.600 at the time of writing.
- Federal Reserve (Fed) Governor Christopher Waller noted on Friday that the US central bank could start easing monetary policy as soon as next month, signaling flexibility amid global economic uncertainty and rising geopolitical risks.
- The US Fed decided to keep the interest rate steady at 4.5% in June as widely expected. The Federal Open Market Committee (FOMC) still sees around 50 basis points of interest rate cuts through the end of 2025. However, Fed Chair Jerome Powell warned that ongoing policy uncertainty will keep the Fed in a rate-hold stance, and any rate cuts will be contingent on further improvement in labor and inflation data.
- The People’s Bank of China (PBOC) decided to leave its Loan Prime Rates (LPRs) unchanged on Friday. The one-year and five-year LPRs were at 3.00% and 3.50%, respectively.
- China Retail Sales rose 6.4% year-over-year in May, surpassing the 5.0% expected and April’s 5.1% increase. Meanwhile, Industrial Production increased 5.8% YoY, but came in below the 5.9% forecast and 6.1% prior.
- Moreover, the National Bureau of Statistics (NBS) in China noted that the domestic economy is expected to have remained generally stable for the first half (H1) of 2025. However, economic growth in China may struggle since the second quarter due to uncertain trade policies.
- Australian Bureau of Statistics reported on Thursday that Employment Change fell by 2.5K in May against an 87.6K increase in April (revised from 89K) and the consensus forecast of a 25K rise. Furthermore, the Unemployment Rate steadied at 4.1% in May, as expected.
Australian Dollar moves below 50-day EMA near 0.6500
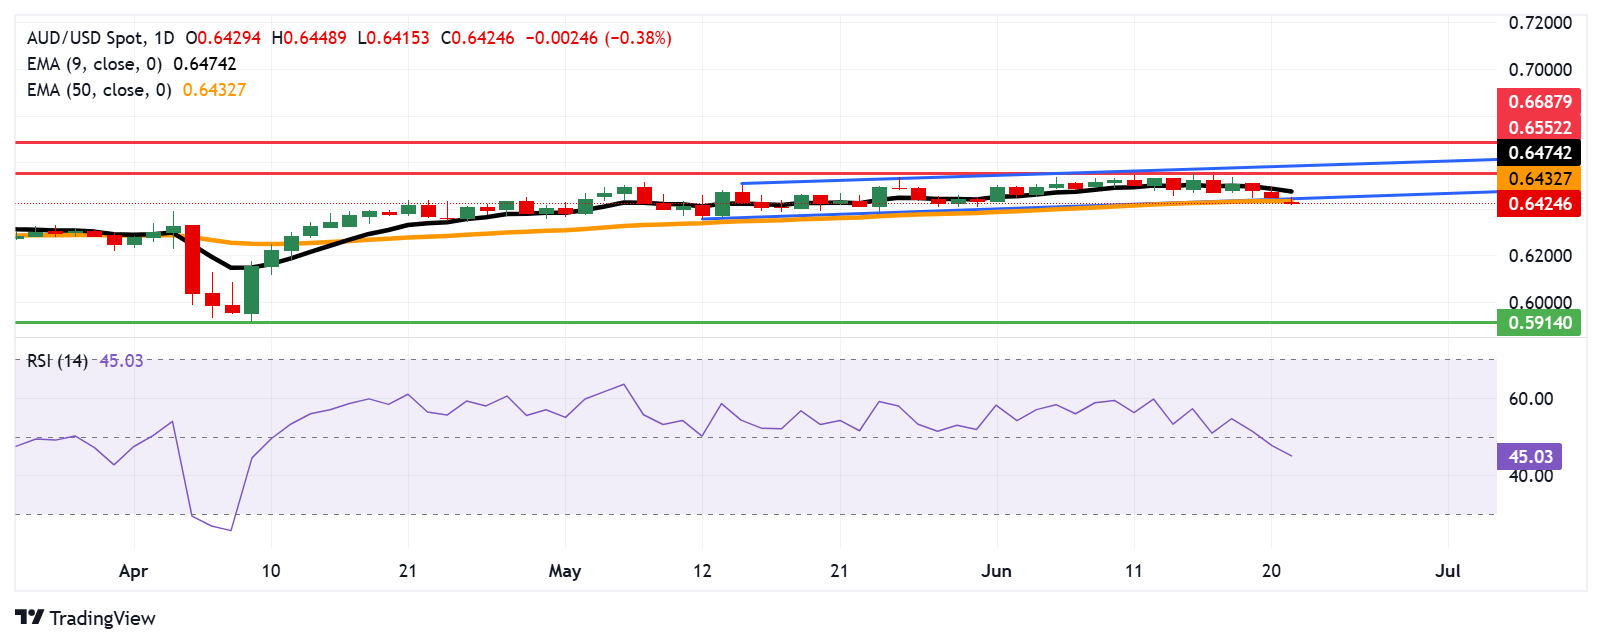
AUD/USD is trading around 0.6430 on Monday. The technical analysis of the daily shows the pair has broken below the ascending channel pattern, which could cause the emergence of a bearish bias. Additionally, the 14-day Relative Strength Index (RSI) has moved below the 50 mark, strengthening the bearish bias. The pair is falling below the nine-day Exponential Moving Average (EMA), indicating that short-term price momentum is weaker.
On the downside, the AUD/USD pair may test the “throwback support” around the psychological level of 0.6400. A break below this level may prompt the pair to navigate the region around 0.5914, the lowest level since March 2020.
The primary barrier appears at the 50-day EMA of 0.6432, followed by the lower boundary of the ascending channel around 0.6450. A successful rebound to the channel would revive the bullish bias and support the pair to test the nine-day EMA at 0.6474. A break above this level would reinforce the bullish sentiment and lead the AUD/USD pair to approach the seven-month high of 0.6552, which was recorded on June 16.
AUD/USD: Daily Chart
Australian Dollar PRICE Today
The table below shows the percentage change of Australian Dollar (AUD) against listed major currencies today. Australian Dollar was the weakest against the Euro.
| USD | EUR | GBP | JPY | CAD | AUD | NZD | CHF | |
|---|---|---|---|---|---|---|---|---|
| USD | -0.36% | -0.20% | -0.13% | -0.01% | 0.06% | -0.00% | 0.09% | |
| EUR | 0.36% | 0.13% | 0.27% | 0.36% | 0.38% | 0.36% | 0.42% | |
| GBP | 0.20% | -0.13% | 0.16% | 0.23% | 0.25% | 0.23% | 0.29% | |
| JPY | 0.13% | -0.27% | -0.16% | 0.10% | 0.16% | 0.18% | 0.14% | |
| CAD | 0.00% | -0.36% | -0.23% | -0.10% | 0.11% | 0.00% | 0.06% | |
| AUD | -0.06% | -0.38% | -0.25% | -0.16% | -0.11% | -0.04% | 0.04% | |
| NZD | 0.00% | -0.36% | -0.23% | -0.18% | -0.00% | 0.04% | 0.06% | |
| CHF | -0.09% | -0.42% | -0.29% | -0.14% | -0.06% | -0.04% | -0.06% |
The heat map shows percentage changes of major currencies against each other. The base currency is picked from the left column, while the quote currency is picked from the top row. For example, if you pick the Australian Dollar from the left column and move along the horizontal line to the US Dollar, the percentage change displayed in the box will represent AUD (base)/USD (quote).
Economic Indicator
S&P Global Composite PMI
The Composite Purchasing Managers Index (PMI), released on a monthly basis by S&P Global, is a leading indicator gauging private-business activity in Australia for both the manufacturing and services sectors. The data is derived from surveys to senior executives. Each response is weighted according to the size of the company and its contribution to total manufacturing or services output accounted for by the sub-sector to which that company belongs. Survey responses reflect the change, if any, in the current month compared to the previous month and can anticipate changing trends in official data series such as Gross Domestic Product (GDP), industrial production, employment and inflation. The index varies between 0 and 100, with levels of 50.0 signaling no change over the previous month. A reading above 50 indicates that the Australian private economy is generally expanding, a bullish sign for the Australian Dollar (AUD). Meanwhile, a reading below 50 signals that activity is generally declining, which is seen as bearish for AUD.
Read more.Last release: Sun Jun 22, 2025 23:00 (Prel)
Frequency: Monthly
Actual: 51.2
Consensus: -
Previous: 50.5
Source: S&P Global
추천 기사


