
Gold price dives to two-week low as US-China trade deal hopes undermine safe-haven demand
- Gold price extends its downtrend for the third straight day amid a combination of factors.
- Signs of easing US-China tensions and a modest USD uptick weigh on the precious metal.
- Aggressive Fed rate cut bets should cap the USD and limit losses for the XAU/USD pair.
Gold price (XAU/USD) remains under some selling pressure for the third successive day and drops to a two-week low, around the $3,230-$3,229 area during the Asian session on Thursday. US President Donald Trump's remarks earlier today add to the recent optimism over the potential de-escalation of the US-China trade war and turn out to be a key factor driving flows away from the safe-haven precious metal. Furthermore, the US Dollar (USD) is looking to build on its gains registered over the past two days and exert additional downward pressure on the commodity.
The intraday downfall in the Gold price could further be attributed to some technical selling following a breakdown below the $3,265-3,260 pivotal support. Any meaningful USD appreciation, however, seems elusive amid rising bets for more aggressive policy easing by the Federal Reserve (Fed), bolstered by the surprise contraction in US GDP and signs of easing inflationary pressure. This could act as a tailwind for the non-yielding yellow metal, warranting caution before positioning for an extension of the retracement slide from the $3,500 mark, or the all-time peak.
Daily Digest Market Movers: Gold price is pressured by receding safe-haven demand and a modest USD uptick
- US President Donald Trump said earlier this Thursday there is a “very good probability we'll reach a deal with China” and added that we have "potential" trade deals with India, South Korea and Japan. The comments add to the recent optimism and further boost investors' confidence.
- The US Dollar ticks higher in reaction to Trump's remarks and drags the safe-haven Gold price lower for the third consecutive day on Thursday. A breakdown below the $3,265-$3,260 pivotal support prompts technical selling and further contributes to the intraday decline to a two-week low.
- Automatic Data Processing (ADP) reported on Wednesday that private sector employment rose by 62K in April. This marked a notable decline from the 147K increase (revised from 155K) recorded in March and also missed the market expectation for a reading of 108,000 by a wide margin.
- Adding to this, the advance estimates by the Bureau of Economic Analysis, the US economy contracted at an annualized rate of 0.3% during the first quarter of 2025 after growing at a solid pace of 2.4% in the previous quarter. The data, in turn, revives concerns about a looming US recession.
- Meanwhile, the US Personal Consumption Expenditures (PCE) Price Index eased to the 2.3% YoY rate in March from 2.5% previous. Moreover, the core PCE Price Index, which excludes volatile food and energy prices, rose 2.6% vs. 3% in February, pointing to easing inflationary pressures.
- The dismal US macro data reaffirms bets that the Federal Reserve will resume its rate-cutting cycle in June. Traders are pricing in the possibility that the US central bank will lower borrowing costs by 100 basis points by the year-end. This should cap the USD and support the non-yielding yellow metal.
- On the geopolitical front, Kremlin spokesperson Dmitry Peskov said on Wednesday that Russia can mobilize for war on a scale comparable to the Soviet Union during World War II if necessary. Moreover, a Russian drone attack killed two civilians and injured five others in southern Ukraine.
- This might further contribute to limiting losses for the XAU/USD pair. Traders now look forward to key US macro releases – the ISM Manufacturing PMI later this Thursday and the Nonfarm Payrolls report on Friday. The data will provide cues about the Fed's rate-cut path and influence the commodity.
Gold price could accelerate the corrective decline once the 50% Fibo. level, around $3,229-$3,228 is broken decisively
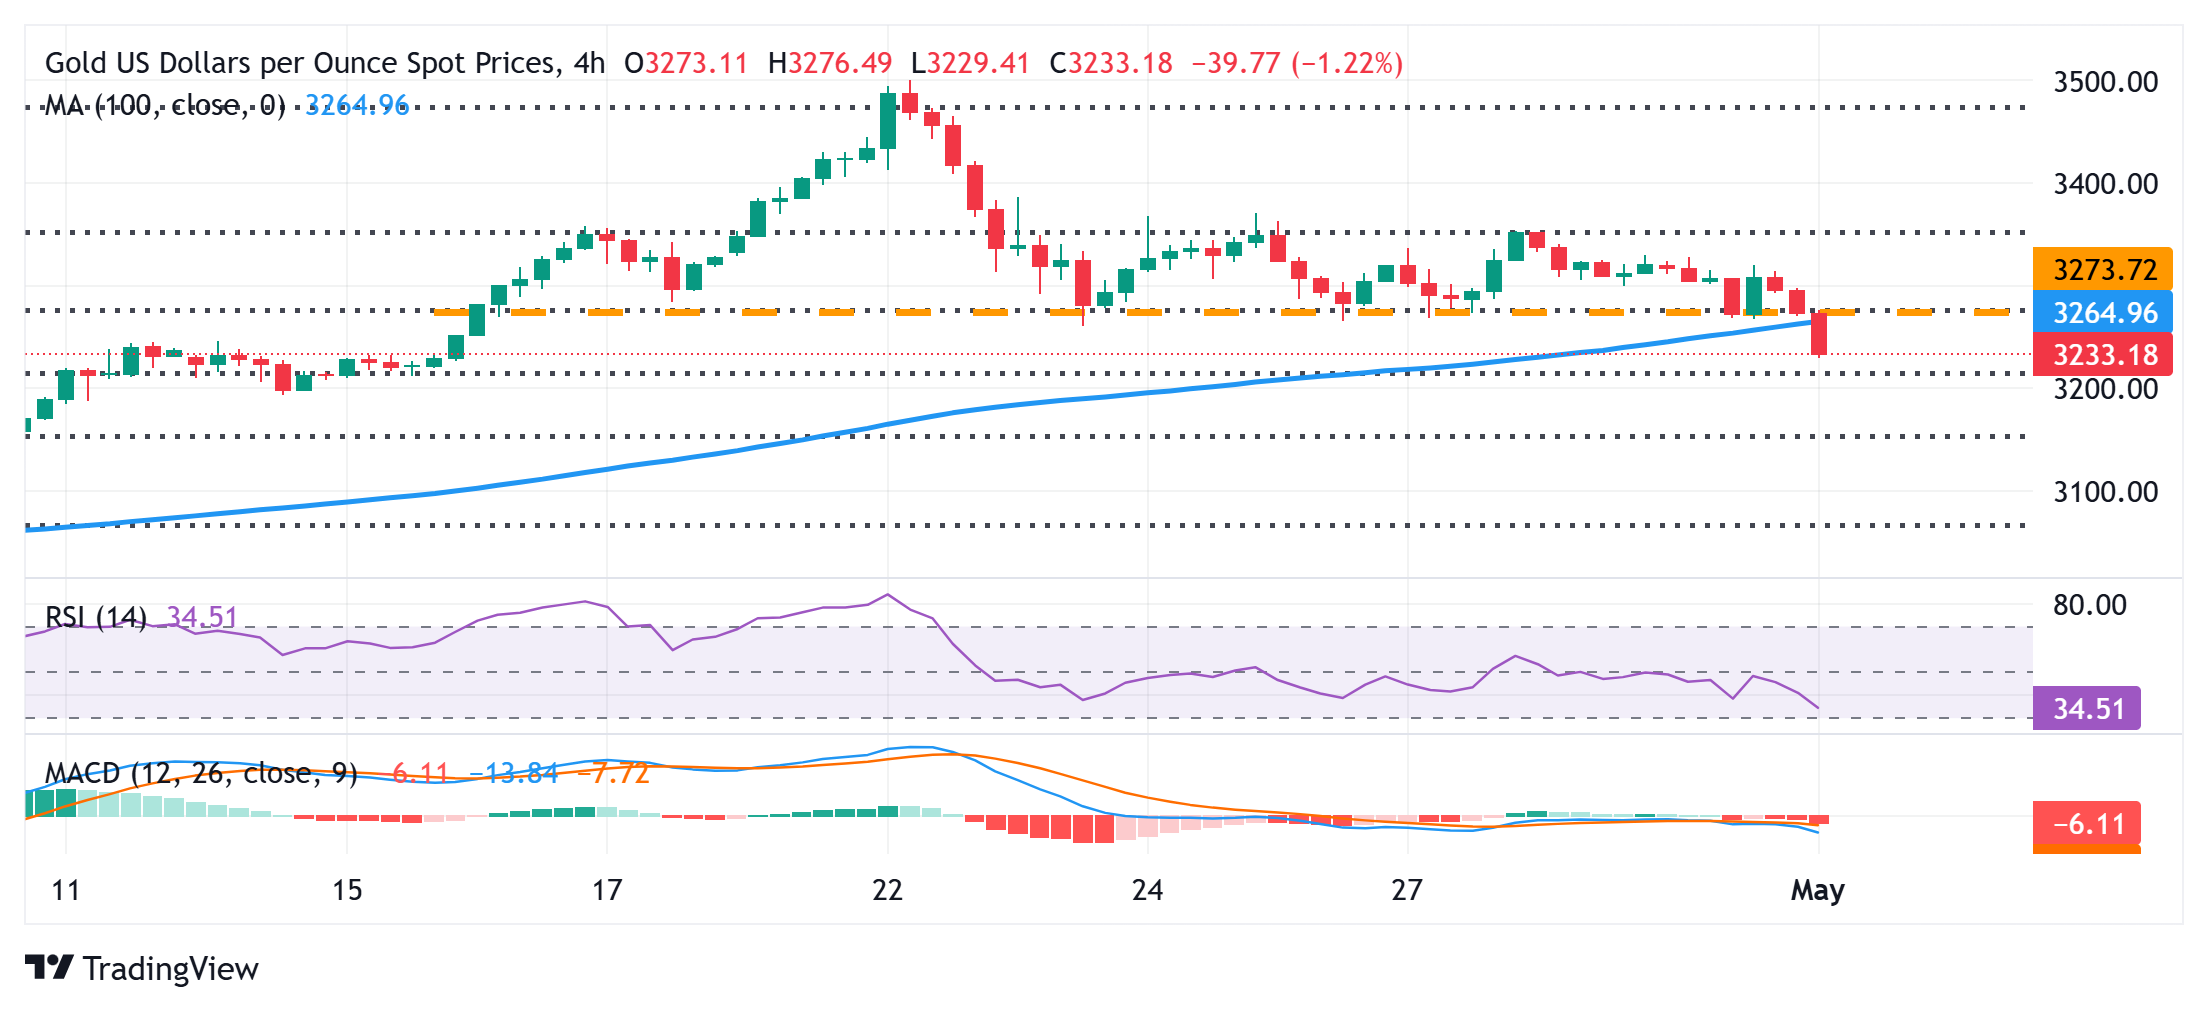
From a technical perspective, acceptance below the 38.2% Fibonacci retracement level of the latest leg up from the vicinity of mid-$2,900s or the monthly swing low, and a breakdown below the $3,265-$3,260 could be seen as a key trigger for bears. That said, oscillators on the daily chart – though they have been losing positive traction – are yet to confirm the negative outlook. Hence, it will be prudent to wait for some follow-through selling below the 50% Fibo. level, around the $3,229-$3,228 region, before positioning for further losses. The Gold price might then accelerate the decline toward the $3,200 round figure en route to the 61.8% Fibo. level, around the $3,160 zone.
On the flip side, any attempted recovery might now confront resistance near the aforementioned support breakpoint, around the $3,260-$3,265 region. This is followed by the 38.2% Fibo. level, just ahead of the $3,300 mark, which if cleared might trigger a short-covering rally and lift the Gold price to the $3,348-$3,350 supply zone. Some follow-through buying, leading to a subsequent strength beyond the $3,367-$3,368 region (23.6% Fibo. level), will suggest that the recent corrective pullback has run its course. The XAU/USD pair might then aim to reclaim the $3,400 mark and extend the momentum further toward the $3,425-3,427 intermediate hurdle before attempting to conquer the $3,500 psychological mark.
US-China Trade War FAQs
Generally speaking, a trade war is an economic conflict between two or more countries due to extreme protectionism on one end. It implies the creation of trade barriers, such as tariffs, which result in counter-barriers, escalating import costs, and hence the cost of living.
An economic conflict between the United States (US) and China began early in 2018, when President Donald Trump set trade barriers on China, claiming unfair commercial practices and intellectual property theft from the Asian giant. China took retaliatory action, imposing tariffs on multiple US goods, such as automobiles and soybeans. Tensions escalated until the two countries signed the US-China Phase One trade deal in January 2020. The agreement required structural reforms and other changes to China’s economic and trade regime and pretended to restore stability and trust between the two nations. However, the Coronavirus pandemic took the focus out of the conflict. Yet, it is worth mentioning that President Joe Biden, who took office after Trump, kept tariffs in place and even added some additional levies.
The return of Donald Trump to the White House as the 47th US President has sparked a fresh wave of tensions between the two countries. During the 2024 election campaign, Trump pledged to impose 60% tariffs on China once he returned to office, which he did on January 20, 2025. With Trump back, the US-China trade war is meant to resume where it was left, with tit-for-tat policies affecting the global economic landscape amid disruptions in global supply chains, resulting in a reduction in spending, particularly investment, and directly feeding into the Consumer Price Index inflation.
추천 기사


