
Bitcoin Weekly Forecast: BTC extends correction amid weakening momentum, ETFs outflow
- Bitcoin price is slipping below the lower consolidation band at $116,000, a decisive close below to indicate further decline ahead.
- US-listed spot Bitcoin ETFs show early signs of investor pullback, recording a mild weekly outflow of $58.64 million by Thursday.
- Technical indicators suggest weakening momentum, raising the risk of a short-term correction if bearish pressure persists.
Bitcoin (BTC) is slipping below the lower consolidation band at $116,000, after consolidating for more than ten days. A decisive close below this level would indicate further decline ahead. US-listed spot Bitcoin Exchange Traded Funds (ETFs) also supported this bearish thesis, recording a mild weekly outflow of $58.64 million until Thursday. Adding to the bearish outlook, technical indicators also signal a weakening in momentum, which raises the risk of a short-term correction.
Bitcoin spot ETFs show mild signs of weakness
SoSoValue data shows that US spot Bitcoin ETFs have recorded a mild weekly outflow of $58.64 million so far this week, breaking the six-week streak of inflows since mid-June. However, these outflow values are lower compared to the inflow seen in the last few weeks. Traders should keep a watch; if this trend continues and intensifies, the Bitcoin price could face a correction.
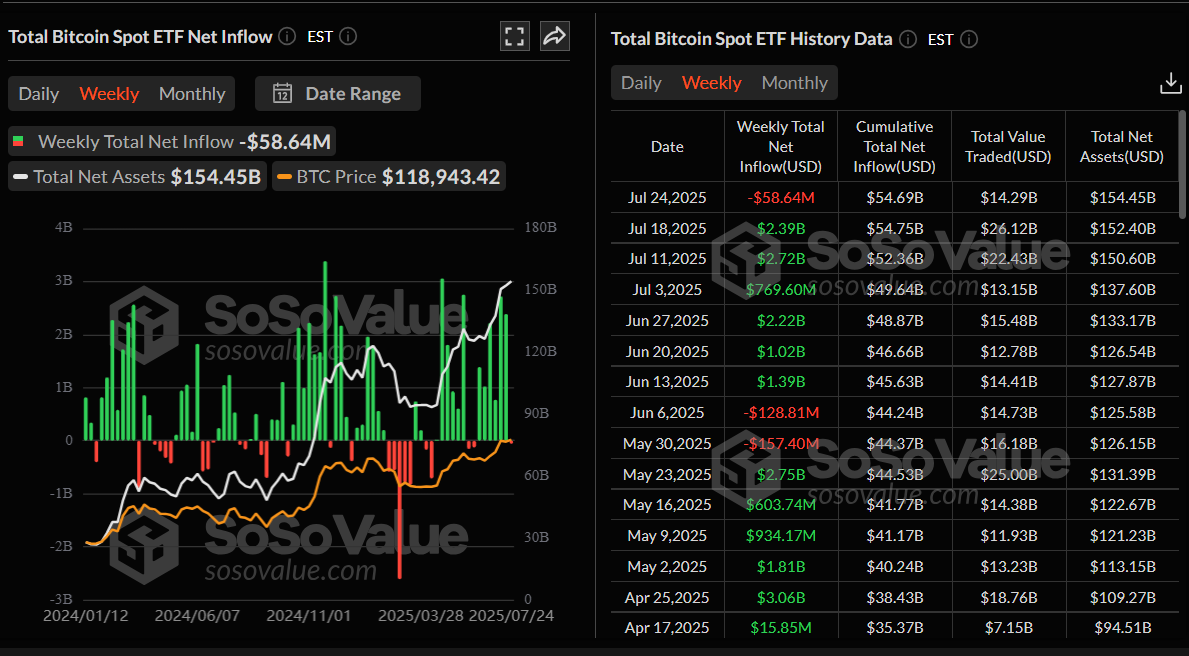
Total Bitcoin Spot ETFs weekly chart. Source: SoSoValue
Bitcoin's new short positions are open
Bitcoin price has dropped slightly so far this week, falling below $116,000 at the time of writing on Friday. CryptoQuant’s Bitcoin Open Interest (OI) at all exchanges reached a new all-time high of $44.5 billion on Friday. The rise in OI, alongside a decline in prices, suggests that new positions, typically shorts, have been opened.
Traders should be cautious as high open interest with a falling price suggests significant selling pressure, which could lead to a sudden escalation in the event of a trend reversal.
-1753435692778.png)
Bitcoin Open Interest all exchanges chart. Source: CryptoQuant
US trade deals could fuel some crypto optimism
A trade agreement between the European Union and the US could be imminent, as reported by CNBC on Thursday. However, with no guarantees, Brussels continues to prepare retaliatory measures.
“A 15% baseline tariff rate, which includes an around 4.8% duty currently in place, is currently the base-case scenario for EU imports to the U.S.,” said the report.
Moreover, earlier on Tuesday, the Trump administration reached a trade deal with Japan. The ongoing negotiations to reach agreements with trading partners could boost investors’ confidence, as US equities hit record levels on Wednesday, and could support BTC's recovery.
US macroeconomic data suggest no interest rate cut
The markets do not expect an interest rate cut from the US Federal Reserve (Fed) in July, despite US President Donald Trump’s continuous push for lower borrowing costs. Trump has been personally attacking Fed Chair Jerome Powell over his stance on holding rates and has repeatedly called for the central bank chief’s resignation.
Moreover, the data released on Thursday, “pointed to a still resilient US labor market and reinforced the view that the Federal Reserve will hold interest rates at the upcoming monetary policy meeting next week,” reported FXStreet analyst Haresh Menghani.
The analyst continued that the further details of the report revealed that employment strength across both the manufacturing and services sectors continues to support near-term stability. Adding to this, intensifying price pressures suggest that inflation could accelerate in the second half of the year, primarily due to tariffs on imports.
These economic conditions and the Fed’s tighter stances towards interest rate cuts do not bode well for risky assets such as Bitcoin.
Is BTC ready for a downturn?
The weekly chart showed a red candlestick after making a new all-time high of $123,218 and then falling slightly last week. As of this week, BTC has continued its slight decline, trading below $116,000 on Friday.
If BTC continues its pullback, it could extend its decline toward its previous all-time high of $111,980 seen in May.
The Relative Strength Index (RSI) on the weekly chart reads 65 after rejecting its overbought level of 70 last week, indicating a fading of bullish momentum.
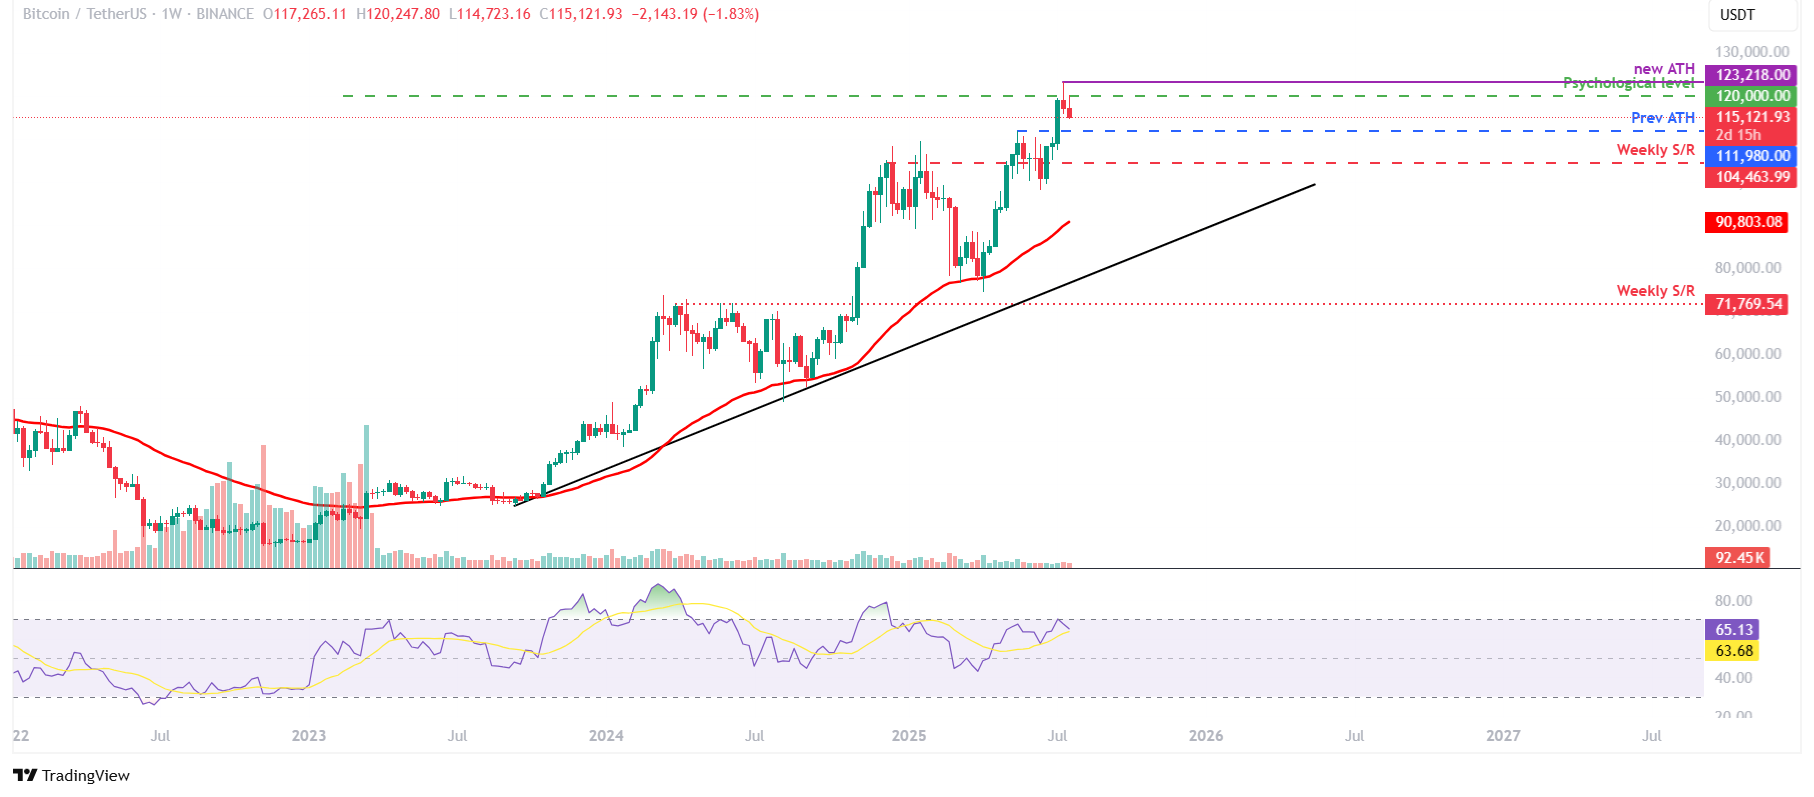
BTC/USDT weekly chart
On the daily chart, the technical outlook indicates that the Bitcoin price has been consolidating in the $116,000 to $120,000 range over the last 10 days, following a new all-time high of $123,218 reached on July 14. At the time of writing on Friday, it trades slightly down, below its lower boundary of consolidation at $116,000.
If BTC closes below $116,000 on a daily basis, it could extend the decline to retest the 50-day Exponential Moving Average (EMA) at $111,410.
The Relative Strength Index (RSI) on the daily chart reads 51, pointing downward after being rejected from its overbought condition on Tuesday, indicating fading bullish momentum. Additionally, the Moving Average Convergence Divergence (MACD) also showed a bearish crossover on Wednesday, giving sell signals and indicating a bearish momentum.
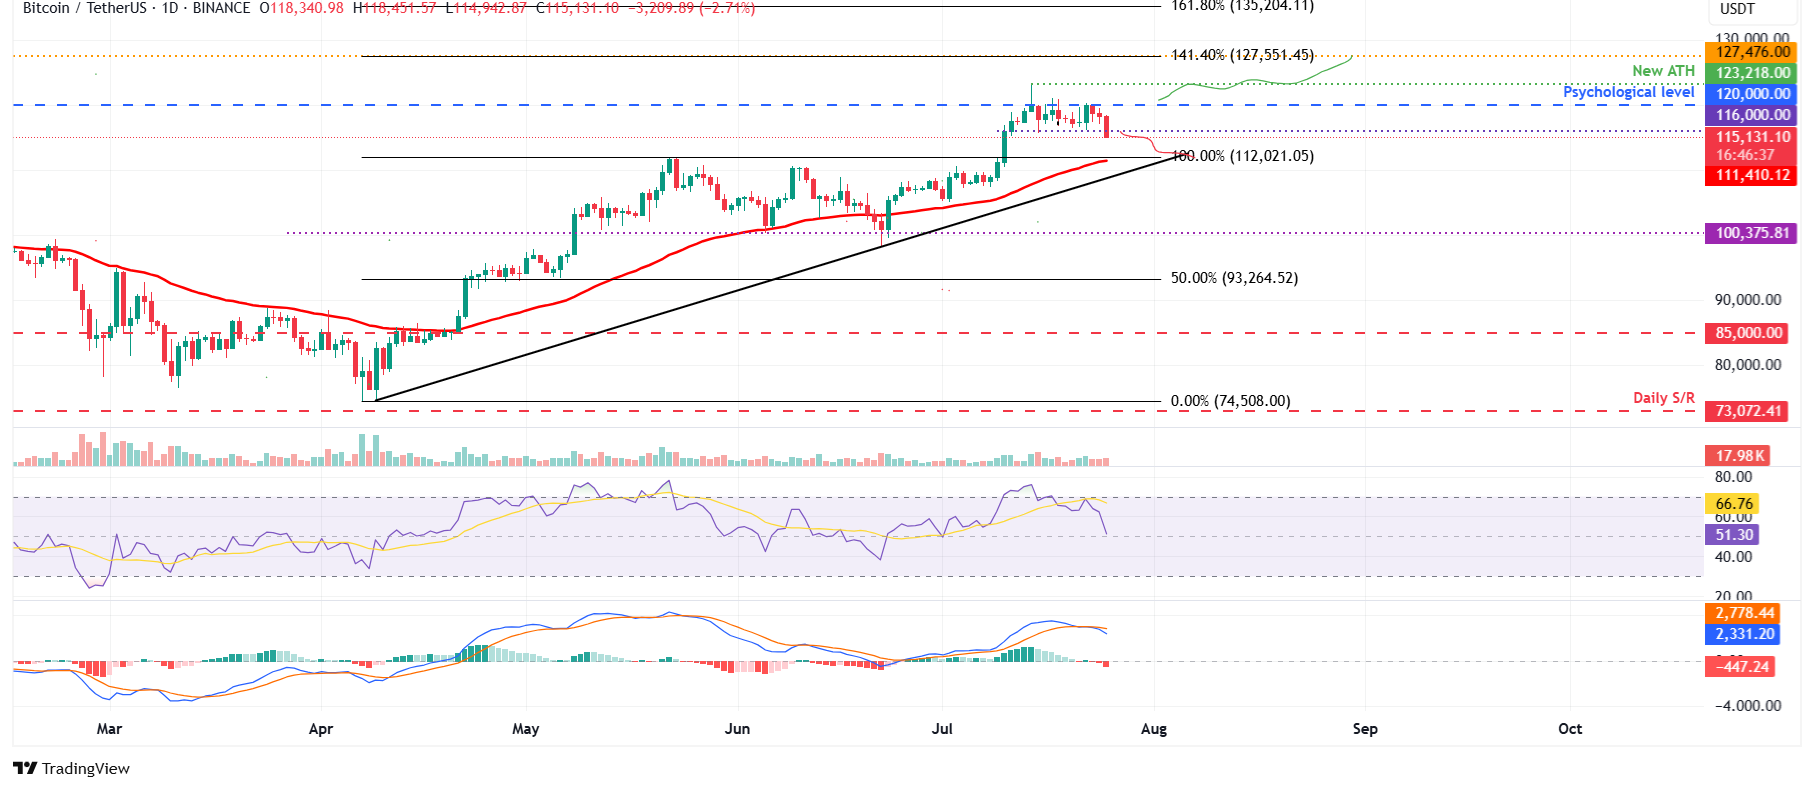
BTC/USDT daily chart
On the contrary, if BTC closes above the upper boundary of the consolidation range at $120,000 on a daily basis, it could extend the recovery toward the fresh all-time high at $123,218.
Bitcoin, altcoins, stablecoins FAQs
Bitcoin is the largest cryptocurrency by market capitalization, a virtual currency designed to serve as money. This form of payment cannot be controlled by any one person, group, or entity, which eliminates the need for third-party participation during financial transactions.
Altcoins are any cryptocurrency apart from Bitcoin, but some also regard Ethereum as a non-altcoin because it is from these two cryptocurrencies that forking happens. If this is true, then Litecoin is the first altcoin, forked from the Bitcoin protocol and, therefore, an “improved” version of it.
Stablecoins are cryptocurrencies designed to have a stable price, with their value backed by a reserve of the asset it represents. To achieve this, the value of any one stablecoin is pegged to a commodity or financial instrument, such as the US Dollar (USD), with its supply regulated by an algorithm or demand. The main goal of stablecoins is to provide an on/off-ramp for investors willing to trade and invest in cryptocurrencies. Stablecoins also allow investors to store value since cryptocurrencies, in general, are subject to volatility.
Bitcoin dominance is the ratio of Bitcoin's market capitalization to the total market capitalization of all cryptocurrencies combined. It provides a clear picture of Bitcoin’s interest among investors. A high BTC dominance typically happens before and during a bull run, in which investors resort to investing in relatively stable and high market capitalization cryptocurrency like Bitcoin. A drop in BTC dominance usually means that investors are moving their capital and/or profits to altcoins in a quest for higher returns, which usually triggers an explosion of altcoin rallies.
추천 기사


