

Hyperliquid Price Forecast: Institutional inflows fuel $70 breakout hopes
- Hyperliquid is up over 3% so far on Tuesday, approaching the $70 mark after six straight days of recovery.
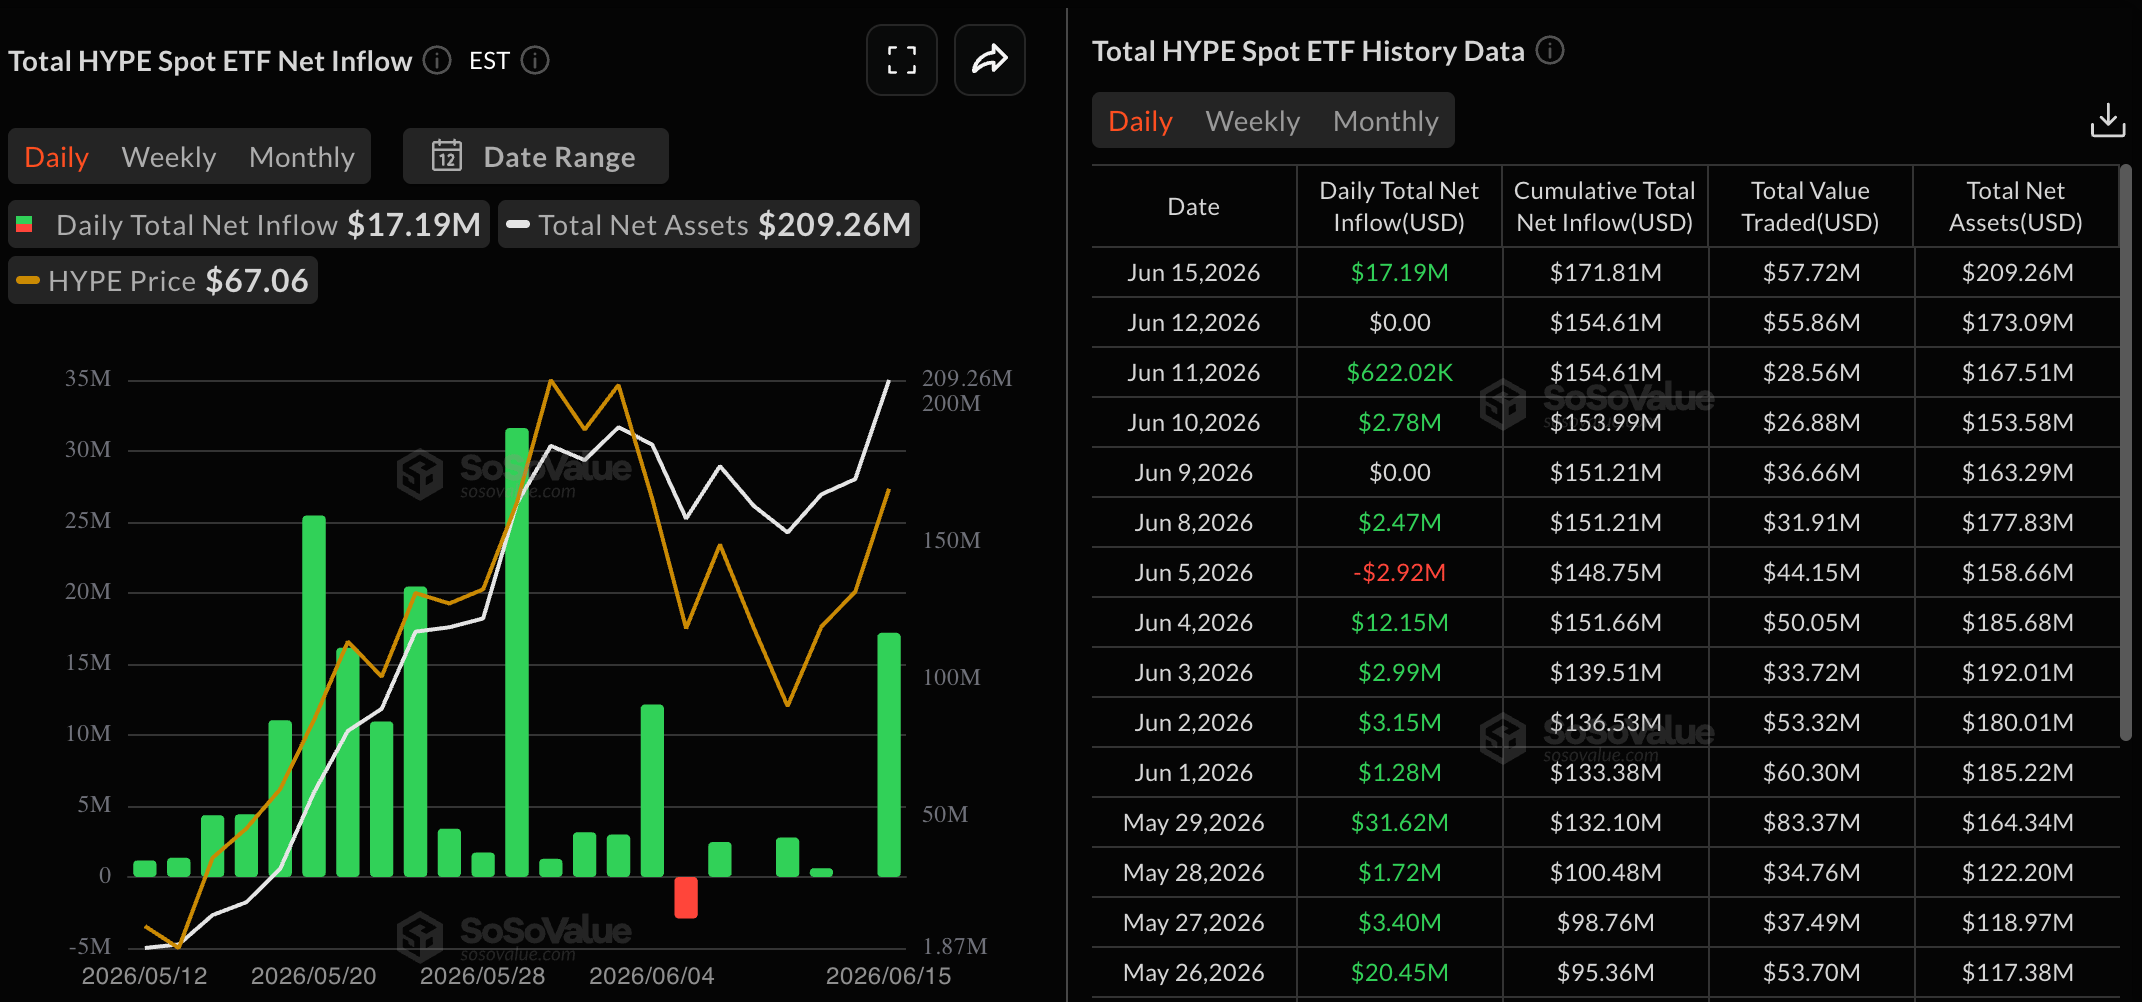
- Institutional demand for HYPE spikes higher with $17.19 million in inflows on Monday, the highest since May 29.
- The technical outlook for HYPE is bullish, suggesting a fresh phase of price discovery with a decisive close above $75.
Hyperliquid (HYPE) extends a steady upward trend on Tuesday for the sixth consecutive day, approaching its $70 mark. Recurring inflow spikes in HYPE-focused Exchange Traded Funds (ETFs) reflect consistent institutional demand for the everything exchange token.
The technical outlook for HYPE suggests further upside as bullish momentum recovers, with a move above the $75.76 record high set on June 1.
Hyperliquid retains its hype among institutions
Hyperliquid suffered a minor correction earlier this month following the exit of Arthur Hayes, which aligned with eased institutional interest. However, a fresh $17.19 million spike in inflows across HYPE-focused ETFs on Monday reflects renewed demand, the largest inflow since May 29. The total net assets held by HYPE ETFs rose to $209.26 million on Monday, from $173.09 million on Friday.
Hyperliquid’s new record of $3 billion in Real-World Asset (RWA) Open Interest on its HIP-3 reflects a steady shift in demand from traditional markets toward the decentralized platform. HIP-3 has set a new record in Open Interest every month since its launch in October 2025, fueling the institutional interest.
Technical outlook: Will HYPE cross above $75?
Hyperliquid hovers near $70, maintaining a constructive bullish bias as price holds well above the 50-day, 100-day, and 200-day Exponential Moving Averages (EMAs), which cluster between roughly $42.80 and $55.70. From a technical perspective, the V-shaped rebound in HYPE from $53.00, near last week's 50-day EMA, suggests that recent dips have been bought into, reinforcing a medium-term uptrend.
That said, the Relative Strength Index (RSI) is near 60 on the daily chart, indicating positive yet not overextended momentum, while the Moving Average Convergence Divergence (MACD) line is close to crossing above its signal line, with sharply contracting negative histograms, hinting that upside pressure is resurfacing.
On the topside, initial resistance is defined by the June 1 high at $75.76, followed by the 127.2% and 161.8% Fibonacci extension levels at about $83.63 and $94.83, respectively, measured over the $75.76 to $52.67 downswing earlier this month.
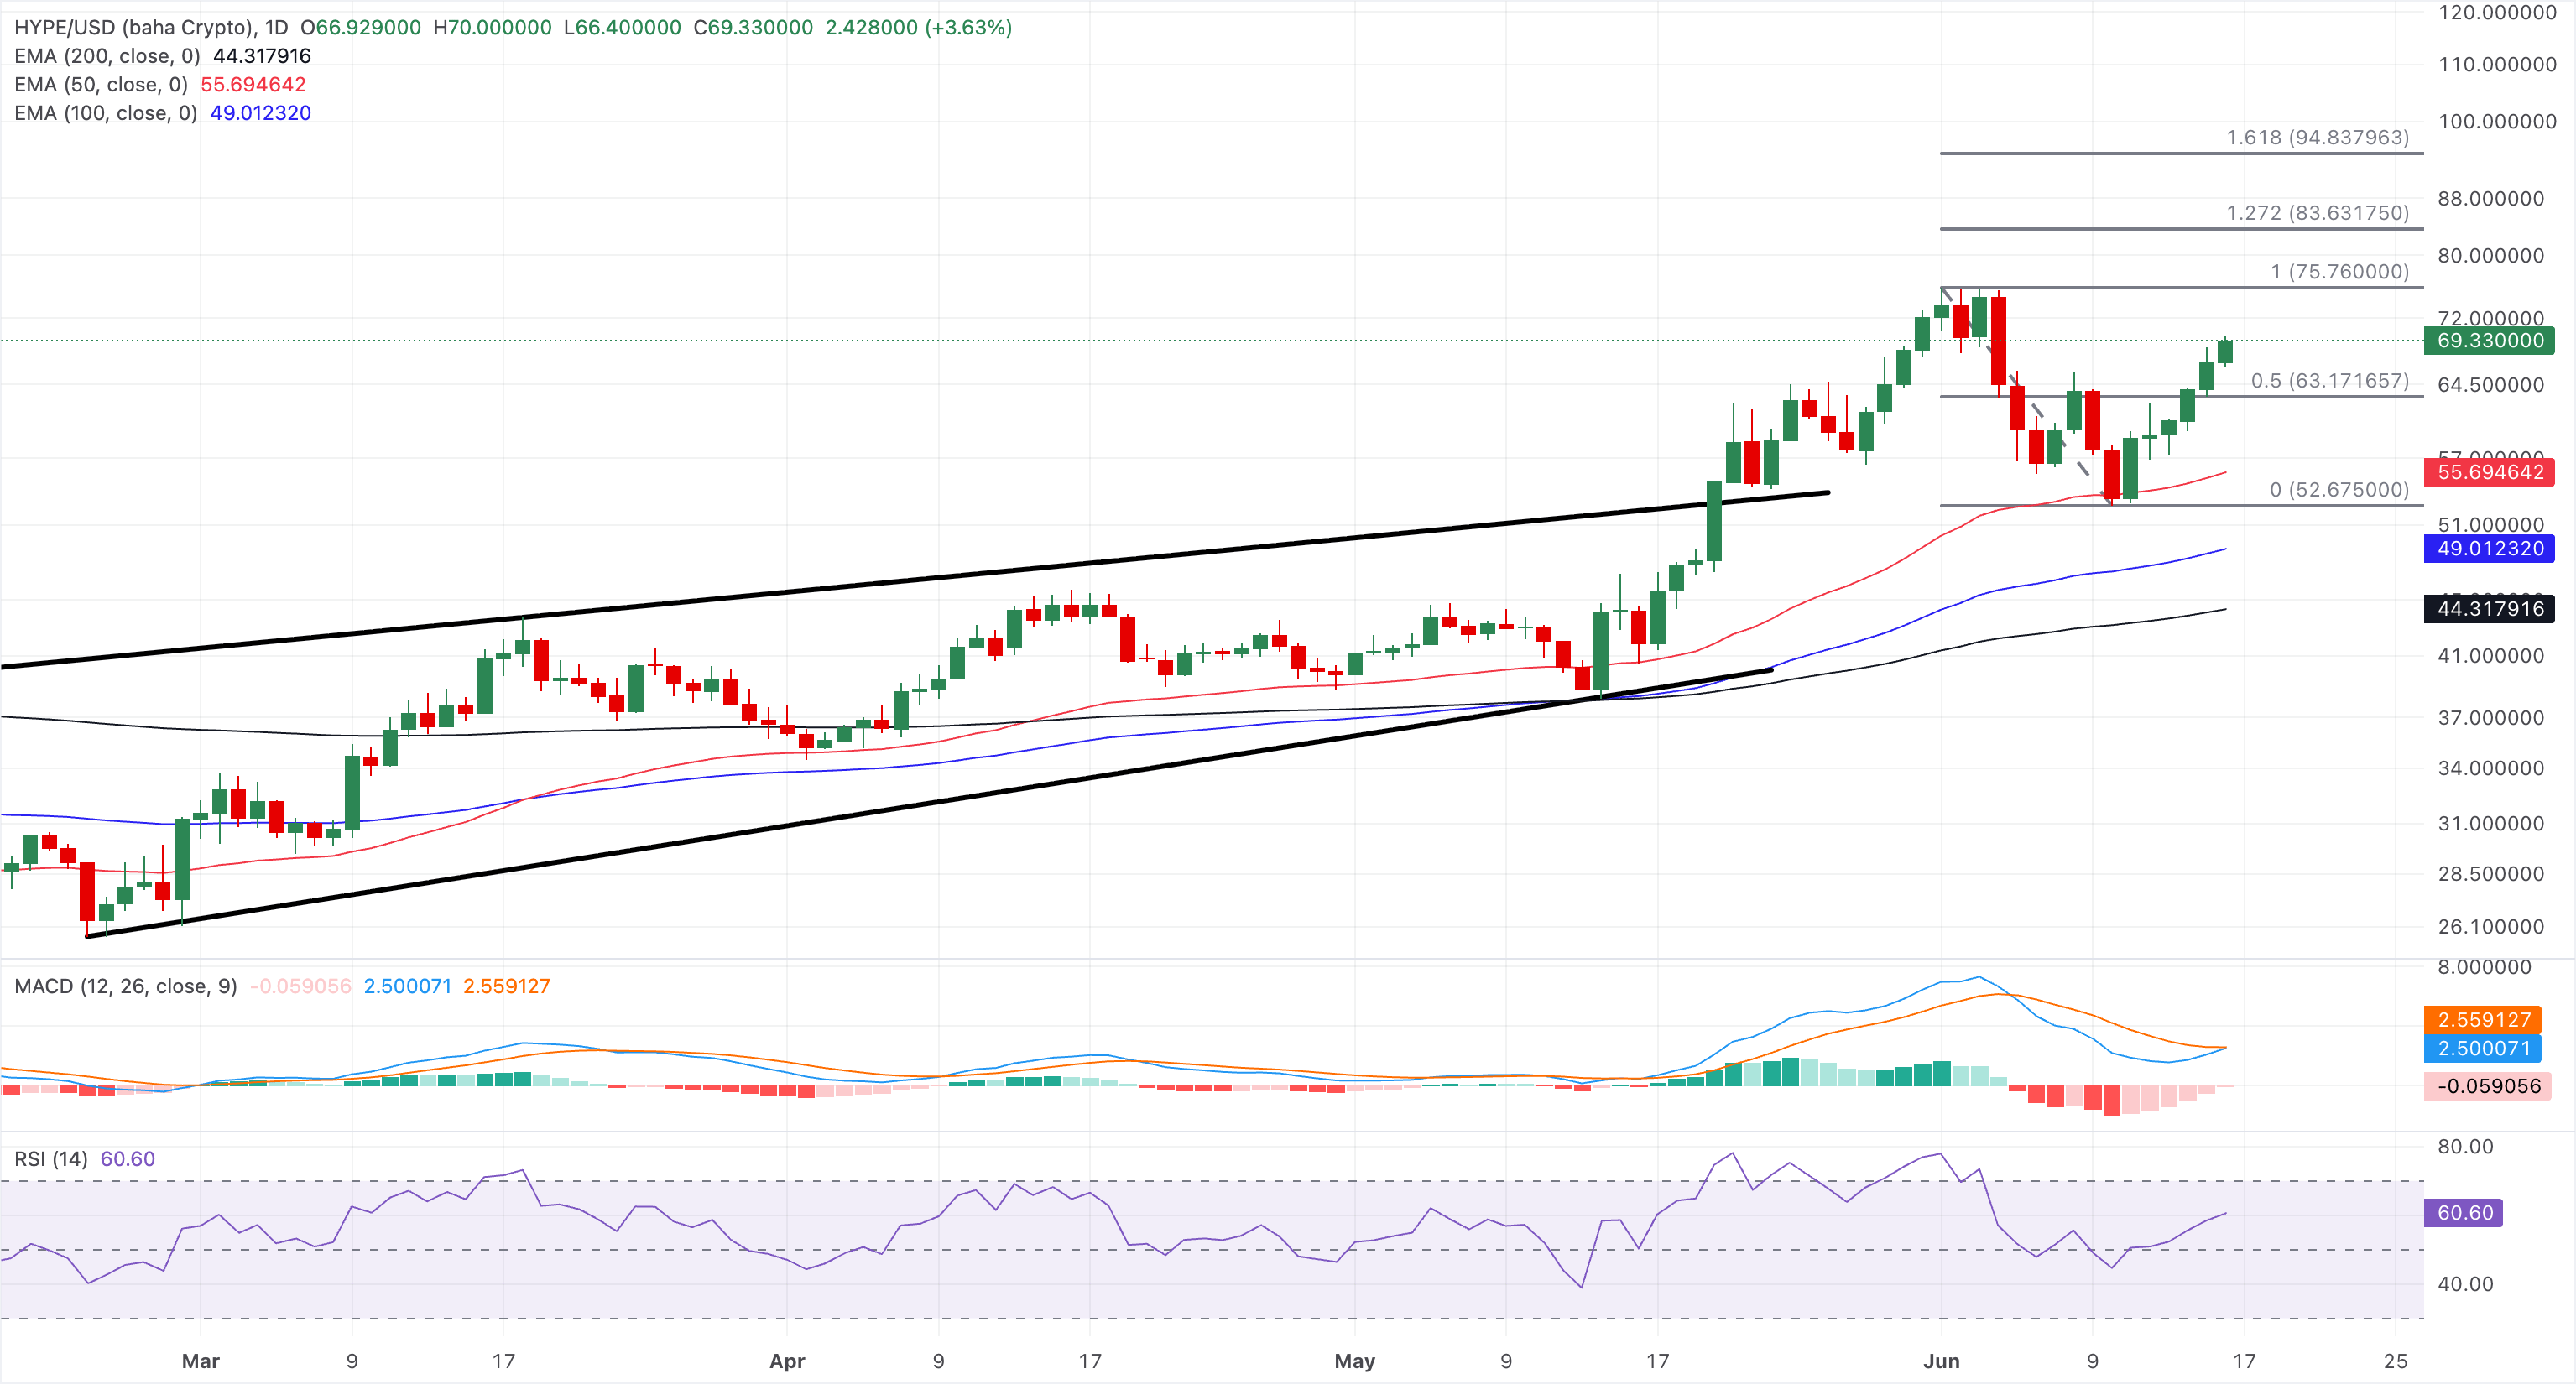
On the downside, the 50% retracement at $63.17 marks the first notable support, followed by the 50-day EMA at $55.69.
(The technical analysis of this story was written with the help of an AI tool.)
Crypto ETF FAQs
An Exchange-Traded Fund (ETF) is an investment vehicle or an index that tracks the price of an underlying asset. ETFs can not only track a single asset, but a group of assets and sectors. For example, a Bitcoin ETF tracks Bitcoin’s price. ETF is a tool used by investors to gain exposure to a certain asset.
Yes. The first Bitcoin futures ETF in the US was approved by the US Securities & Exchange Commission in October 2021. A total of seven Bitcoin futures ETFs have been approved, with more than 20 still waiting for the regulator’s permission. The SEC says that the cryptocurrency industry is new and subject to manipulation, which is why it has been delaying crypto-related futures ETFs for the last few years.
Yes. The SEC approved in January 2024 the listing and trading of several Bitcoin spot Exchange-Traded Funds, opening the door to institutional capital and mainstream investors to trade the main crypto currency. The decision was hailed by the industry as a game changer.
The main advantage of crypto ETFs is the possibility of gaining exposure to a cryptocurrency without ownership, reducing the risk and cost of holding the asset. Other pros are a lower learning curve and higher security for investors since ETFs take charge of securing the underlying asset holdings. As for the main drawbacks, the main one is that as an investor you can’t have direct ownership of the asset, or, as they say in crypto, “not your keys, not your coins.” Other disadvantages are higher costs associated with holding crypto since ETFs charge fees for active management. Finally, even though investing in ETFs reduces the risk of holding an asset, price swings in the underlying cryptocurrency are likely to be reflected in the investment vehicle too.
추천 기사


