
Ripple Price Forecast: XRP awaits record high breakout after US CPI report
- XRP trades sideways around $3.00 amid aggressive push and pull between bulls and bears.
- US CPI comes in hot at 2.9% YoY, providing challenging signals for the Fed.
- Retail demand for XRP remains steady as the futures Open Interest increases to $8.15 billion.
Ripple (XRP) edges closer to a breakout, trading around the critical $3.00 level on Thursday. The release of the United States (US) Consumer Price Index (CPI) data has triggered a spike in volatility in the broader cryptocurrency market, as investors focus on the Federal Reserve’s (Fed) interest rate decision anticipated next week.
US inflation increases as focus remains on the Fed
US consumer prices increased 0.4% MoM in August after rising 0.2% in July, according to the Bureau of Labor Statistics (BLS) report. On an annual basis, the CPI increased 2.9%, up from 2.7% posted in July. This was the highest reading since January, underscoring the impact of US President Donald Trump’s higher tariffs.
The Core CPI, which accounts for all consumer items excluding the volatile food and energy prices, rose 0.3% in August, matching the increase in July. On an annual basis, the Core CPI rose 3.1%.
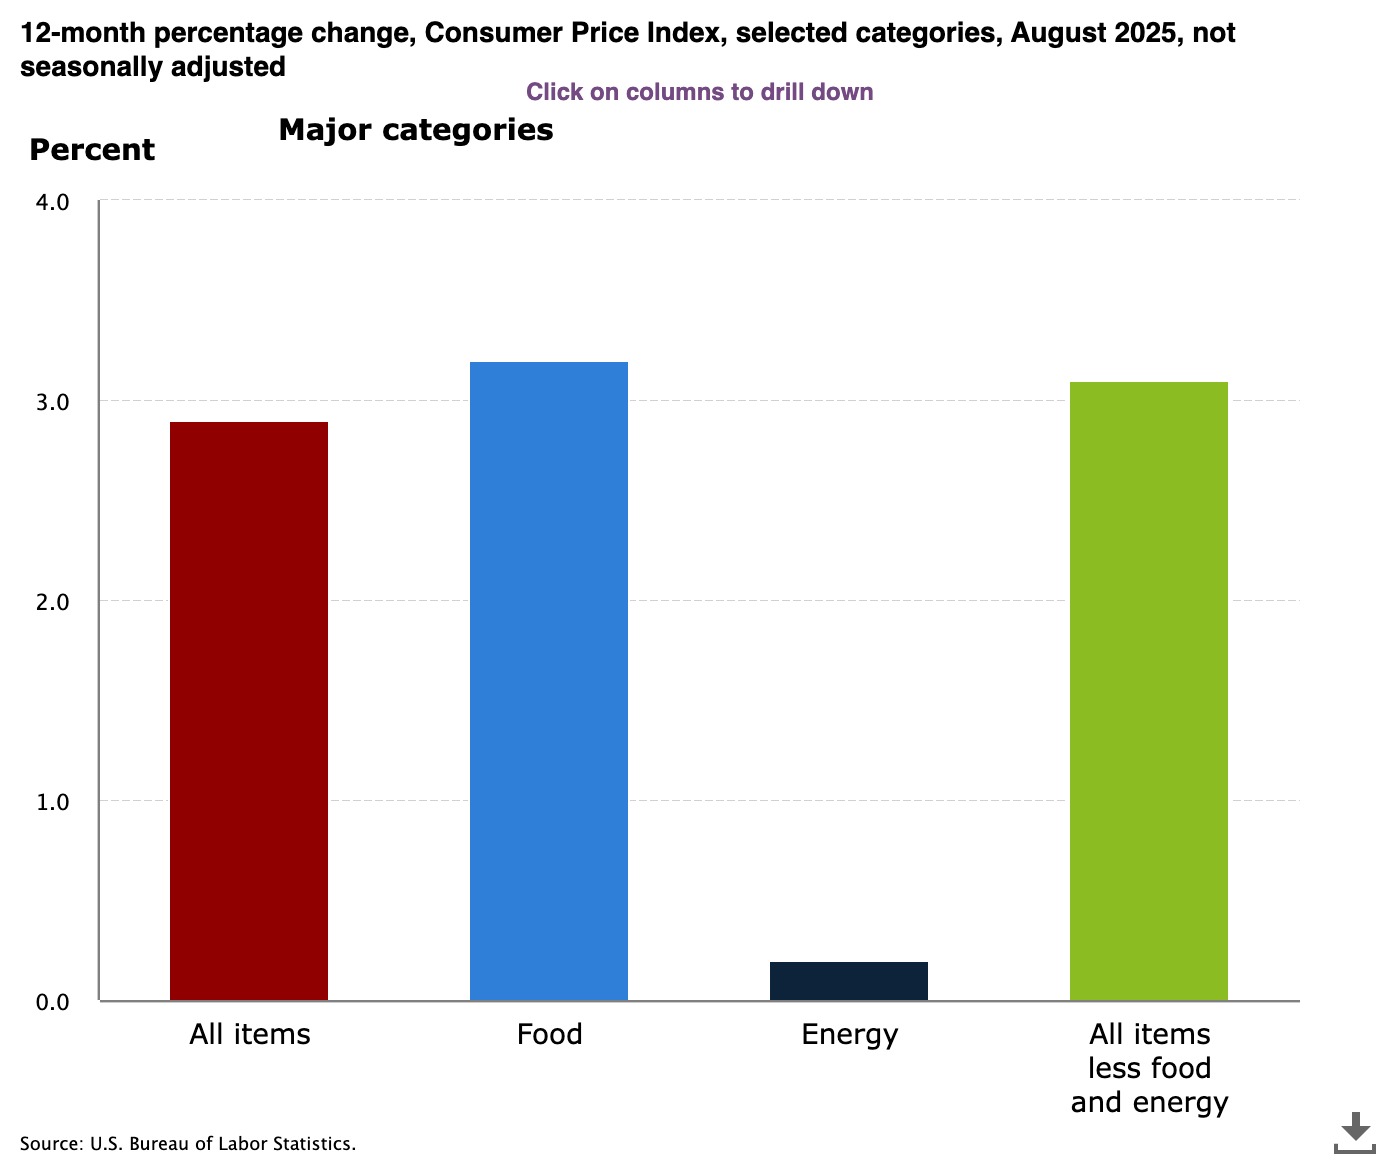
US CPI data | Source: BLS
Fed officials pay close attention to the Core CPI to better gauge long-term trends. All eyes are now on the Federal Open Market Committee (FOMC), which is expected to release its decision on interest rates next Wednesday.
Following the CPI report, expectations of a September 0.25 percentage point interest rate cut to the range of 4.00% to 4.25% dipped slightly from around 91% on Wednesday to 88.7% at the time of writing on Thursday, according to the CME Group’s FedWatch tool.
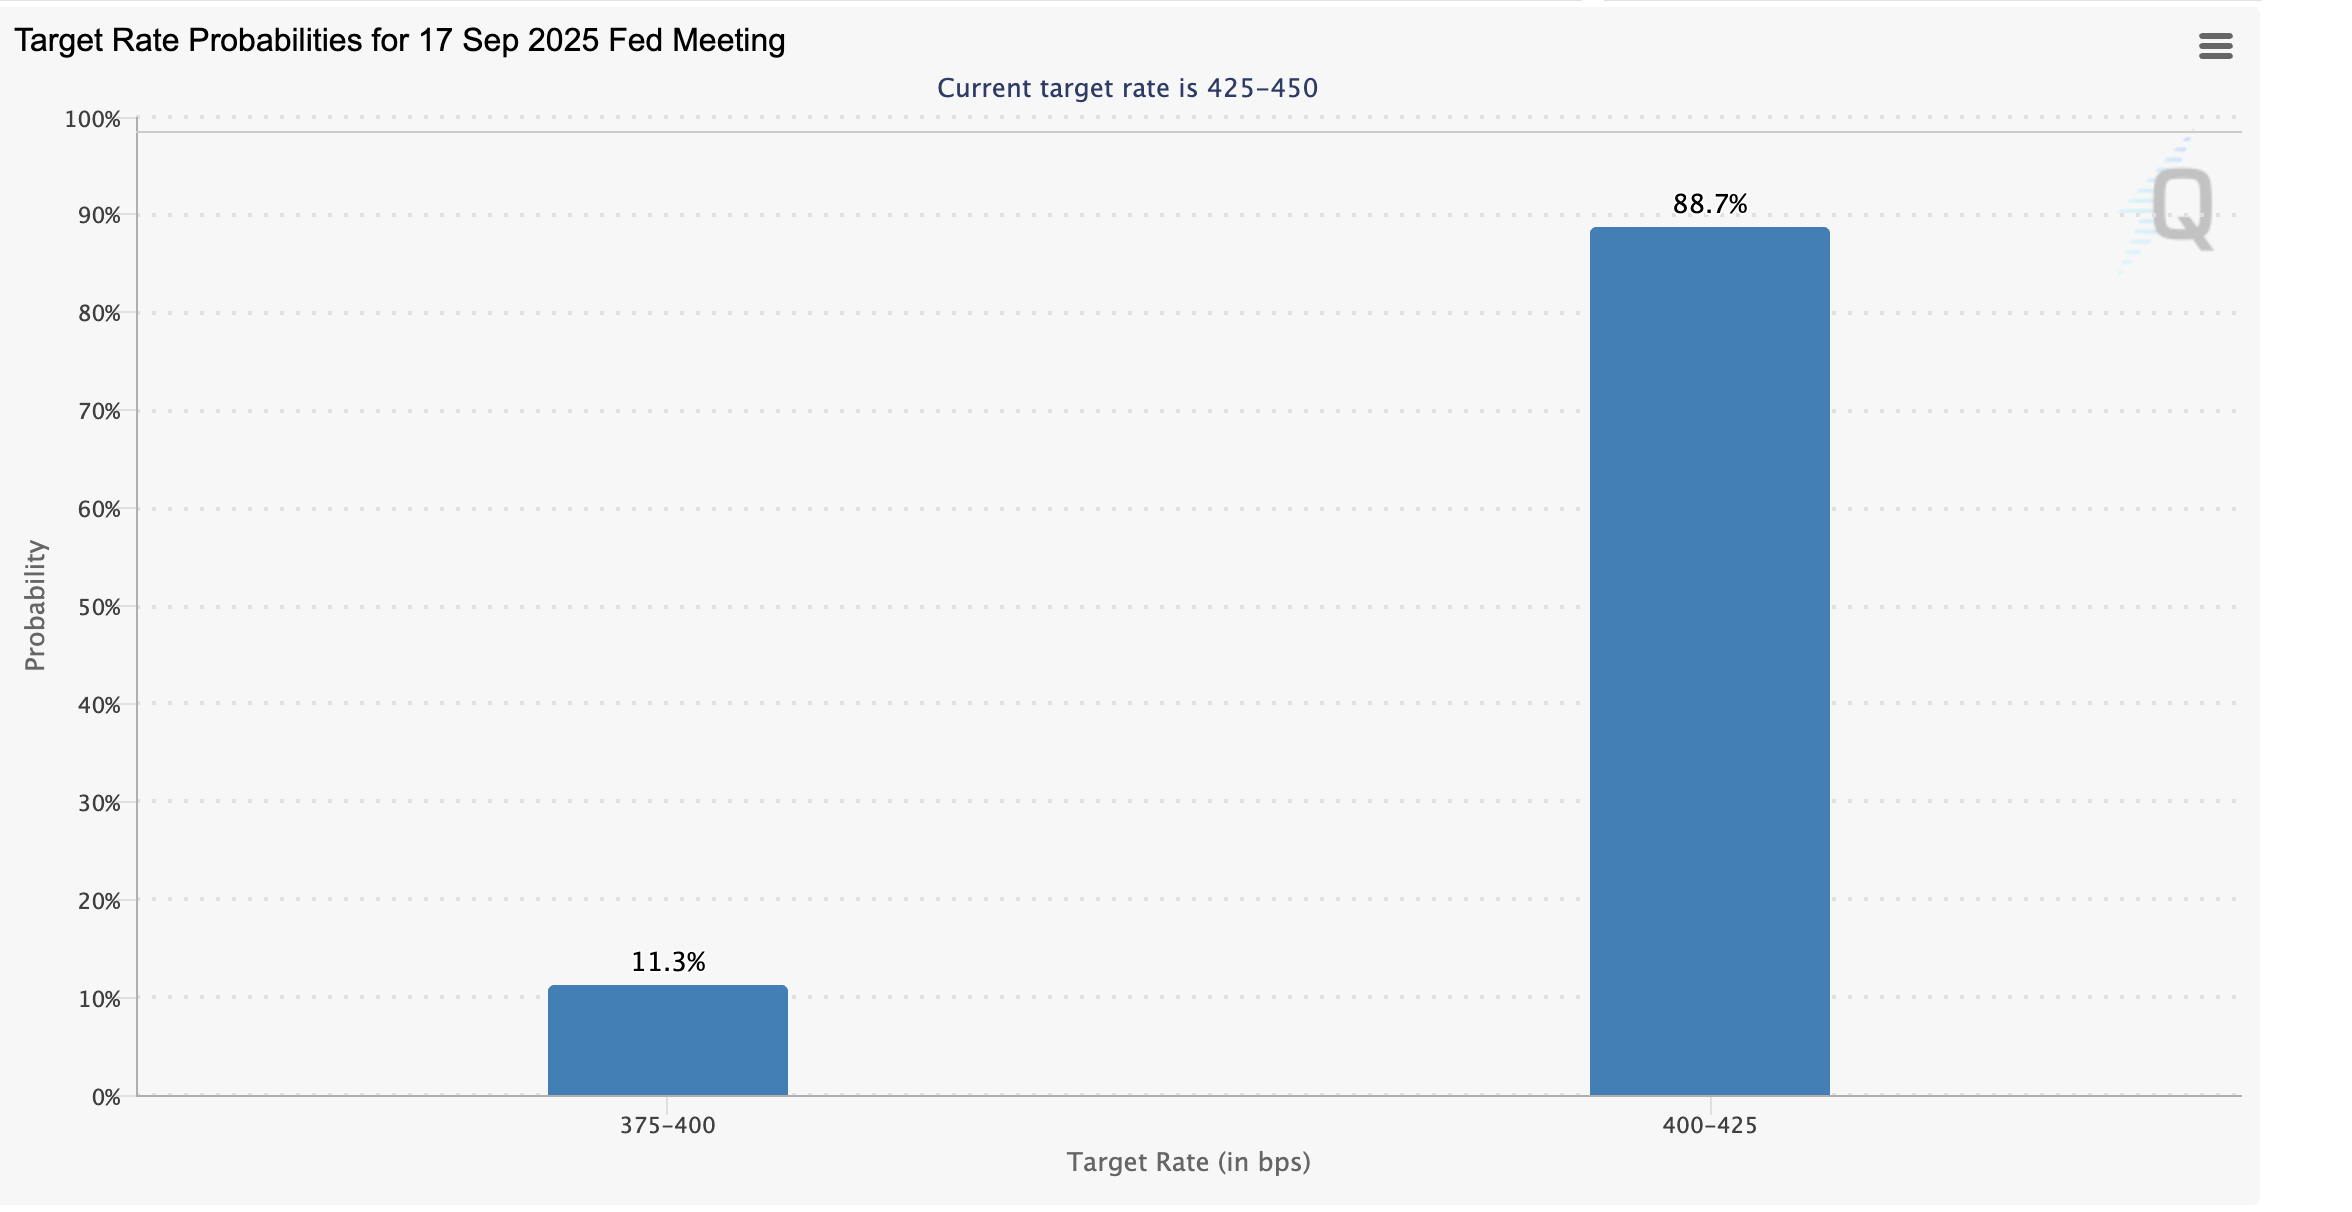
FedWatch tool | Source: CME Group
Meanwhile, retail interest in XRP remains relatively high compared to last week. CoinGlass data shows the XRP futures Open Interest (OI) averaging $8.15 billion on Thursday, up from $7.37 billion on Sunday.
The rising OI trend suggests that investors have a strong conviction in XRP’s ability to sustain its recovery to the record high of $3.66 reached on July 18.
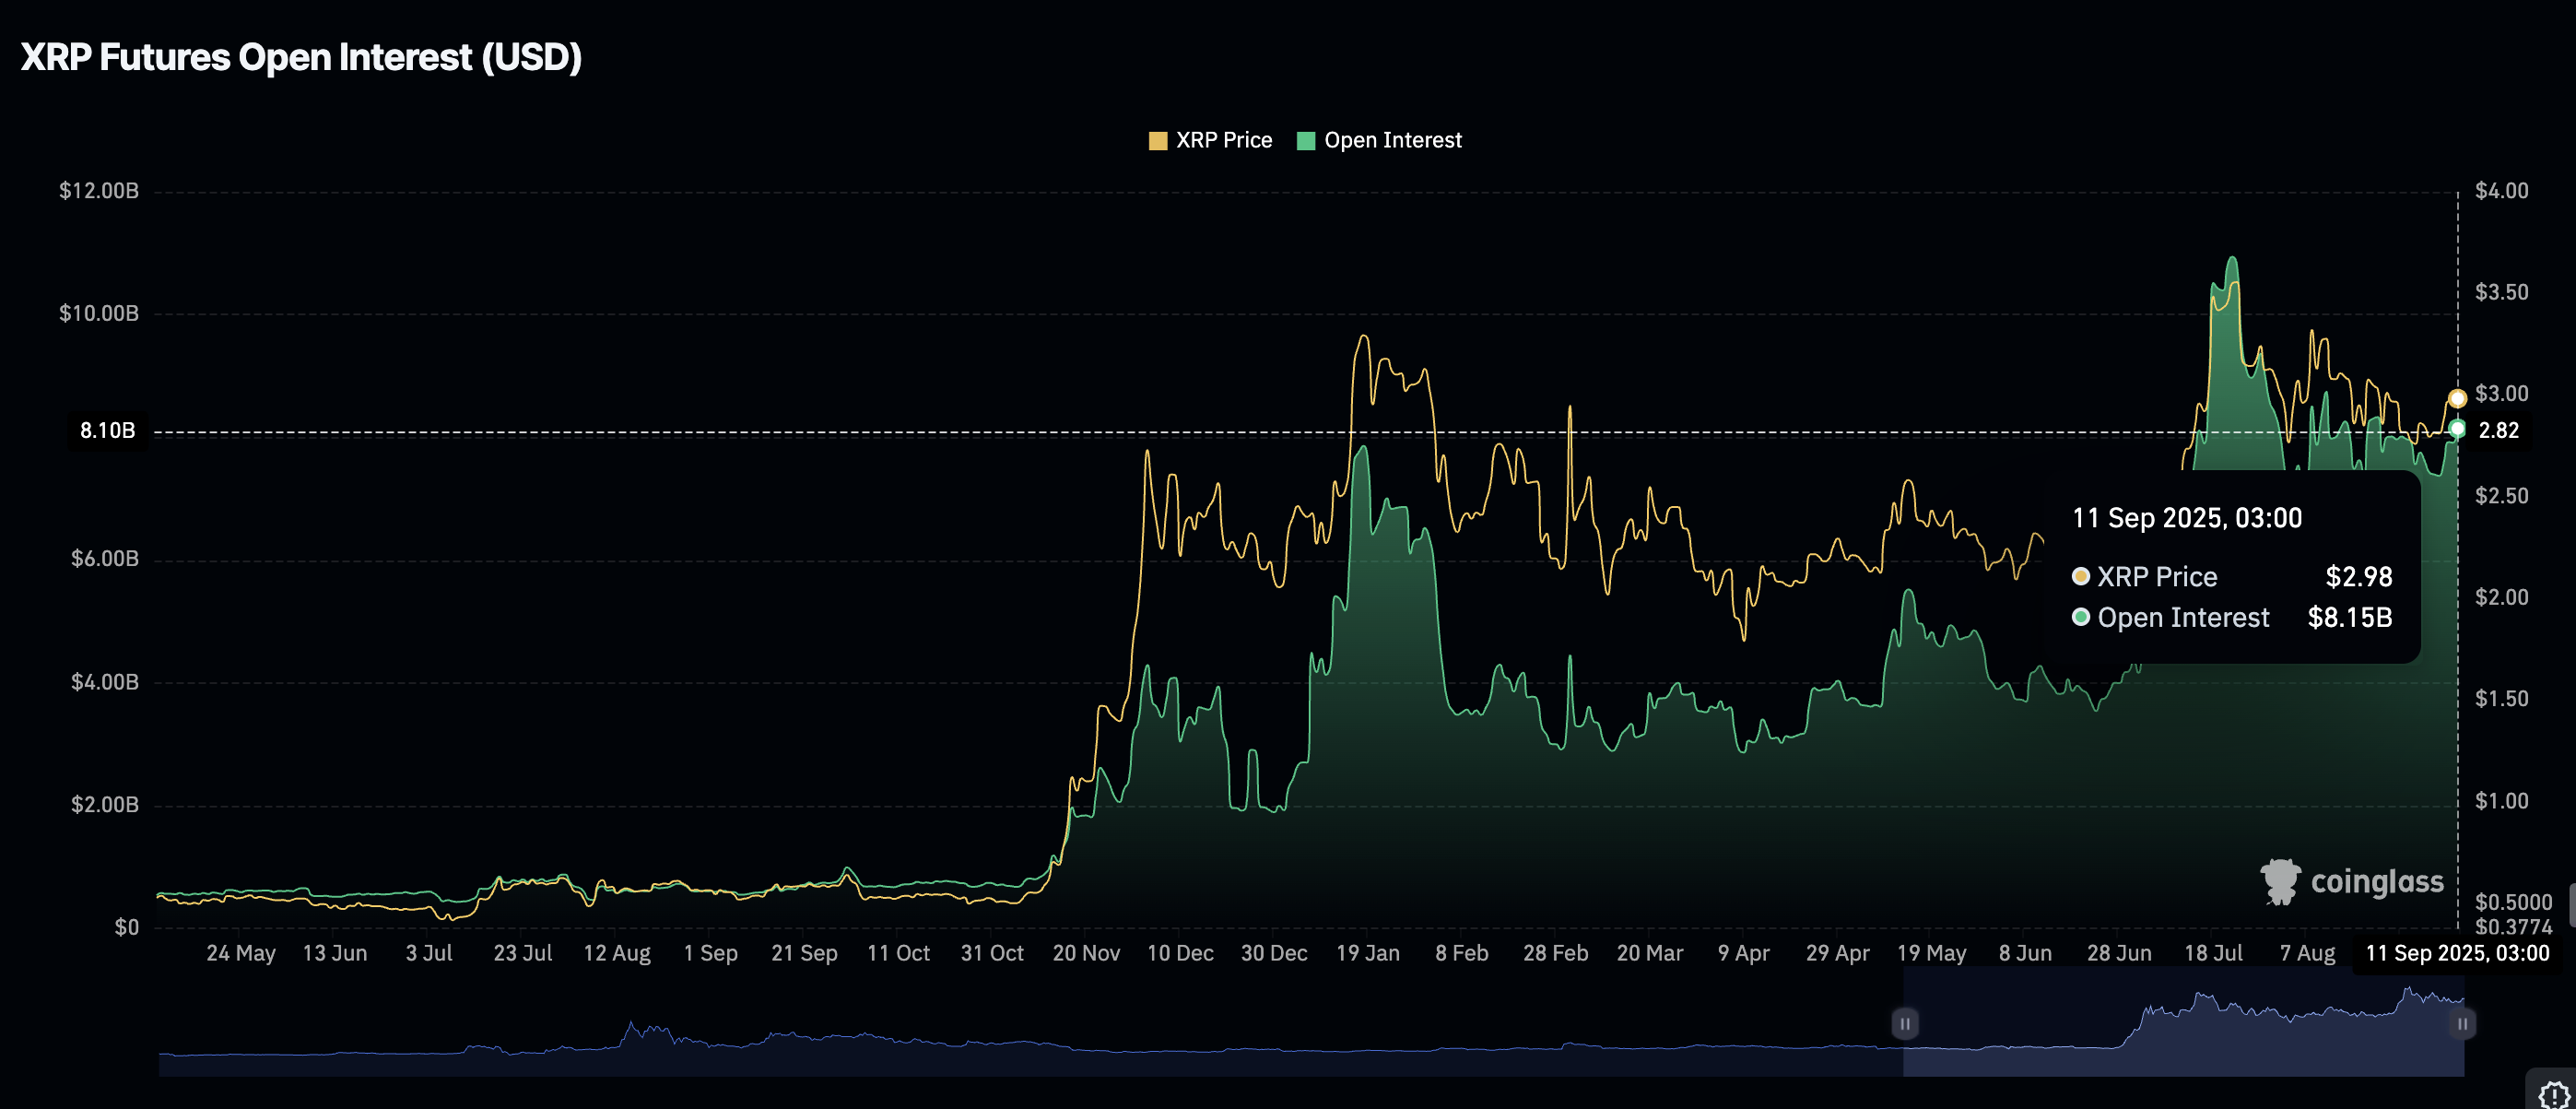
XRP Futures Open Interest | Source: CoinGlass
Technical outlook: XRP upholds bullish case ahead of breakout
XRP holds around the $3.00 pivotal level as traders quickly scope up short-term dips toward the 50-day Exponential Moving Average (EMA) at $2.91. Still, upside movement lacks the catalyst to extend the up leg toward the next hurdle at $3.35, which was previously tested in mid-August.
Despite the lack of a strong tailwind to drive XRP’s next recovery phase, its bullish case remains intact, buoyed by a buy signal maintained by the Moving Average Convergence Divergence (MACD) indicator since Monday.
Traders tend to increase their exposure with the MACD line in blue holding above the red signal line. The steady upward movement in the Relative Strength Index (RSI) at 54 indicates bullish momentum as selling pressure declines.
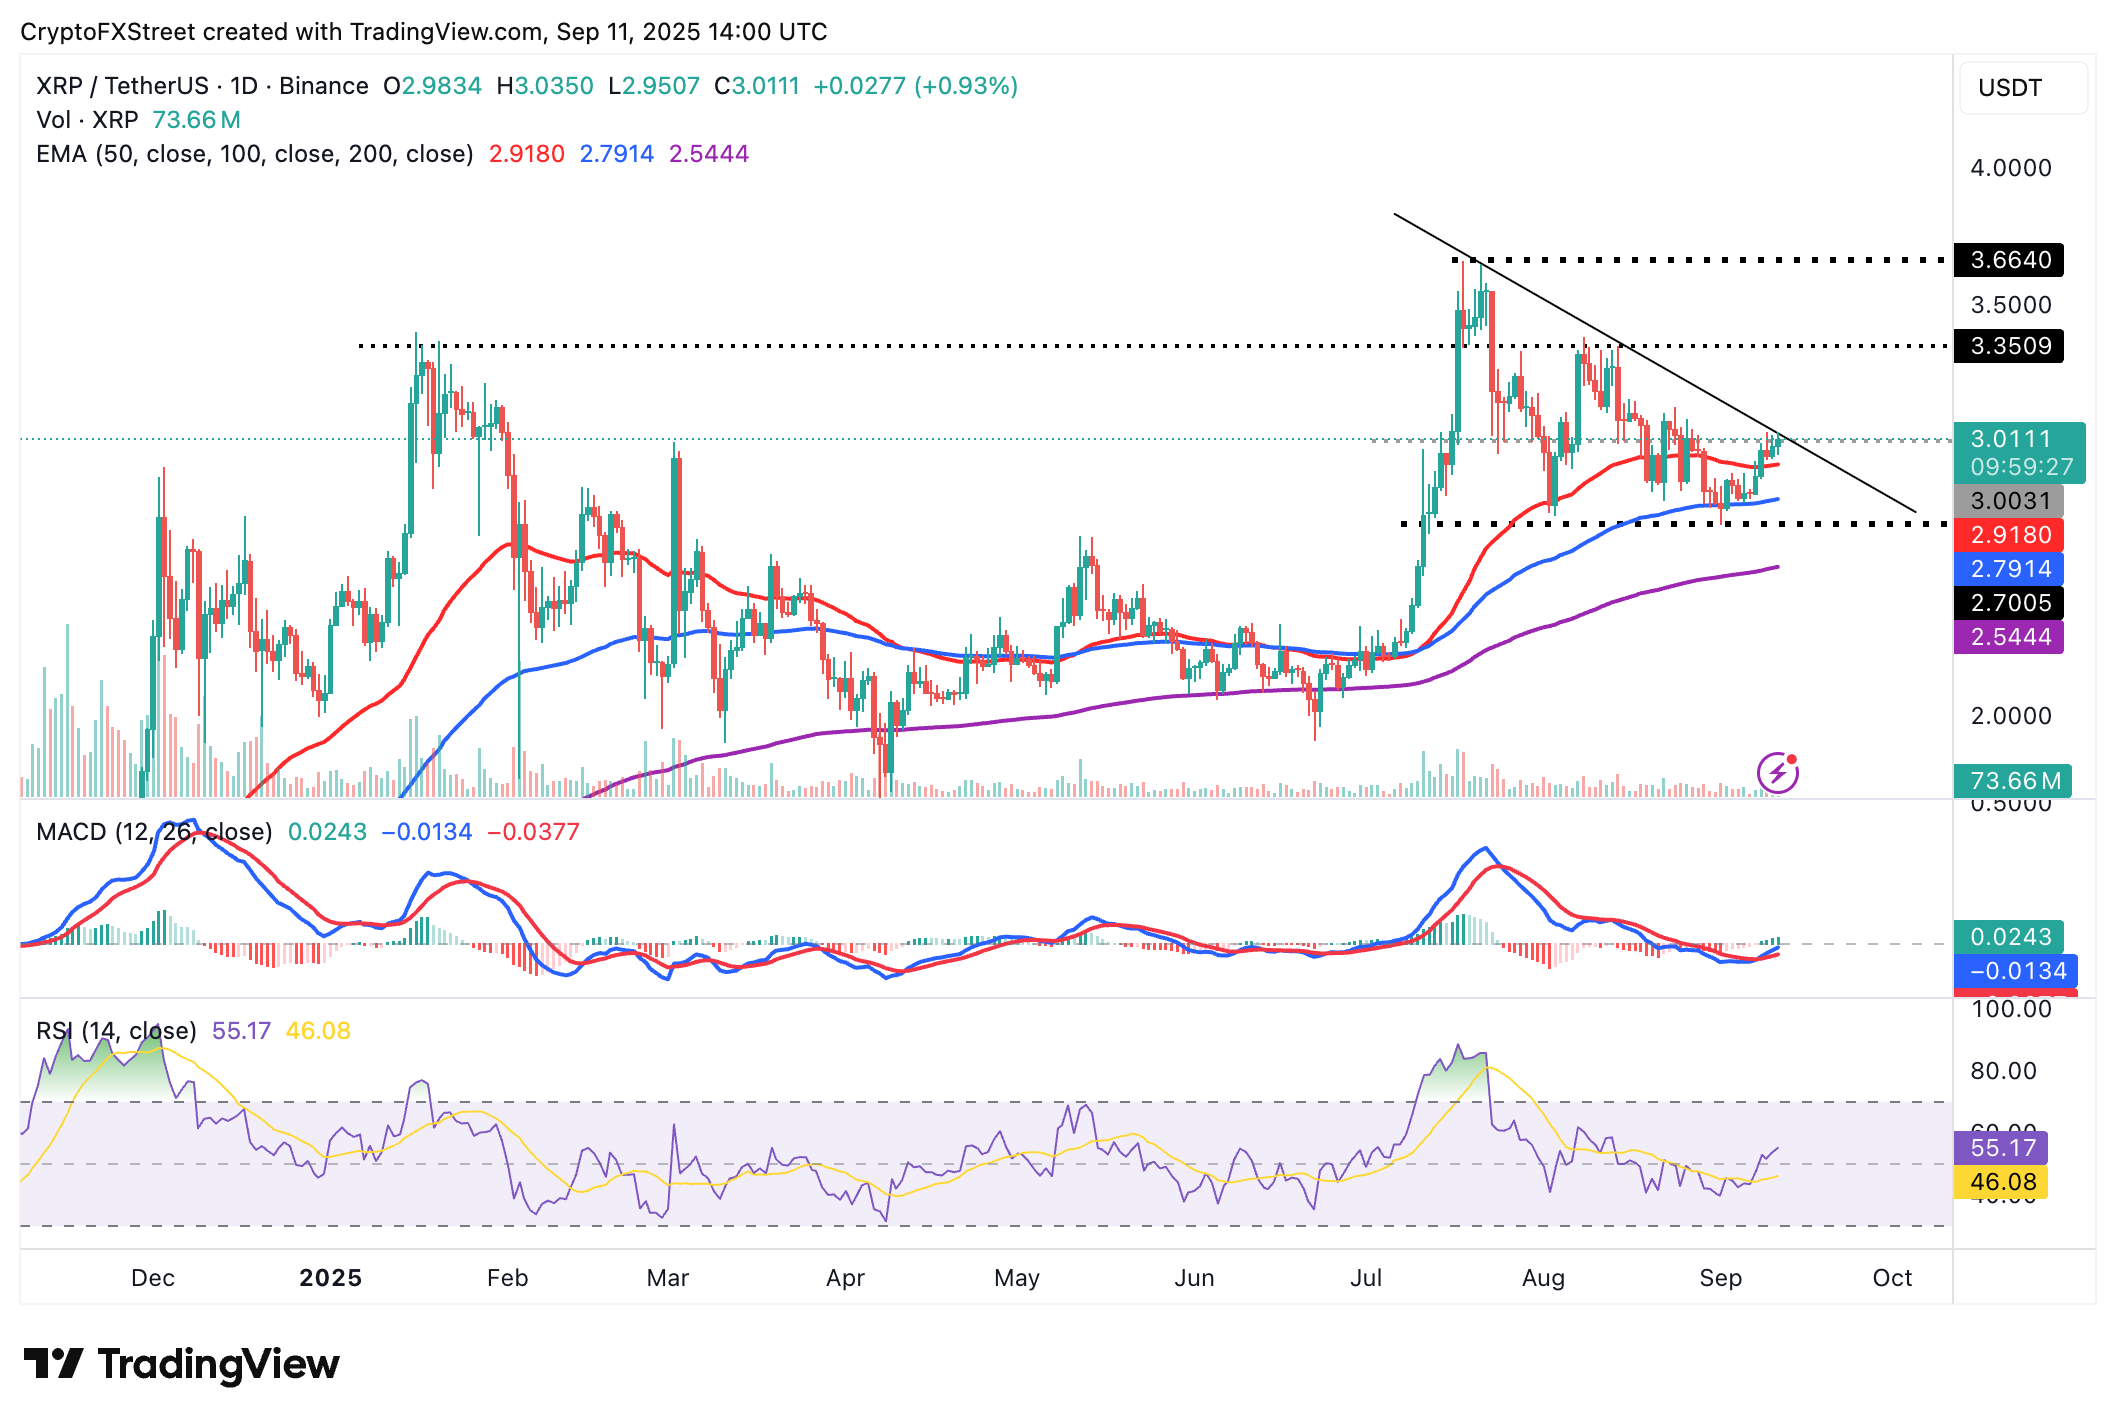
XRP/USDT daily chart
Higher RSI readings, approaching overbought territory, would underpin the steady increase in buying pressure backing retail demand for XRP. Still, traders should be cautious and watch out for sustained pullbacks below the 50-day EMA support at $2.91.
Open Interest, funding rate FAQs
Higher Open Interest is associated with higher liquidity and new capital inflow to the market. This is considered the equivalent of increase in efficiency and the ongoing trend continues. When Open Interest decreases, it is considered a sign of liquidation in the market, investors are leaving and the overall demand for an asset is on a decline, fueling a bearish sentiment among investors.
Funding fees bridge the difference between spot prices and prices of futures contracts of an asset by increasing liquidation risks faced by traders. A consistently high and positive funding rate implies there is a bullish sentiment among market participants and there is an expectation of a price hike. A consistently negative funding rate for an asset implies a bearish sentiment, indicating that traders expect the cryptocurrency’s price to fall and a bearish trend reversal is likely to occur.
추천 기사


