
Crypto Today: Bitcoin steadies above $114,000, Ethereum extends rally as XRP consolidates
- Bitcoin holds above $114,000, buoyed by positive market sentiment and growing institutional interest.
- Ethereum rises for the fifth consecutive day, reflecting rising demand from ETFs and treasury companies.
- XRP finds footing around $3.00 as bulls tighten grip, backed by multiple buy signals.
Bitcoin (BTC) is trading above $114,000, underpinned by growing demand from both retail and institutional investors. On the other hand, Ethereum (ETH) is extending its recovery for the fifth consecutive day, hovering above $4,400, while Ripple (XRP) trades sideways around the $3.00 critical level.
On the macroeconomic data front, the consensus is that the United States (US) Federal Reserve (Fed) will cut interest rates on Wednesday, boosting risk-on sentiment, with investors anticipating risky assets such as crypto and equities to benefit significantly.
Data spotlight: Bitcoin ETF inflows surge as institutional demand grows
Bitcoin spot Exchange Traded Funds (ETFs) experienced a surge in daily net inflows, reaching $757 million on Wednesday. The uptick in inflows reflects growing interest among institutional investors amid optimism for what could be the first interest rate cut by the Fed this year.
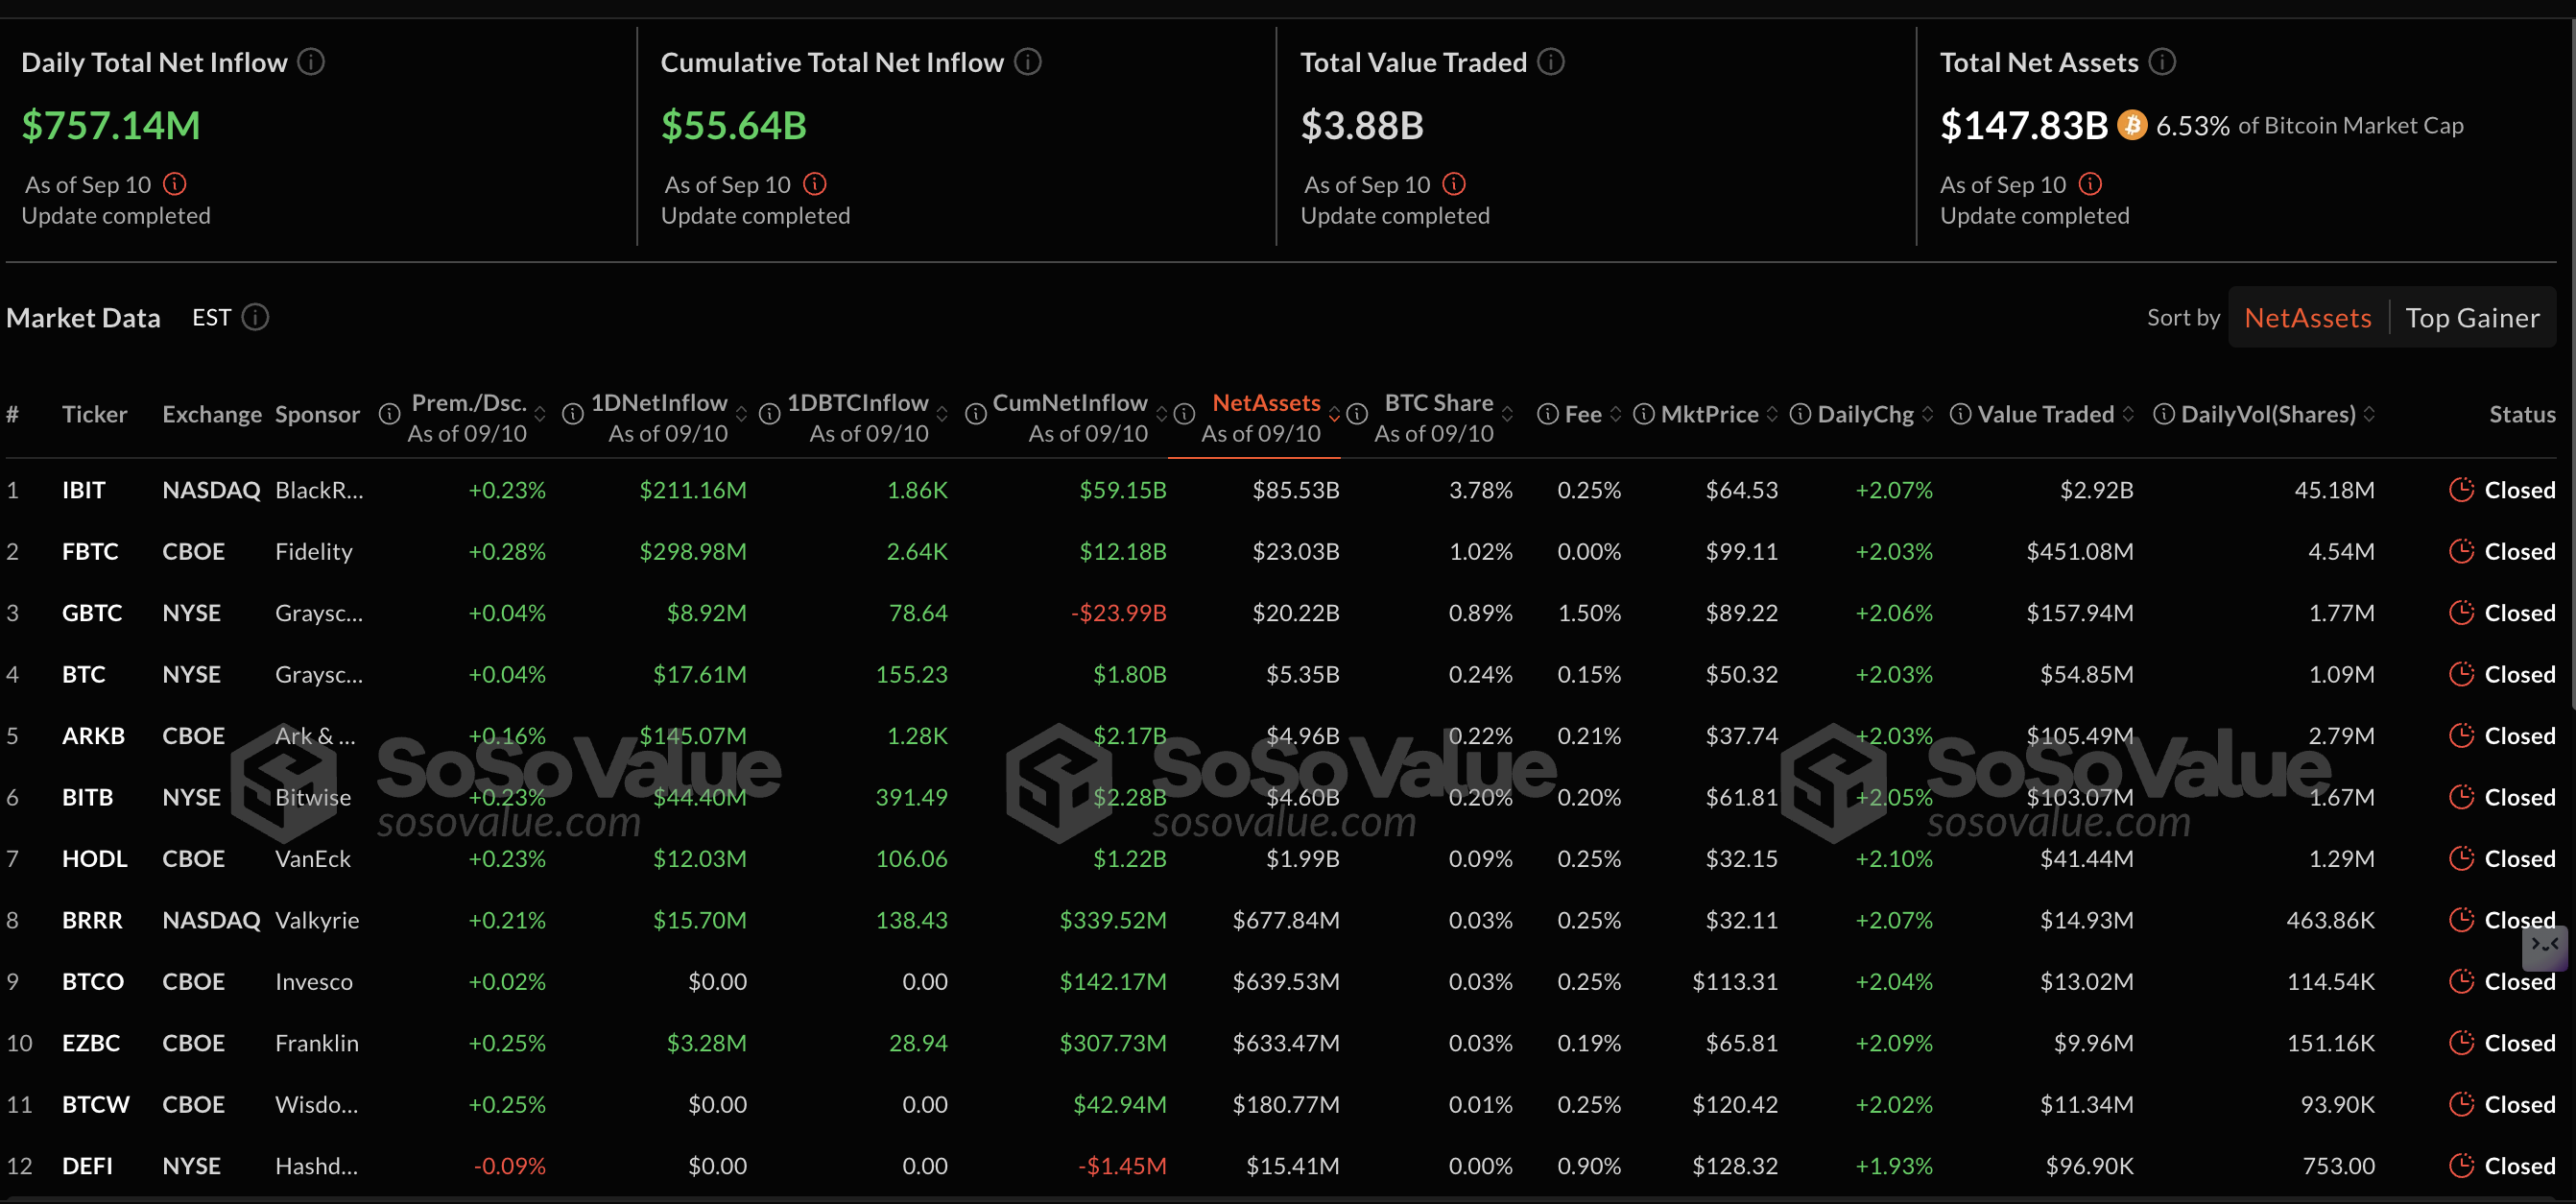
Bitcoin ETF stats | Source: SoSoValue
Demand for Ethereum spot ETFs in the US also increased mid-week, with inflows of approximately $172 million. BlackRock’s ETHA ETF led with around $75 million in inflows, followed by Fidelity’s FETH with almost $50 million.
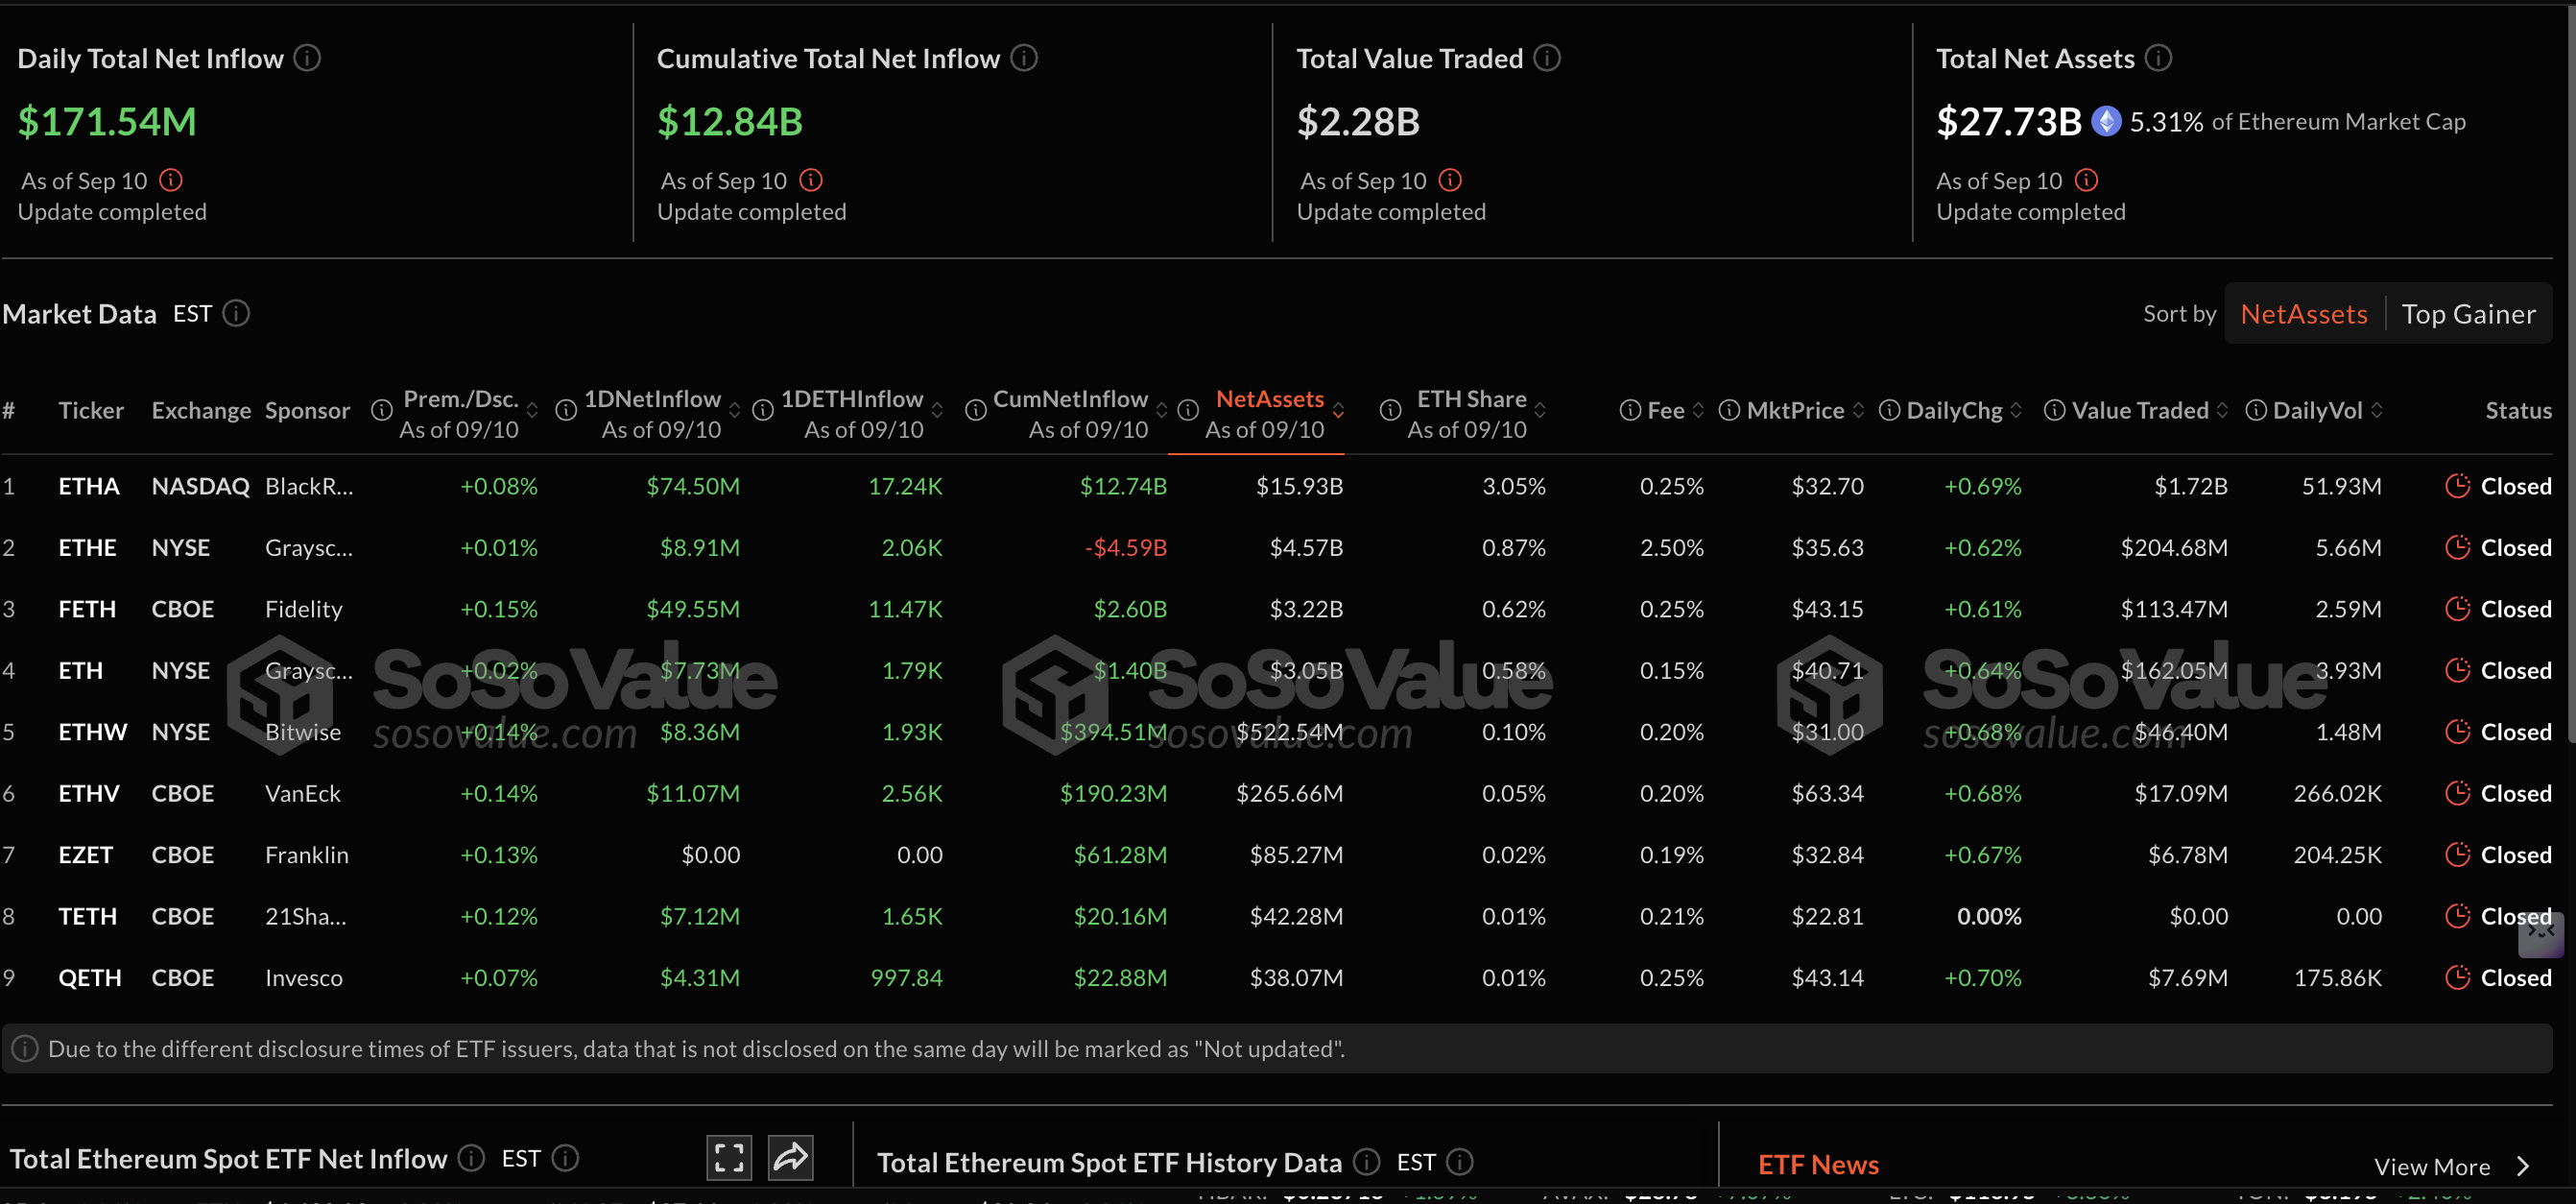
Ethereum ETF stats | Source: SoSoValue
Meanwhile, retail interest in XRP is gaining momentum, supported by a steady increase in the futures Open Interest (OI), which averaged at $8.15 billion on Thursday, up from $7.37 billion on Sunday. This rising trend suggests that investors have a strong conviction in XRP’s ability to sustain its recovery to the record high of $3.66 reached on July 18.
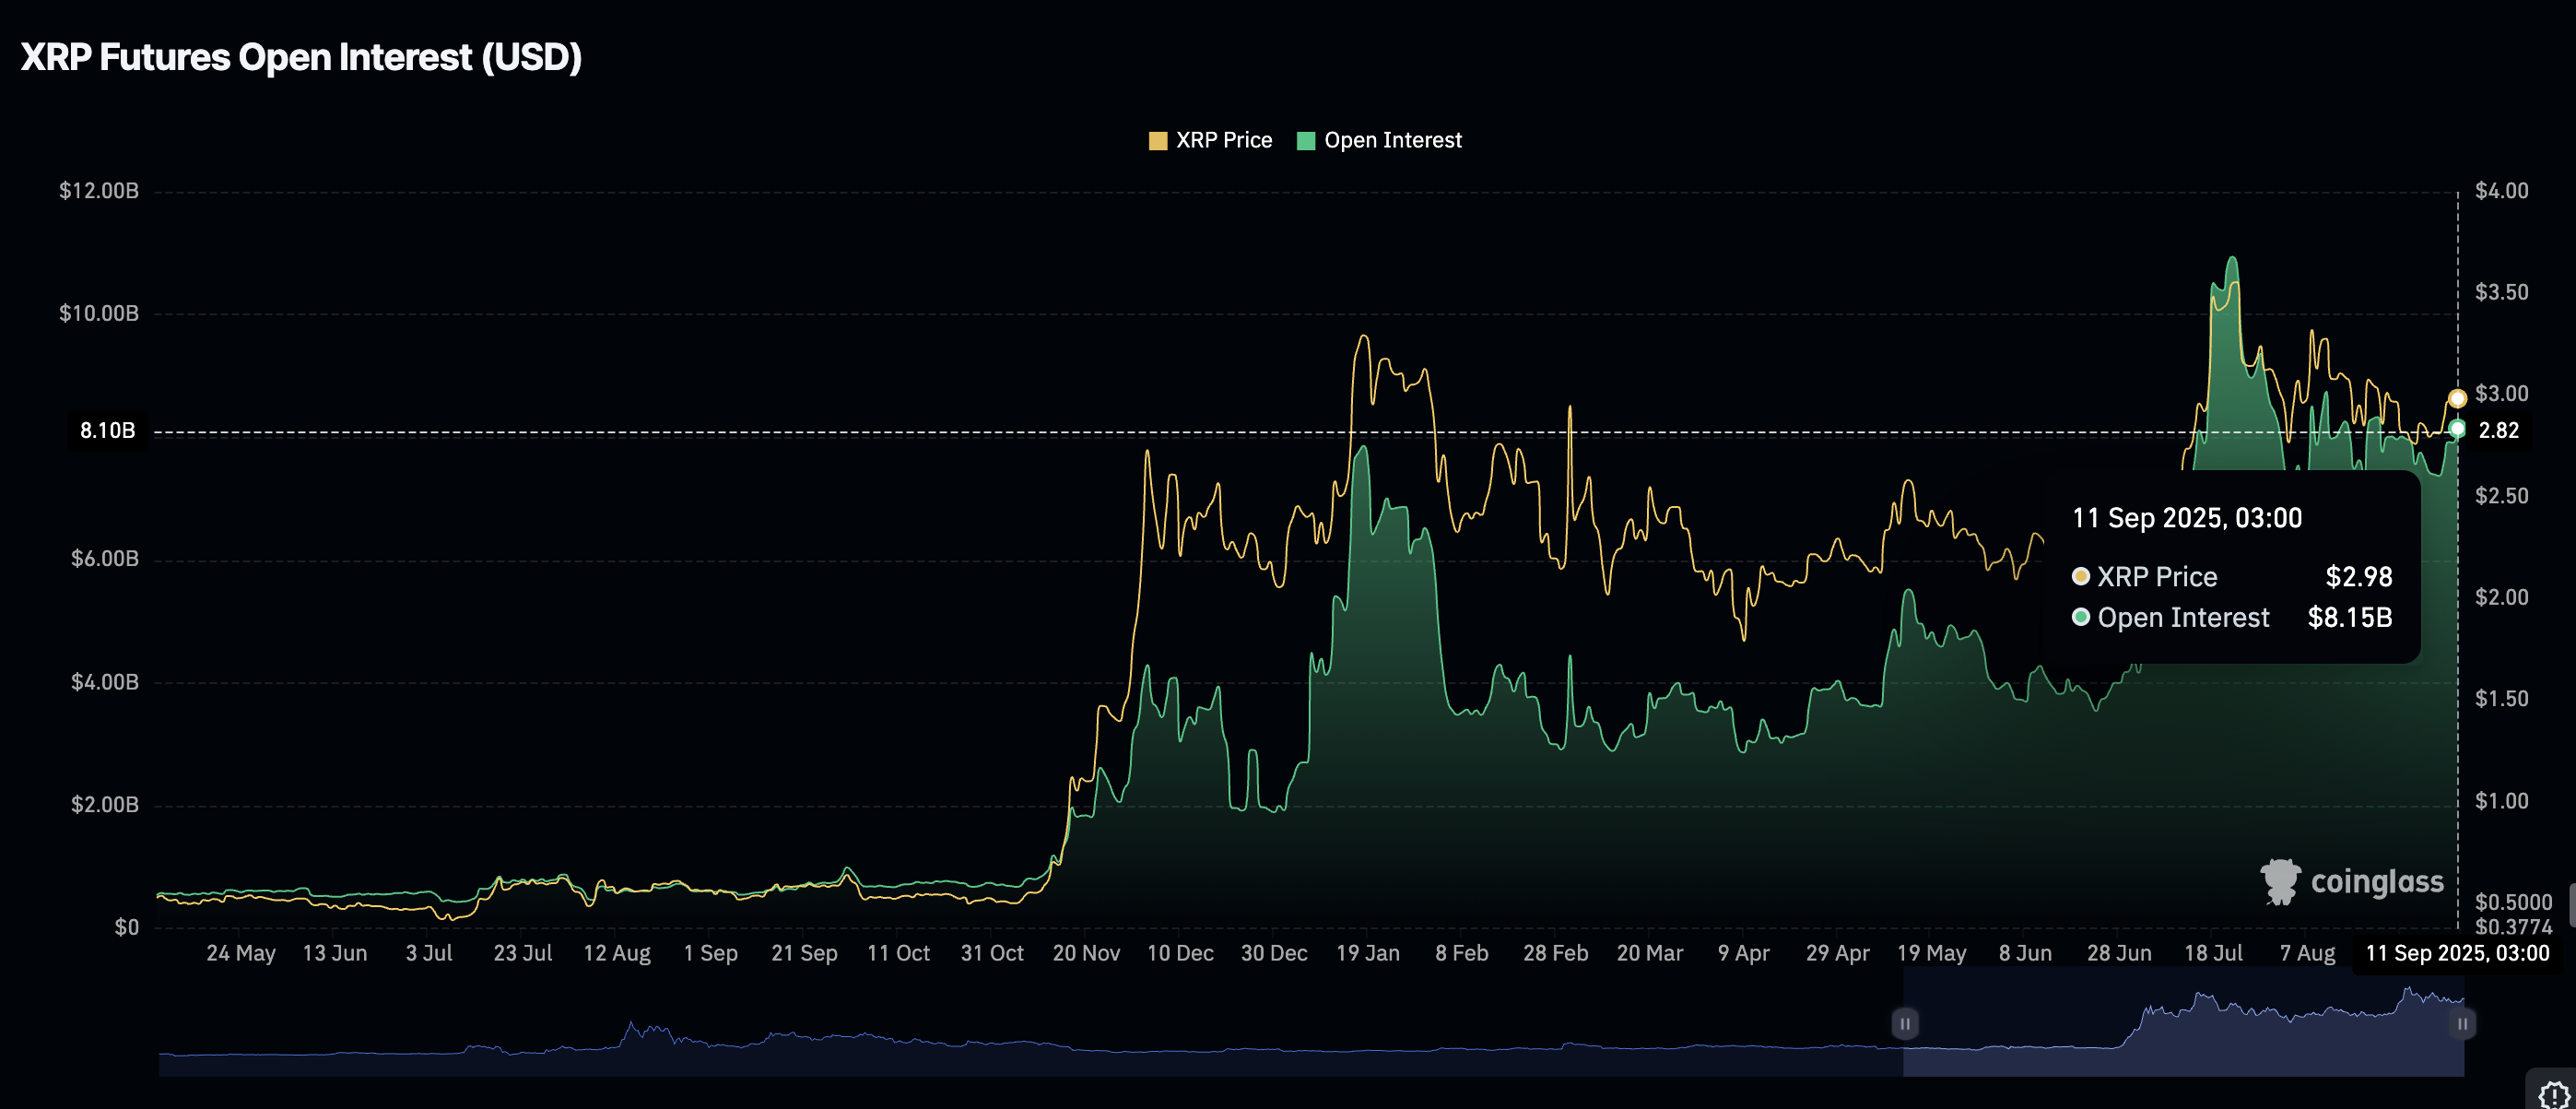
XRP Futures Open Interest | Source: Coinglass
Chart of the day: Bitcoin eyes $120,000 breakout
Bitcoin price holds above $114,000 as bulls push to establish a higher support level ahead of the next leg up toward the $120,000 target. A strong technical structure supports the bullish outlook, starting with a buy signal from the Moving Average Convergence Divergence (MACD) indicator, which has been in effect since Sunday on the daily chart.
The steady recovery in the Relative Strength Index (RSI) at 54 from 37 seen on September 1 implies an increase in buying pressure. As the RSI rises toward overbought territory, demand for BTC grows, supporting the anticipated breakout toward the $120,000 level.
Suppose profit-taking slows down the recovery or culminates in a trend correction. In that case, the 50-day Exponential Moving Average (EMA) at $112,974 is in line to absorb the selling pressure and allow for a quick reversal. Extended declines would likely see traders shift their focus to the 100-day EMA at $110,898, which would provide support.
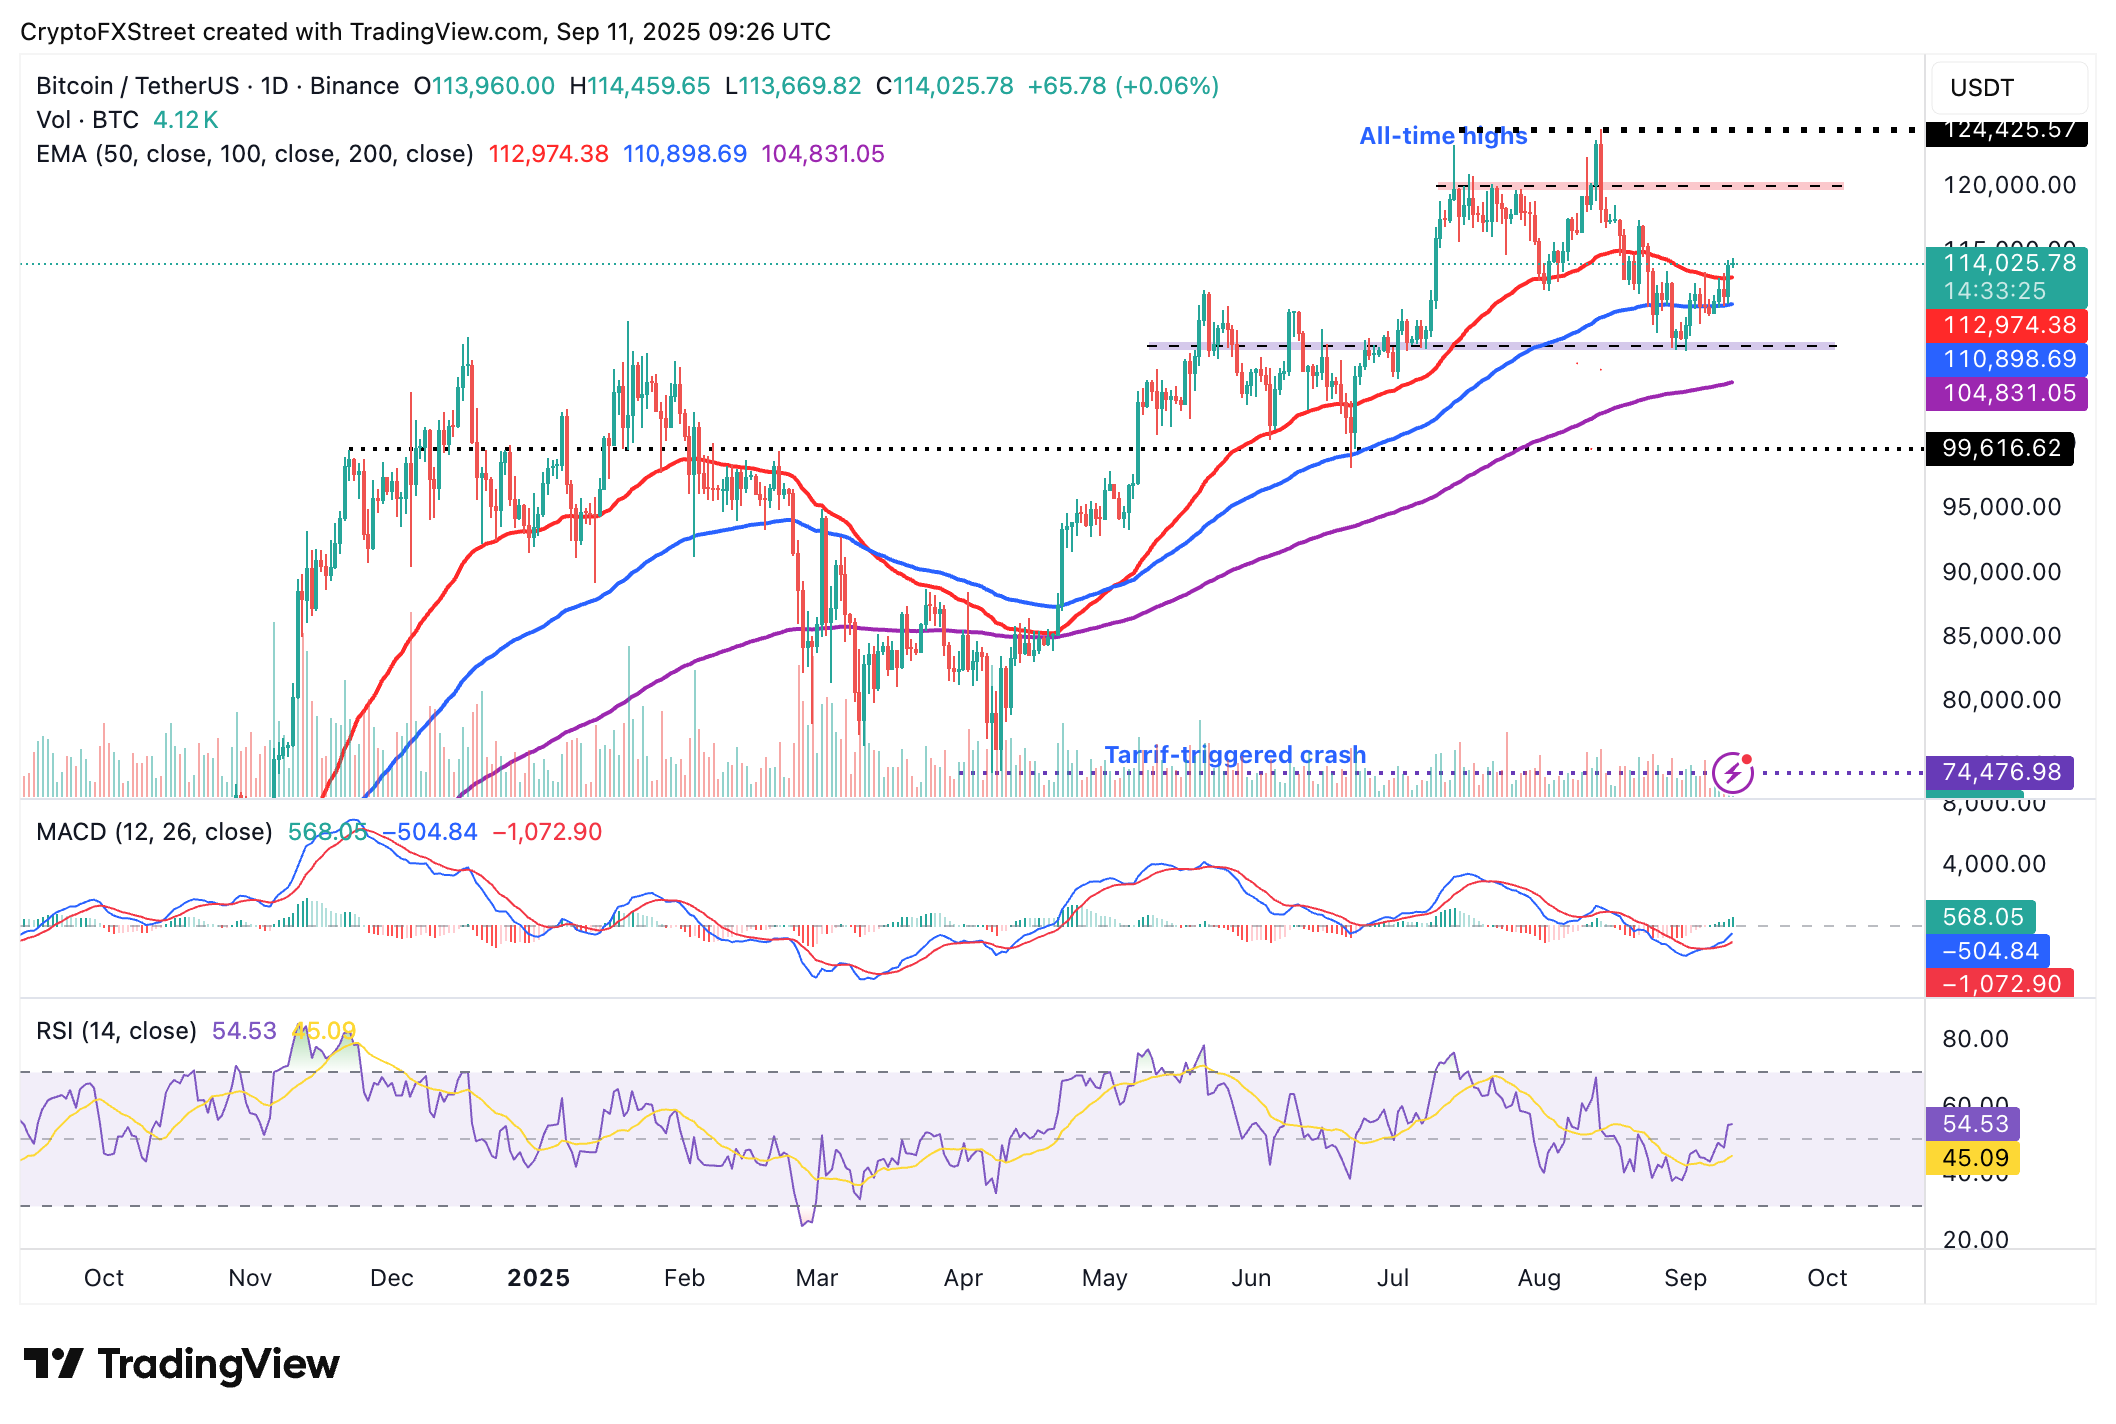
BTC/USDT daily chart
Altcoins update: Ethereum and XRP hold key support
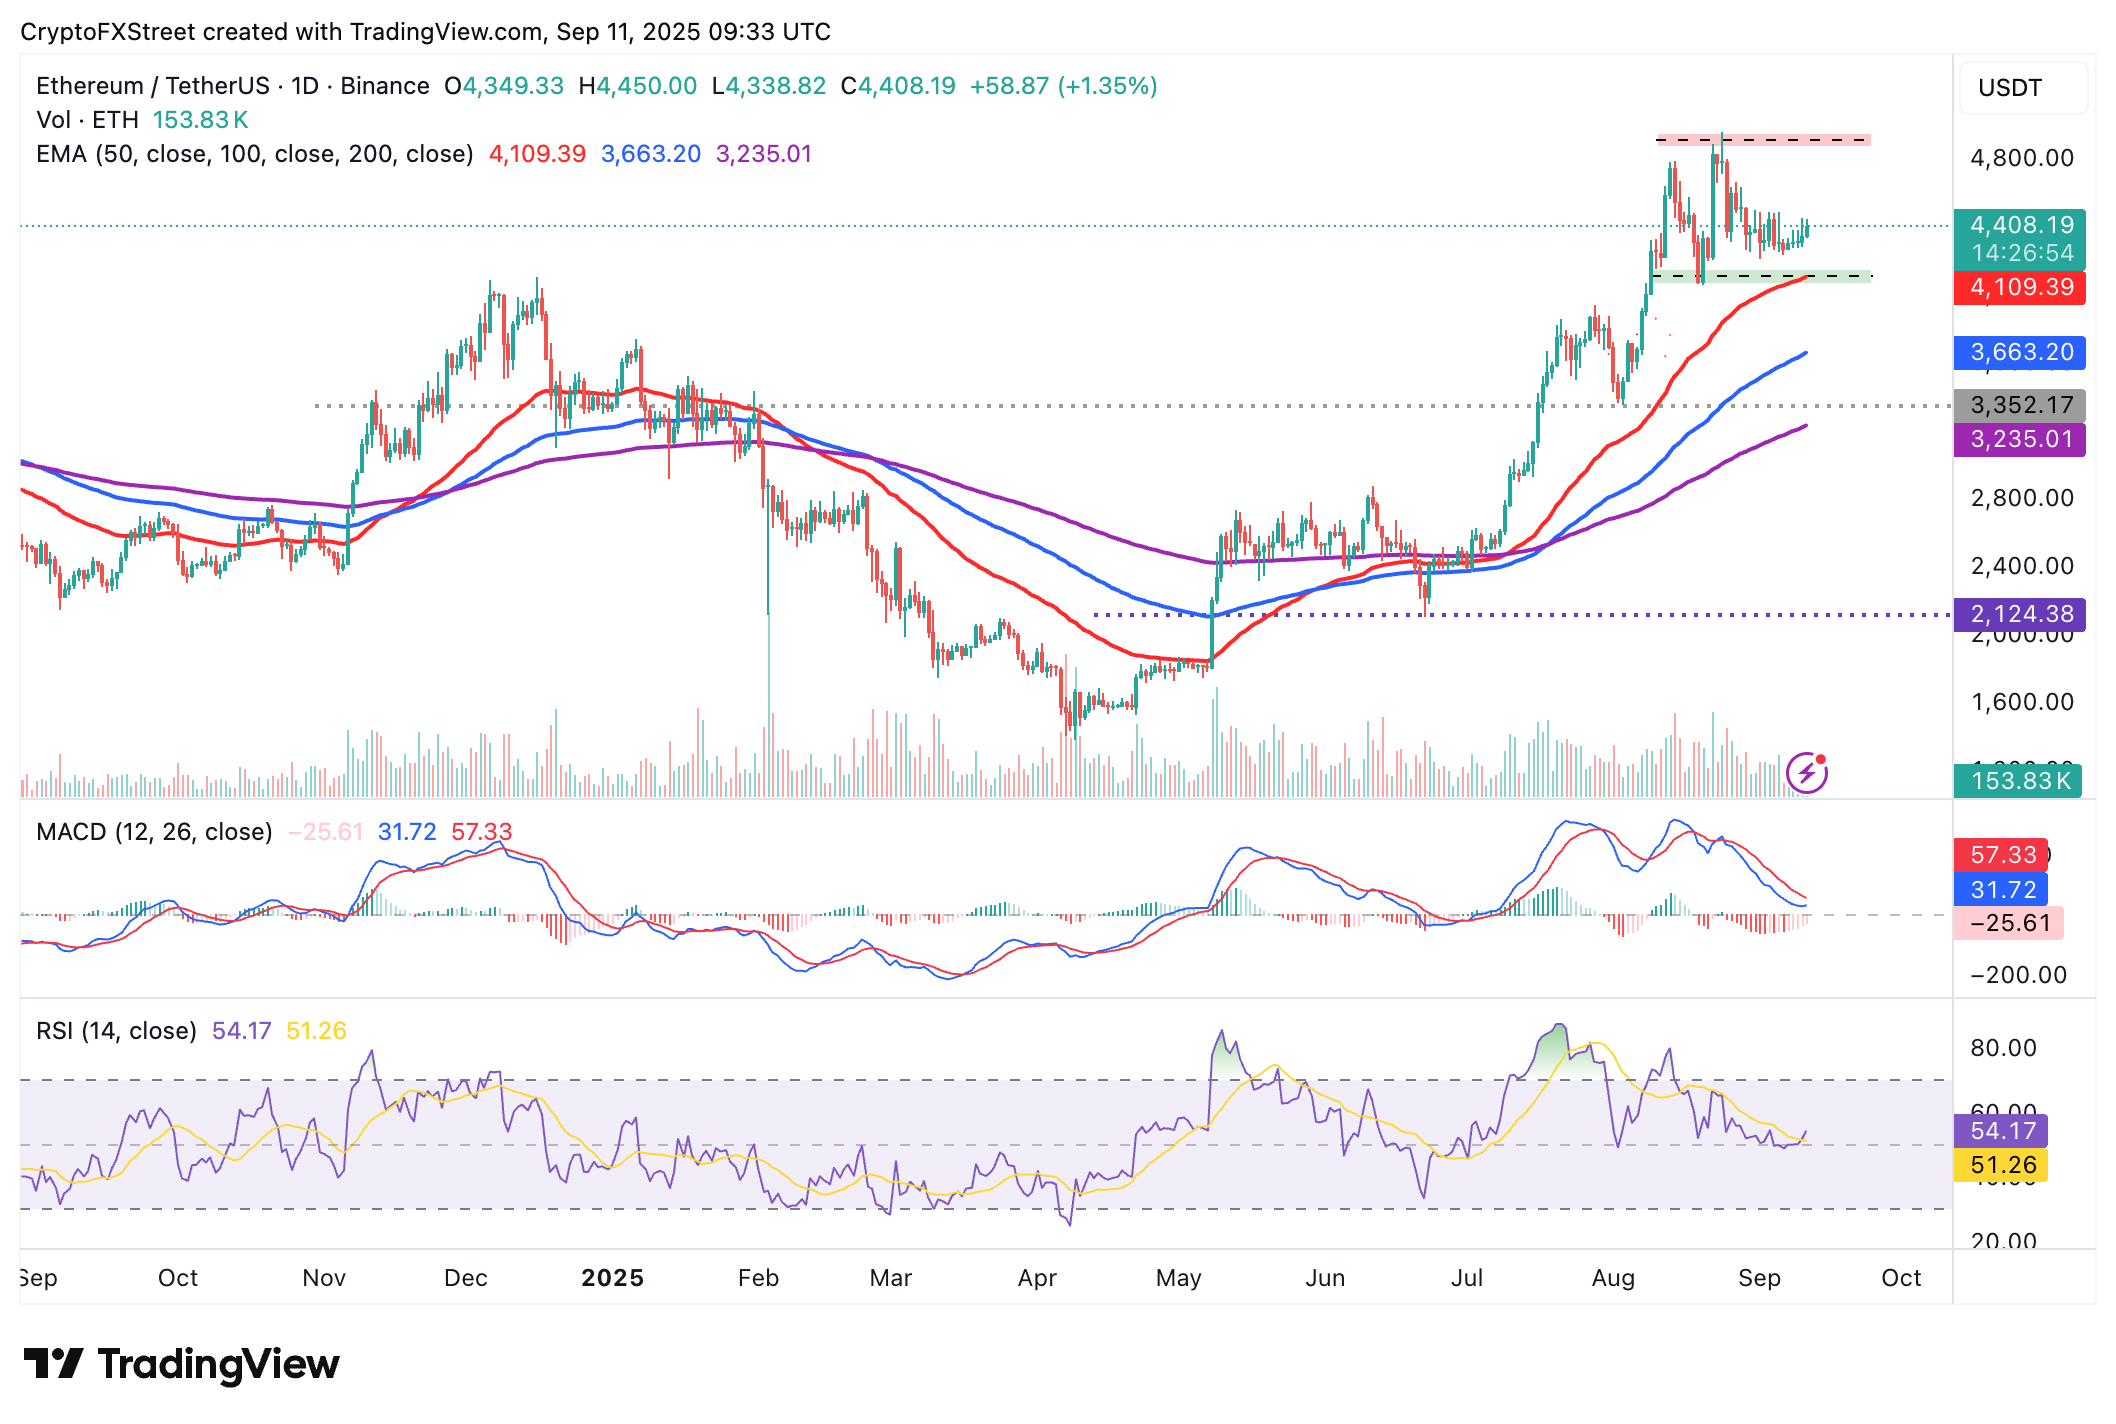
Ethereum remains above $4,400 as interest in the token increases, as evidenced by the uptick in ETF inflows and the recovery from the support level tested at $4,230 on Saturday. The RSI at 54 on the daily chart shows stability above the midline, indicating bullish momentum.
The token also holds above key moving averages, including the 50-day EMA at $4,109, the $100-day EMA at $3,663 and the 200-day EMA at $3,235, supporting the positive market sentiment.
Demand for Ethereum is expected to continue increasing as the RSI rises toward overbought territory. Traders will also look out for a potential buy signal from the MACD indicator, encouraging them to increase exposure. Such a signal manifests when the blue line crosses above the red signal line within the same daily time frame.
Key milestones likely to mark the Ethereum price recovery are the resistance at $4,500, which was tested on August 29, and its record high of $4,956 reached on August 24.
ETH/USDT daily chart
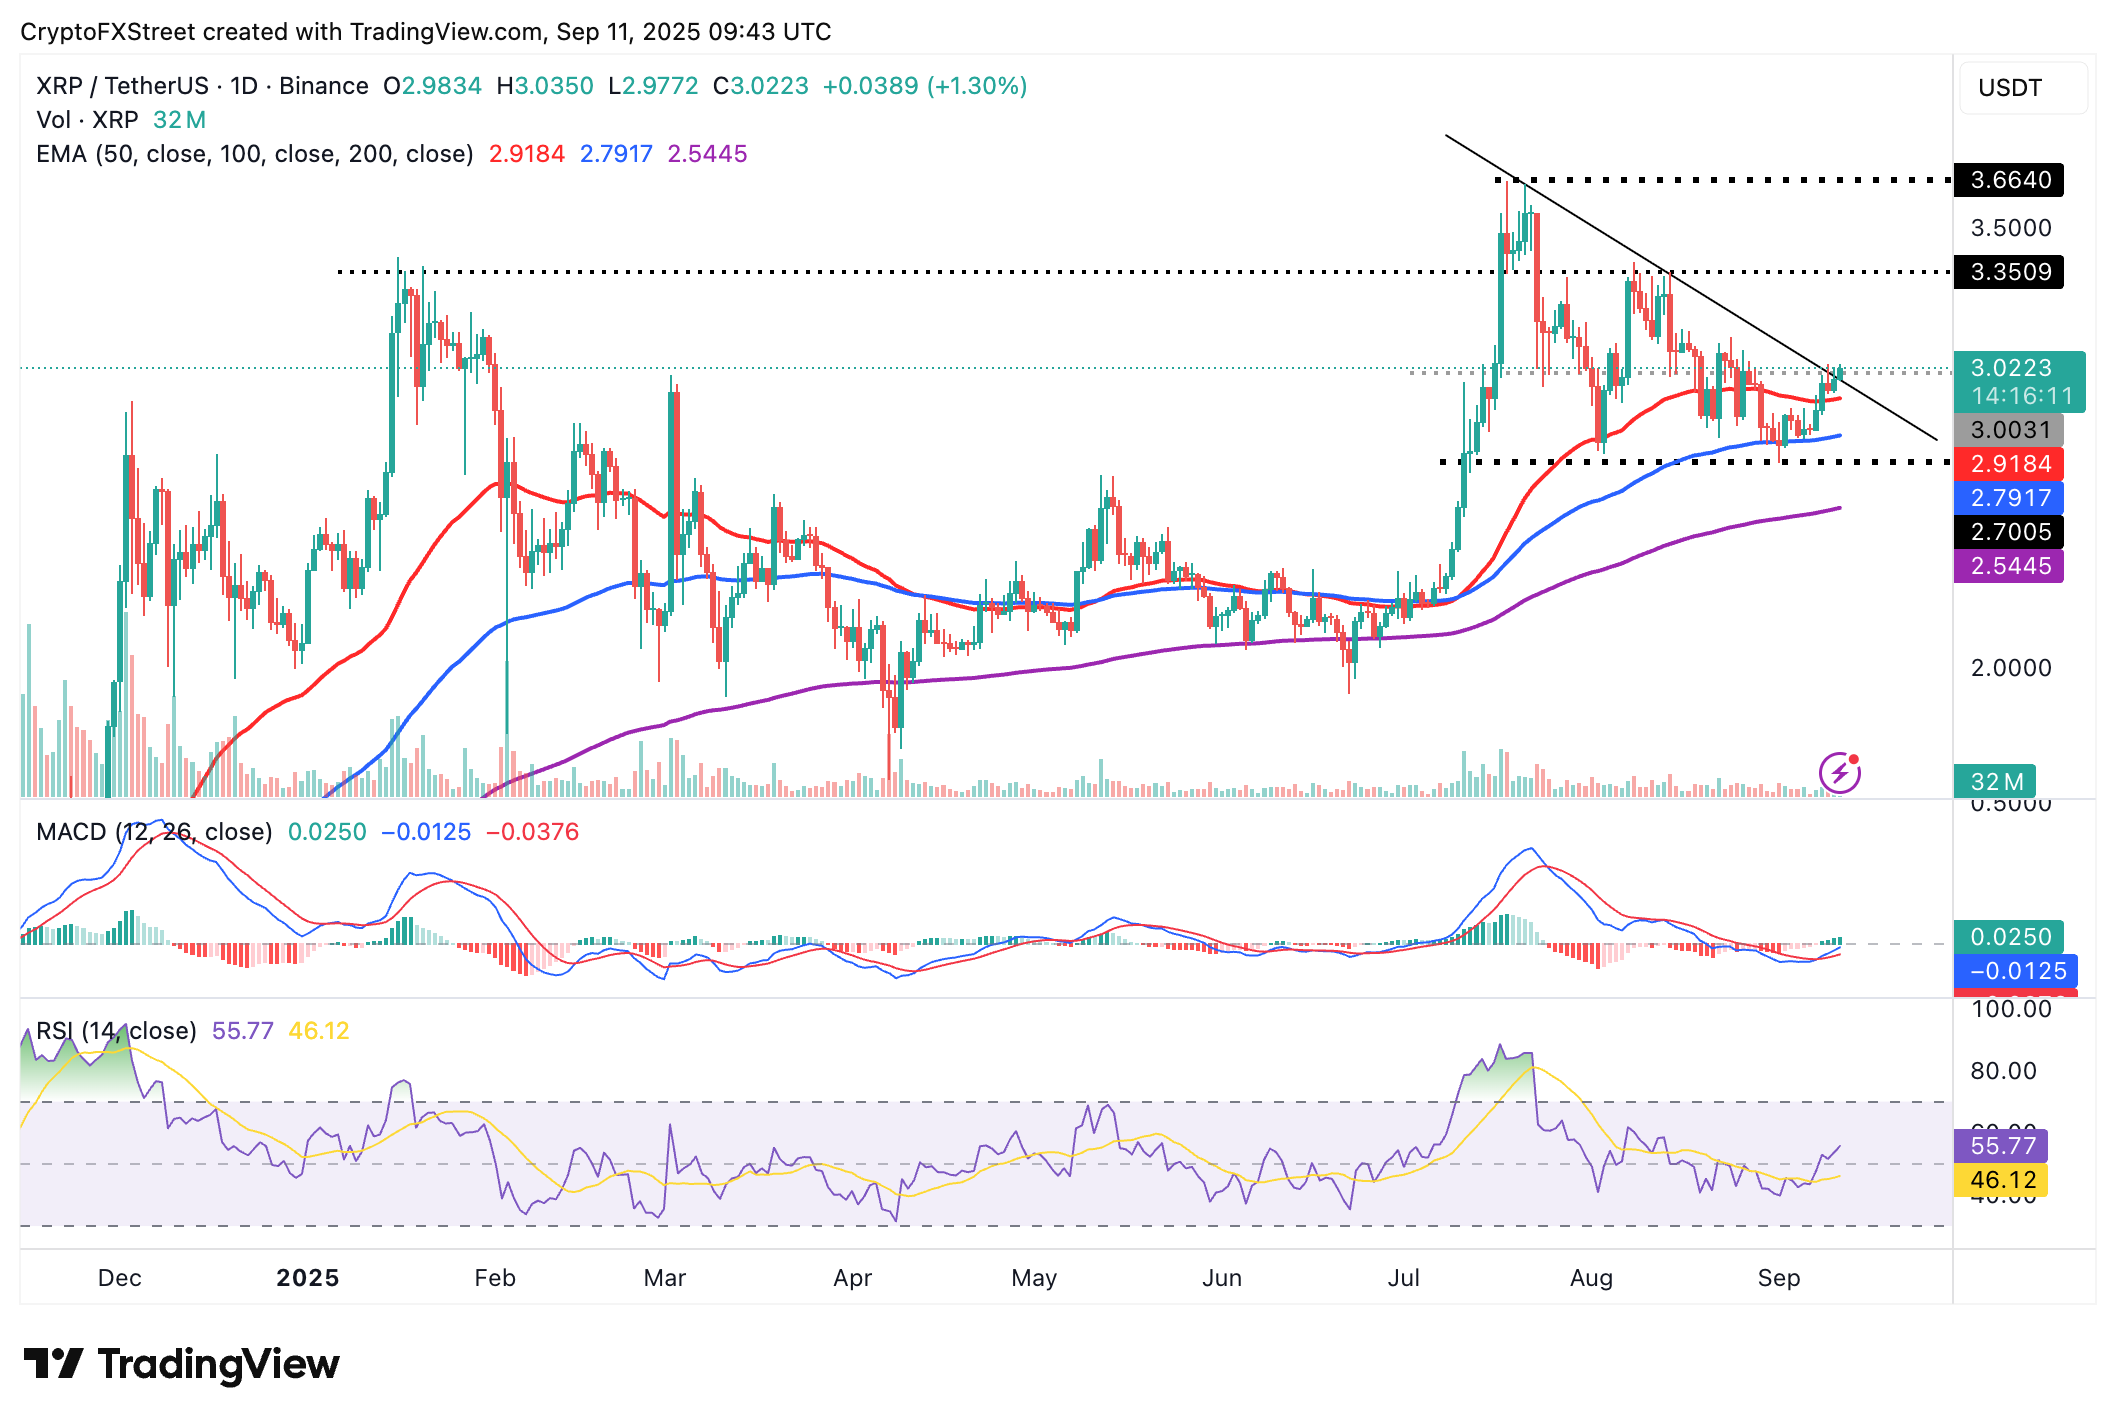
As for XRP, the price holds above several key levels, including the resistance-turned-support at $3.00, a descending trendline and the 50-day Exponential Moving Average (EMA) at $2.91 on the daily chart.
The MACD indicator reinforces the short-term bullish outlook, sustaining a buy signal triggered on Monday. Investors will likely continue to seek exposure as long as the blue MACD line holds above the orange signal line.
XRP/USDT daily chart
The RSI, positioned at 55, shows that bearish momentum is gradually fading, paving the way for bulls to regain control of the trend. Higher RSI readings, approaching overbought territory, would underpin the steady increase in buying pressure backing retail demand for XRP.
Still, traders should be cautious and watch out for sustained pullbacks below the 50-day EMA support at $2.91.
Bitcoin, altcoins, stablecoins FAQs
Bitcoin is the largest cryptocurrency by market capitalization, a virtual currency designed to serve as money. This form of payment cannot be controlled by any one person, group, or entity, which eliminates the need for third-party participation during financial transactions.
Altcoins are any cryptocurrency apart from Bitcoin, but some also regard Ethereum as a non-altcoin because it is from these two cryptocurrencies that forking happens. If this is true, then Litecoin is the first altcoin, forked from the Bitcoin protocol and, therefore, an “improved” version of it.
Stablecoins are cryptocurrencies designed to have a stable price, with their value backed by a reserve of the asset it represents. To achieve this, the value of any one stablecoin is pegged to a commodity or financial instrument, such as the US Dollar (USD), with its supply regulated by an algorithm or demand. The main goal of stablecoins is to provide an on/off-ramp for investors willing to trade and invest in cryptocurrencies. Stablecoins also allow investors to store value since cryptocurrencies, in general, are subject to volatility.
Bitcoin dominance is the ratio of Bitcoin's market capitalization to the total market capitalization of all cryptocurrencies combined. It provides a clear picture of Bitcoin’s interest among investors. A high BTC dominance typically happens before and during a bull run, in which investors resort to investing in relatively stable and high market capitalization cryptocurrency like Bitcoin. A drop in BTC dominance usually means that investors are moving their capital and/or profits to altcoins in a quest for higher returns, which usually triggers an explosion of altcoin rallies.
추천 기사


