
Dow Jones Industrial Average soars to new highs after CPI inflation meets expectations
- The Dow Jones rocketed to new all-time highs on Thursday.
- US CPI inflation clocked in roughly around expectations, cementing odds of a Fed rate cut next week.
- UoM Consumer Sentiment figures due on Friday are unlikely to shift the needle.
The Dow Jones Industrial Average (DJIA) found a new record high on Thursday, climbing nearly 600 points at its peak and tapping 46,093 for the first time ever. US Consumer Price Index (CPI) inflation came in roughly around expectations for August, pinning hopes for a September rate cut from the Federal Reserve (Fed) to the ceiling.
Headline CPI inflation rose again in August, with the annualized index rising to 2.9% and the monthly number accelerating to 0.4% as front-end inflationary pressure continues to build. Shelter and food prices were the largest drivers of near-term inflationary pressure, with the grocery items index rising 0.5% over a single month. Core CPI inflation, or headline inflation less energy and food prices, rose to 2.9% YoY, landing within median market forecasts.
CPI inflation uptick keeps rate cut bets on the rails
Despite another rise in key inflation pressure, August’s CPI inflation data wasn’t enough to derail market expectations for a Fed interest rate cut next week. According to the CME’s FedWatch Tool, interest rate futures traders are fully pricing in three rate cuts before the end of the year. A 25-basis-point cut is a foregone conclusion at the Federal Open Market Committee’s (FOMC) interest rate decision on September 17, and rate markets are pricing in nearly 95% odds that the Fed will deliver follow-up rate trims on October 29 and December 10.
University of Michigan (UoM) Consumer Sentiment Index data is due on Friday, but the datapoint is unlikely to result in any meaningful shifts in market sentiment. The aggregated survey index is expected to tick down to 58.0 from 58.2.
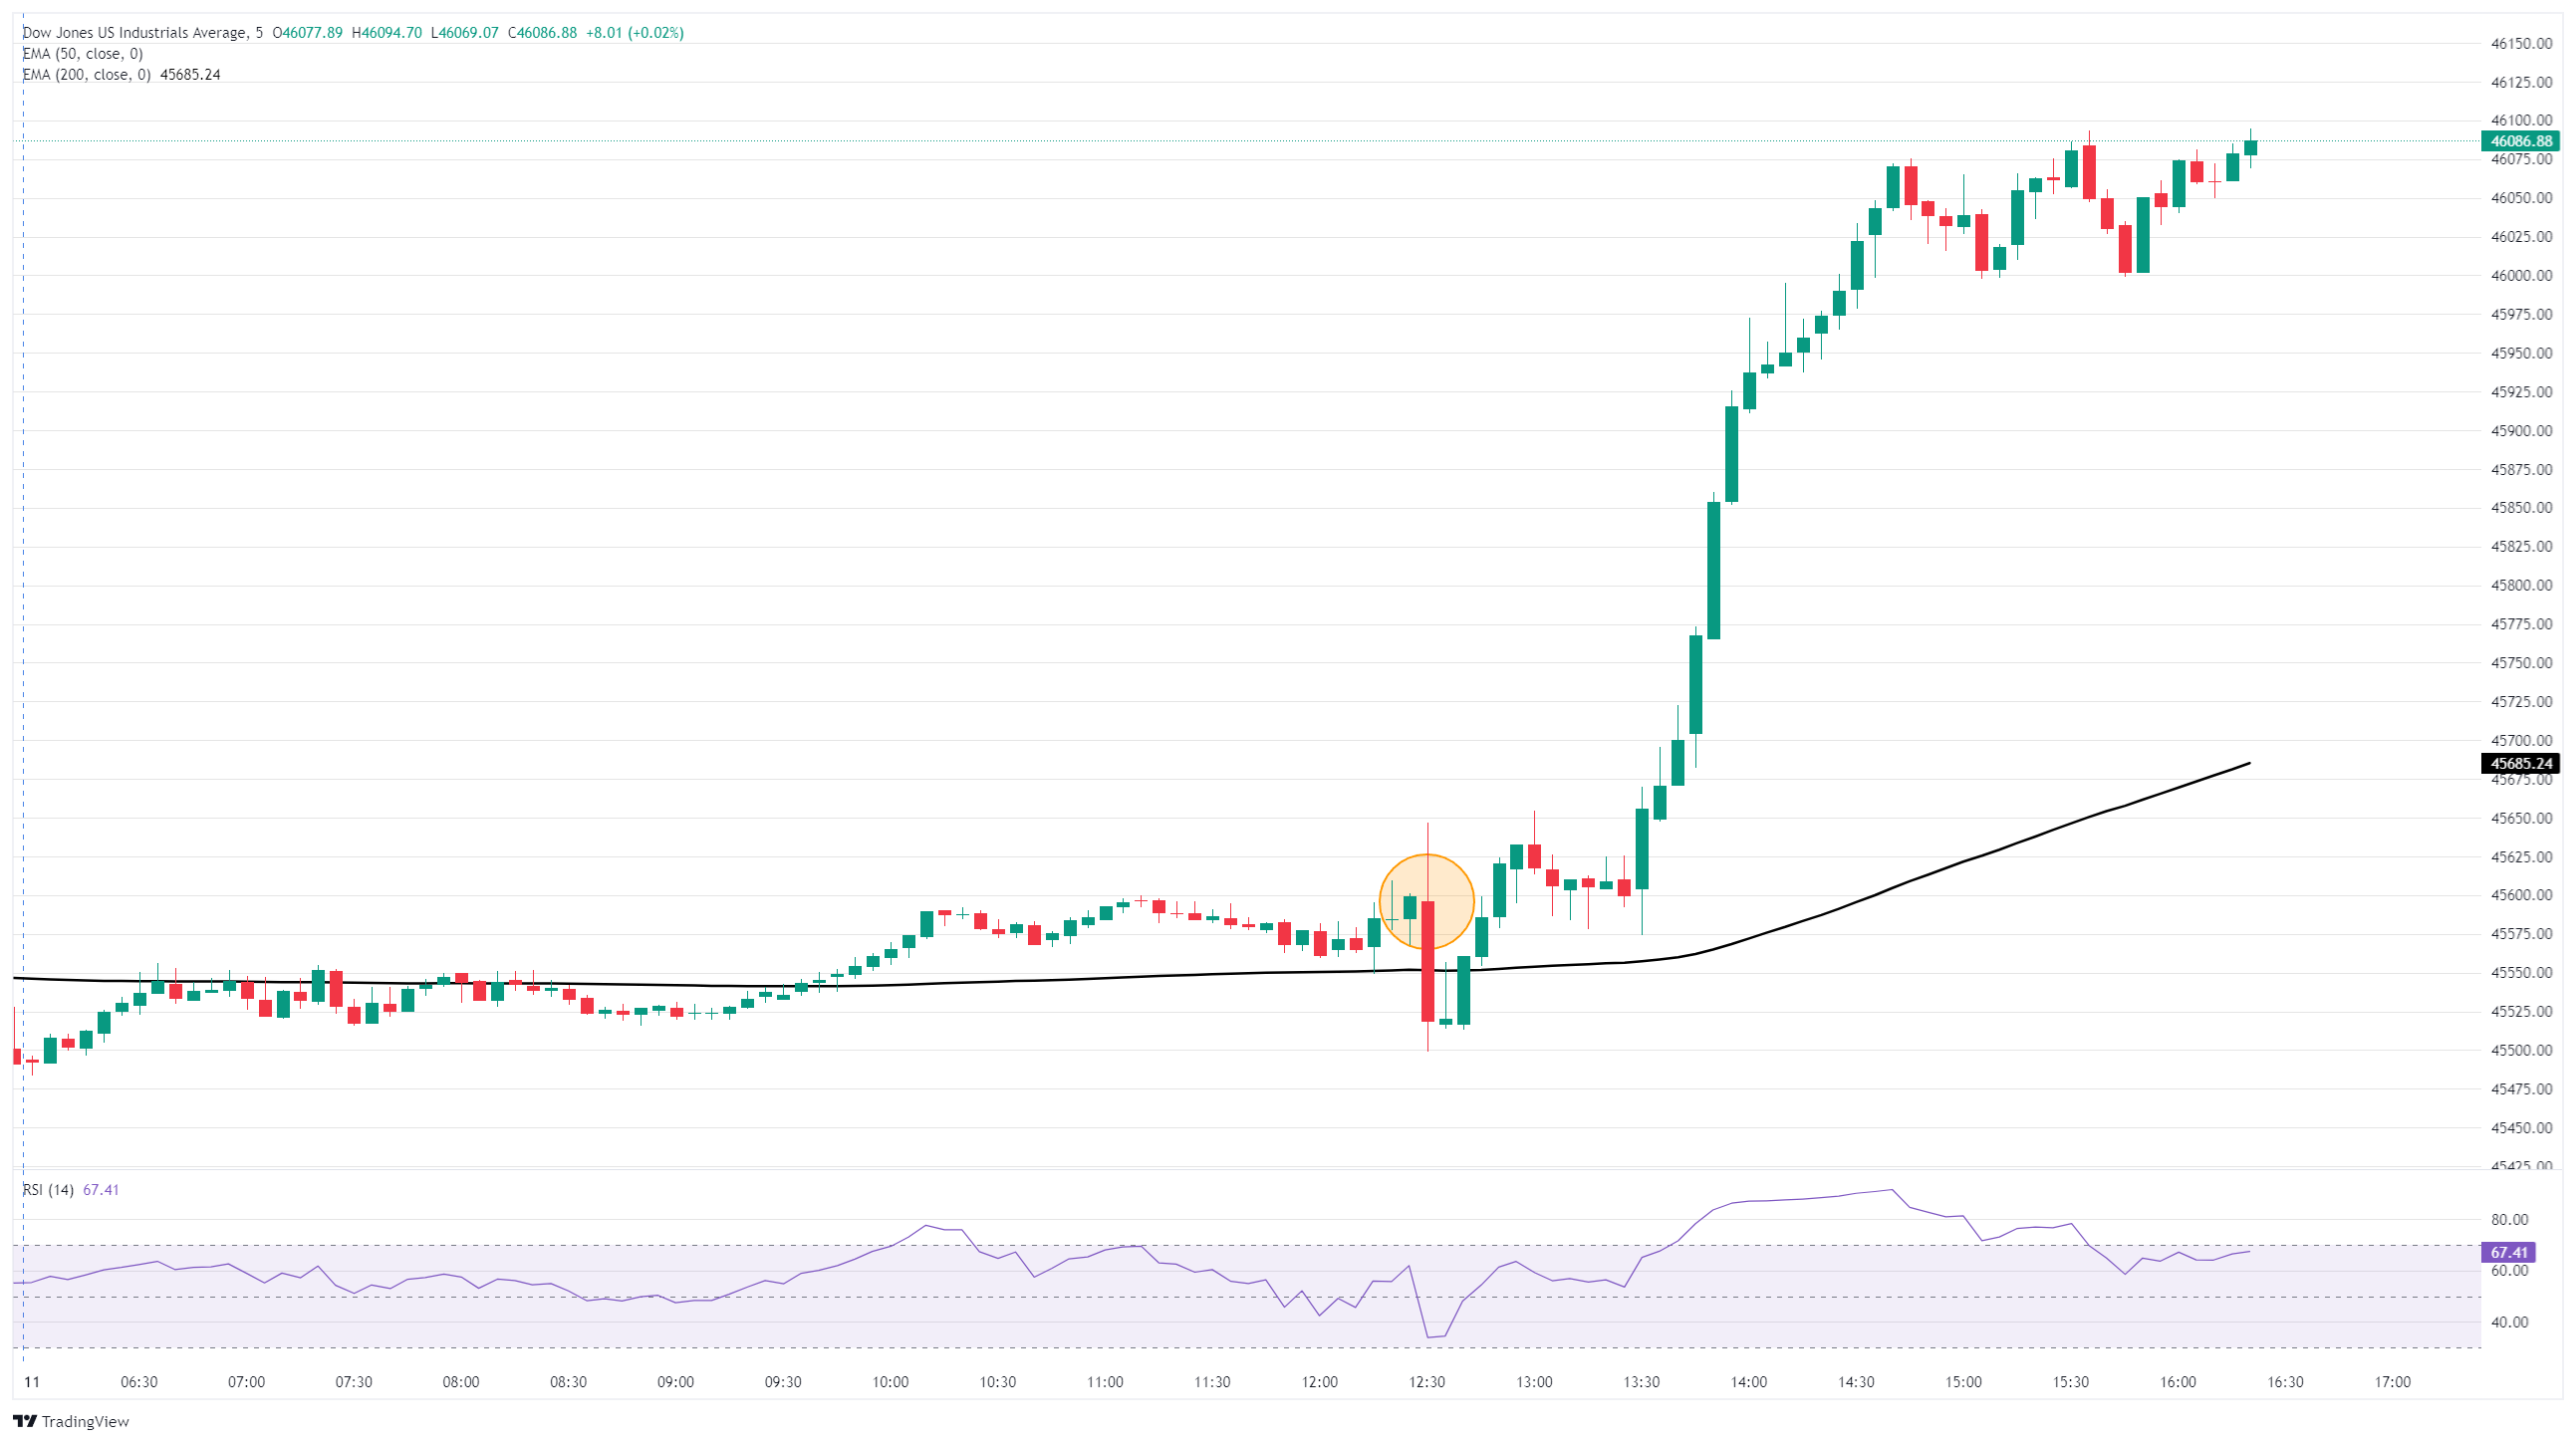
Dow Jones 5-minute chart
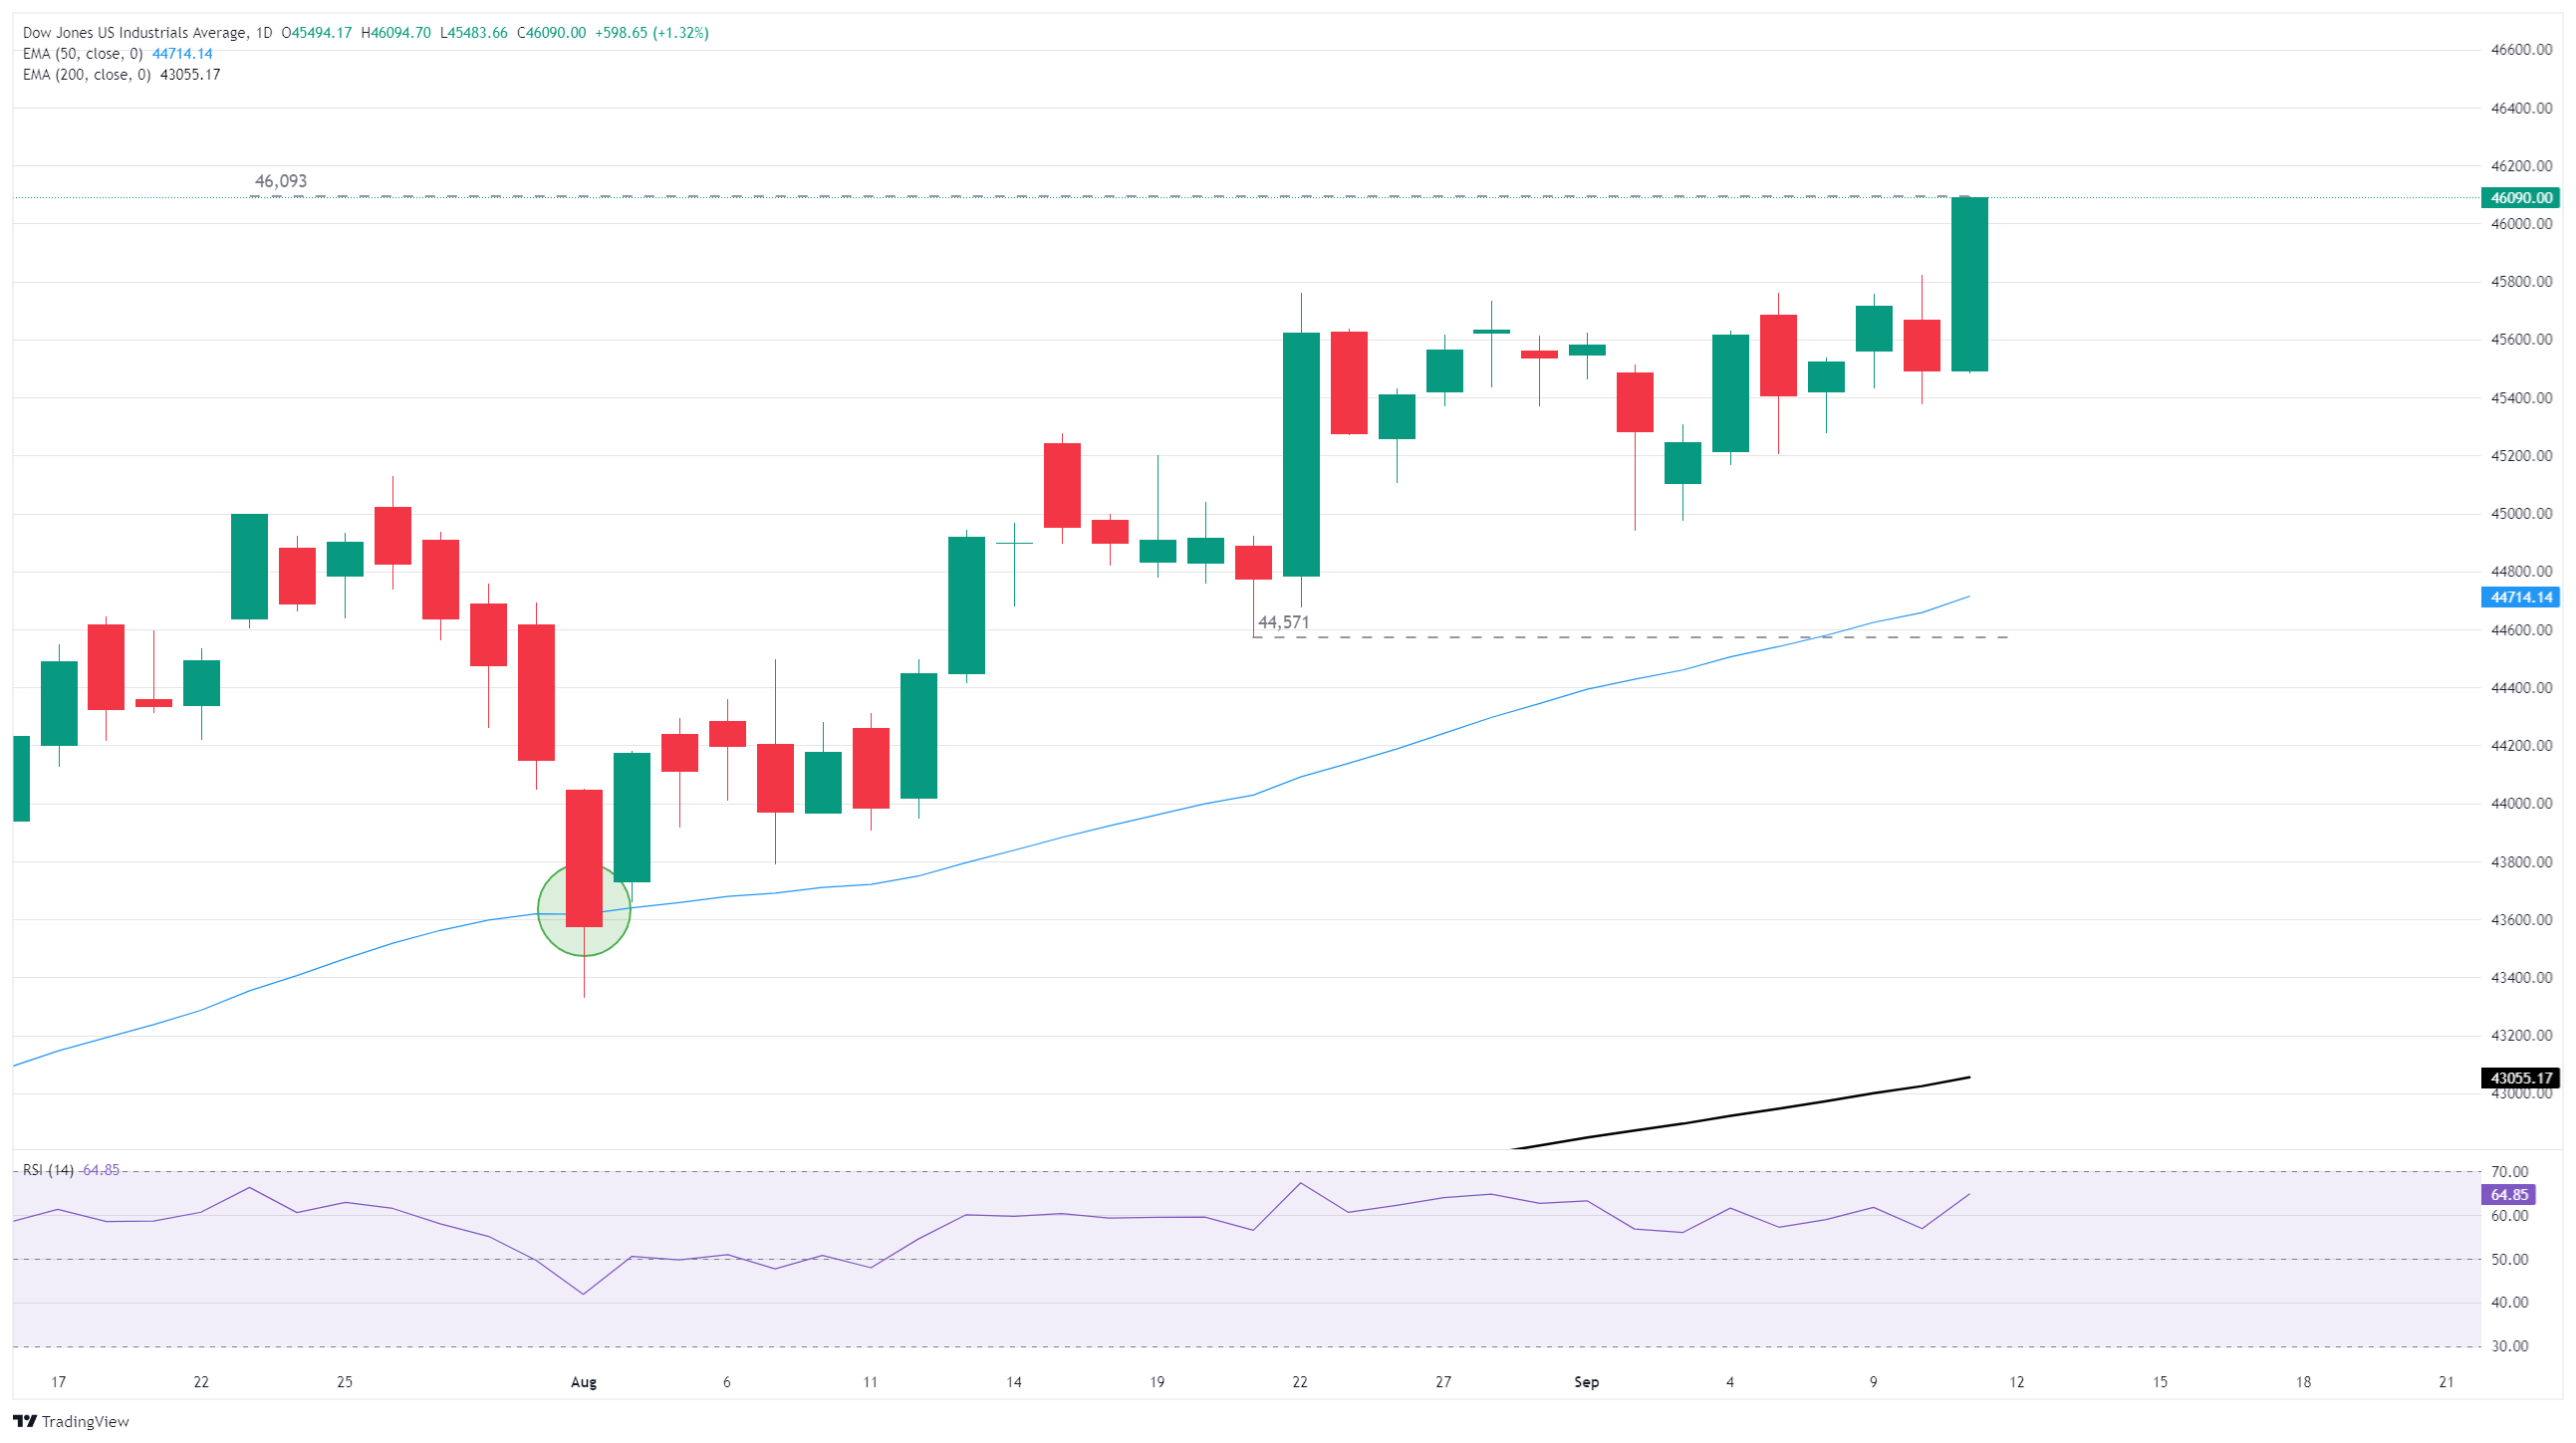
Dow Jones daily chart
Dow Jones FAQs
The Dow Jones Industrial Average, one of the oldest stock market indices in the world, is compiled of the 30 most traded stocks in the US. The index is price-weighted rather than weighted by capitalization. It is calculated by summing the prices of the constituent stocks and dividing them by a factor, currently 0.152. The index was founded by Charles Dow, who also founded the Wall Street Journal. In later years it has been criticized for not being broadly representative enough because it only tracks 30 conglomerates, unlike broader indices such as the S&P 500.
Many different factors drive the Dow Jones Industrial Average (DJIA). The aggregate performance of the component companies revealed in quarterly company earnings reports is the main one. US and global macroeconomic data also contributes as it impacts on investor sentiment. The level of interest rates, set by the Federal Reserve (Fed), also influences the DJIA as it affects the cost of credit, on which many corporations are heavily reliant. Therefore, inflation can be a major driver as well as other metrics which impact the Fed decisions.
Dow Theory is a method for identifying the primary trend of the stock market developed by Charles Dow. A key step is to compare the direction of the Dow Jones Industrial Average (DJIA) and the Dow Jones Transportation Average (DJTA) and only follow trends where both are moving in the same direction. Volume is a confirmatory criteria. The theory uses elements of peak and trough analysis. Dow’s theory posits three trend phases: accumulation, when smart money starts buying or selling; public participation, when the wider public joins in; and distribution, when the smart money exits.
There are a number of ways to trade the DJIA. One is to use ETFs which allow investors to trade the DJIA as a single security, rather than having to buy shares in all 30 constituent companies. A leading example is the SPDR Dow Jones Industrial Average ETF (DIA). DJIA futures contracts enable traders to speculate on the future value of the index and Options provide the right, but not the obligation, to buy or sell the index at a predetermined price in the future. Mutual funds enable investors to buy a share of a diversified portfolio of DJIA stocks thus providing exposure to the overall index.
추천 기사


