
US Dollar steady amid Trump’s trade escalation, cautious Fed
- The US Dollar holds steady above 97.50 after modest losses during Asian trading hours.
- The June FOMC Meeting Minutes indicate that most officials support a rate cut later this year.
- Momentum indicators suggest a weak recovery, with the RSI still below 50 and the MACD improving somewhat.
The US Dollar (USD) holds its footing on Thursday after a weak start to the day, as investors digest fresh tariff threats from US President Donald Trump.
The Greenback slipped during Asian trading hours and retraced some of this week’s gains. It also came under pressure from a sharp drop in Treasury yields, driven by strong demand in Wednesday’s 10-year note auction and signals in the June Federal Open Market Committee (FOMC) Meeting Minutes that interest rates could be lowered later this year.
The US Dollar Index (DXY), which measures the value of the Greenback against a basket of six major currencies, is edging higher during European trading hours. At the time of writing, the index hovers around 97.57, recovering from a daily low of 97.27.
President Trump escalated his trade offensive on Wednesday by releasing a second round of tariff letters on his Truth Social platform. The new letters targeted seven additional countries — including the Philippines, Brunei, Moldova, Algeria, Iraq, Libya, and Sri Lanka — with proposed import tariffs ranging from 20% to 30%. The move adds to the growing list of nations facing potential US trade action and has heightened investor concerns over a broader global trade conflict, lending some support to the US Dollar.
He also issued a stern letter targeting Brazil, with a 50% tariff on its exports, citing the "witch hunt" trial of former Brazilian President Jair Bolsonaro, a right-wing ally of Trump. He wrote a letter to Brazilian President Luiz Inacio Lula da Silva, calling the trial an "international disgrace" and demanding it end "IMMEDIATELY!". While analysts consider this move politically charged, it highlights Trump’s hardline trade stance.
Market Movers: Fed caution, Trump tariff threats and soaring US debt
- Minutes from the June 17-18 FOMC meeting, published Wednesday, showed that most participants judged a rate cut would likely be appropriate at some point this year. They noted that tariff-related inflation may prove temporary or modest, medium- and longer-term inflation expectations remain firmly anchored, and some slowdown in economic activity or labor conditions could occur. Nevertheless, A couple of participants (widely believed to include Governors Christopher Waller and Michelle Bowman) noted that, if the data evolve in line with their expectations, they would be open to considering a reduction in the target range for the policy rate as soon as the next meeting. Still, others preferred holding interest rates steady through year-end, underscoring the Fed’s cautious, data-dependent approach.
- At the June meeting, the FOMC voted unanimously to leave the federal funds target rate unchanged at 4.25%-4.50%. Following the release of the June Minutes, market pricing for a rate cut this month has sharply diminished. According to the CME FedWatch Tool, traders now assign only a 6.7% probability of a July rate cut, a sharp pullback from around 20-25% just a few days ago. Instead, the focus has shifted to the September meeting, where the odds of a 25-basis-point cut stand at nearly 67.3%, reflecting growing expectations for easing later in the year.
- While the Federal Reserve (Fed) maintains a cautious, data-dependent stance, its message is increasingly overshadowed by political pressure. On Wednesday, US President Donald Trump called for an aggressive 3 percentage point rate cut, arguing it would significantly reduce the cost of refinancing the national debt. In a post on Truth Social, he claimed that each percentage point costs the US $360 billion annually, declaring: “Our Fed Rate is AT LEAST 3 Points too high… No Inflation, COMPANIES POURING INTO AMERICA… LOWER THE RATE!!!”
- The US national debt has ballooned to $36.6 trillion, rising by nearly $370 billion in just the past day, according to the latest Treasury data. The sharp spike follows the passage of the so-called “One Big Beautiful Bill,” which lifted the debt ceiling by $5 trillion and paved the way for a surge in government borrowing. Treasury officials are now expected to issue a wave of short-term T-bills to cover the expanding deficit, which could add pressure on yields and complicate the Fed's path to interest rate cuts.
- President Trump officially extended the deadline for his reciprocal tariff campaign to August 1, pushing back the end of the initial 90-day grace period that was set to expire on July 9. As of now, 21 countries have received formal tariff warning letters, with proposed import duties ranging from 20% to 50%. So far, only the UK, Vietnam, and China have reached provisional agreements, while others remain at risk of steep trade penalties. The extended timeline contributes to global trade uncertainty and continues to influence market sentiment around safe-haven flows and risk assets.
- On Wednesday, President Trump reaffirmed plans to impose a 50% tariff on Copper imports, effective August 1, citing national security concerns. In a Truth Social post, he wrote: “Copper is necessary for Semiconductors, Aircraft, Ships, Ammunition, Data Centers, Lithium-ion Batteries, Radar Systems, Missile Defense Systems, and even Hypersonic Weapons... Why did our foolish (and SLEEPY!) ‘Leaders’ decimate this important Industry?” Trump argued that high import dependence threatens US defense readiness and pledged to rebuild a “DOMINANT Copper Industry.” The move adds to the widening scope of Trump’s trade offensive and could disrupt global copper flows and industrial supply chains.
Technical Analysis: DXY holds steady within a falling wedge
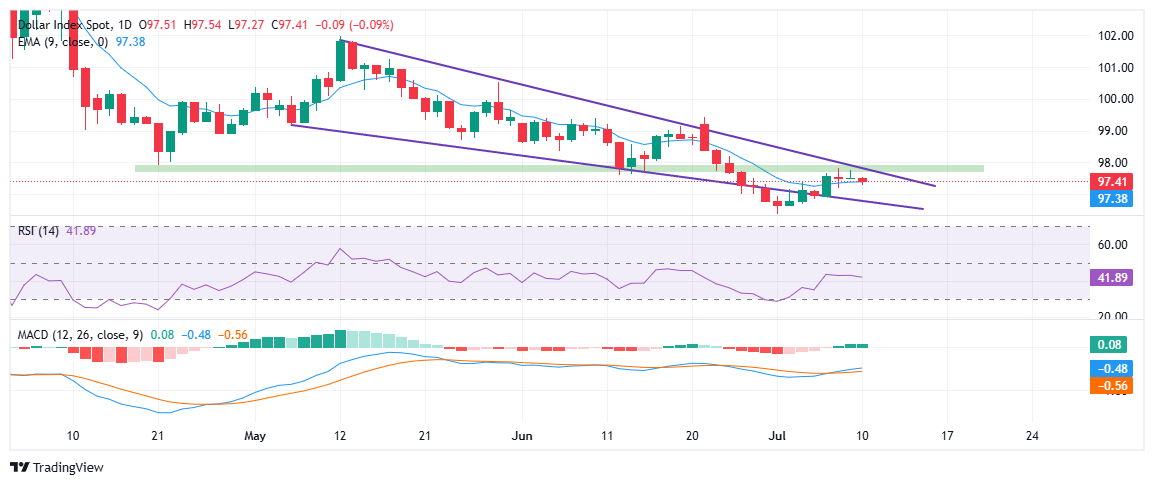
The US Dollar Index (DXY) is hovering near 97.40 on Thursday, consolidating after a bounce from a three-year low of 97.27 earlier this month. The index continues to move within a well-defined falling wedge pattern, a structure often associated with bullish reversal potential.
The 97.80-98.00 zone, which previously acted as support, has now turned into resistance and aligns closely with the upper boundary of the wedge, creating a critical barrier for any upside breakout, while the 9-day EMA at 97.38 acts as a short-term dynamic support zone.
Momentum indicators show tentative recovery but lack strong conviction. The Relative Strength Index (RSI) is hovering around 41.89, recovering from oversold territory but still below the neutral 50 line. Meanwhile, the MACD is showing early signs of a bullish crossover, with the histogram turning slightly positive.
A breakout above 98.00 would signal a potential trend reversal, while sustained weakness below 97.50 could trigger a retest of the lower boundary of the falling wedge pattern near 96.50.
US Dollar PRICE Today
The table below shows the percentage change of US Dollar (USD) against listed major currencies today. US Dollar was the strongest against the Swiss Franc.
| USD | EUR | GBP | JPY | CAD | AUD | NZD | CHF | |
|---|---|---|---|---|---|---|---|---|
| USD | 0.10% | 0.08% | -0.01% | -0.00% | -0.27% | -0.19% | 0.19% | |
| EUR | -0.10% | -0.03% | -0.10% | -0.08% | -0.34% | -0.29% | 0.07% | |
| GBP | -0.08% | 0.03% | -0.12% | -0.05% | -0.31% | -0.24% | 0.10% | |
| JPY | 0.01% | 0.10% | 0.12% | 0.02% | -0.24% | -0.10% | 0.10% | |
| CAD | 0.00% | 0.08% | 0.05% | -0.02% | -0.23% | -0.21% | 0.15% | |
| AUD | 0.27% | 0.34% | 0.31% | 0.24% | 0.23% | 0.02% | 0.45% | |
| NZD | 0.19% | 0.29% | 0.24% | 0.10% | 0.21% | -0.02% | 0.36% | |
| CHF | -0.19% | -0.07% | -0.10% | -0.10% | -0.15% | -0.45% | -0.36% |
The heat map shows percentage changes of major currencies against each other. The base currency is picked from the left column, while the quote currency is picked from the top row. For example, if you pick the US Dollar from the left column and move along the horizontal line to the Japanese Yen, the percentage change displayed in the box will represent USD (base)/JPY (quote).
추천 기사


