
US Dollar steadies ahead of US economic data, Fed Powell’s speech
- The US Dollar trades slightly lower on Thursday ahead of key US economic data releases.
- Traders brace for US Producer Price Index, Retail Sales and Fed Chairman Powell comments.
- The US Dollar Index holds just below 101.00 and could move either way after a volatile Wednesday.
The US Dollar Index (DXY), which tracks the performance of the US Dollar (USD) against six major currencies, is catching its breath and trades slightly lower just below the 101.00 level at the time of writing on Thursday, ahead of a chunky United States (US) economic calendar. The Greenback is not really moving on the back of the geopolitical defusing by US President Donald Trump, who commented during his Middle Eastern trip that nuclear talks with Iran have good hopes, while both Yemen and Syria deserve a second chance.
After Wednesday's sharp volatility affecting the Korean Won (KRW), traders are looking to Asia for possible more currency hiccups and evidence that the Trump administration is seeking a currency deal with countries in the region to devalue the Greenback.
Meanwhile, this Thursday's US economic data could trigger the DXY to move on the back of April’s Producer Price Index (PPI) and the Retail Sales data releases. The cherry on the cake will be comments from Federal Reserve (Fed) Chairman Jerome Powell.
Daily digest market movers: PPI, Retail Sales ahead of Powell’s speech
- The US economic calendar kicks off at 12:30 GMT with a string of data:
- Weekly Initial Jobless Claims are expected to head to 229,000 from 228,00 in the previous week. The Continuing Claims are seen heading to 1.89 million from 1.879 million previously.
- The NY Empire State Manufacturing Index for May is expected to contract further to -10, from -8.1 the previous month. The Philadelphia Fed Manufacturing Survey for May is expected to bounce to -11 from -26.4 in April.
- The monthly April headline Producer Price Index is expected to rise by 0.2% from the 0.4% decline in March. The core PPI is expected to rise 0.3% compared to -0.1% previously.
- April Retail Sales are expected to stay flat at 0% compared to the 1.5% previous release. Retail Sales excluding Cars and Transportation are expected to increase 0.3% compared to the 0.5% rise in March.
- At 12:40 GMT, Federal Reserve Chairman Jerome Powell delivers a speech about the Fed's framework review at the Thomas Laubach Research Conference in Washington DC.
- At 13:15 GMT, the monthly Industrial Production data for April is due. Expectations are for a surge of 0.2% compared to -0.3% in March.
- At 18:05 GMT, Federal Reserve Bank Vice Chair for Supervision Michael Barr will deliver opening remarks (via pre-recorded video) at the 2025 Northeast/Mid-Atlantic Small Business Credit Symposium.
- Equities are slumping across the board on Thursday, though nowhere more than 1% losses to report from Asia, across Europe, and into the US equity futures markets.
- The CME FedWatch tool shows the chance of an interest rate cut by the Federal Reserve in June’s meeting at just 8.2%. Further ahead, the July 30 decision sees odds for rates being lower than current levels at 38.6%.
- The US 10-year yields trade around 4.51%, and keep ticking higher, nearing a one-month high.
US Dollar Index Technical Analysis: Caught between two forks
The US Dollar Index saw the pivotal technical level at 100.22 hold firmly, delivering a small bounce for the Greenback on Wednesday. With the slide below 101.00, the DXY looks well-positioned to go either way, driven by the US economic data releases later this Thursday. A return to 101.90 could materialize, while the downside support at 100.22 is not far off.
On the upside, 101.90 is the first big resistance again. It already acted as a pivotal level throughout December 2023 and as a base for the inverted head-and-shoulders (H&S) formation during the summer of 2024. In case Dollar bulls push the DXY even higher, the 55-day Simple Moving Average (SMA) at 102.06 comes into play.
On the other hand, the previous resistance at 100.22 is now acting as firm support, followed by the year-to-date low of 97.91 and the pivotal level of 97.73. Further below, a relatively thin technical support comes in at 96.94 before looking at the lower levels of this new price range. These would be at 95.25 and 94.56, meaning fresh lows not seen since 2022.
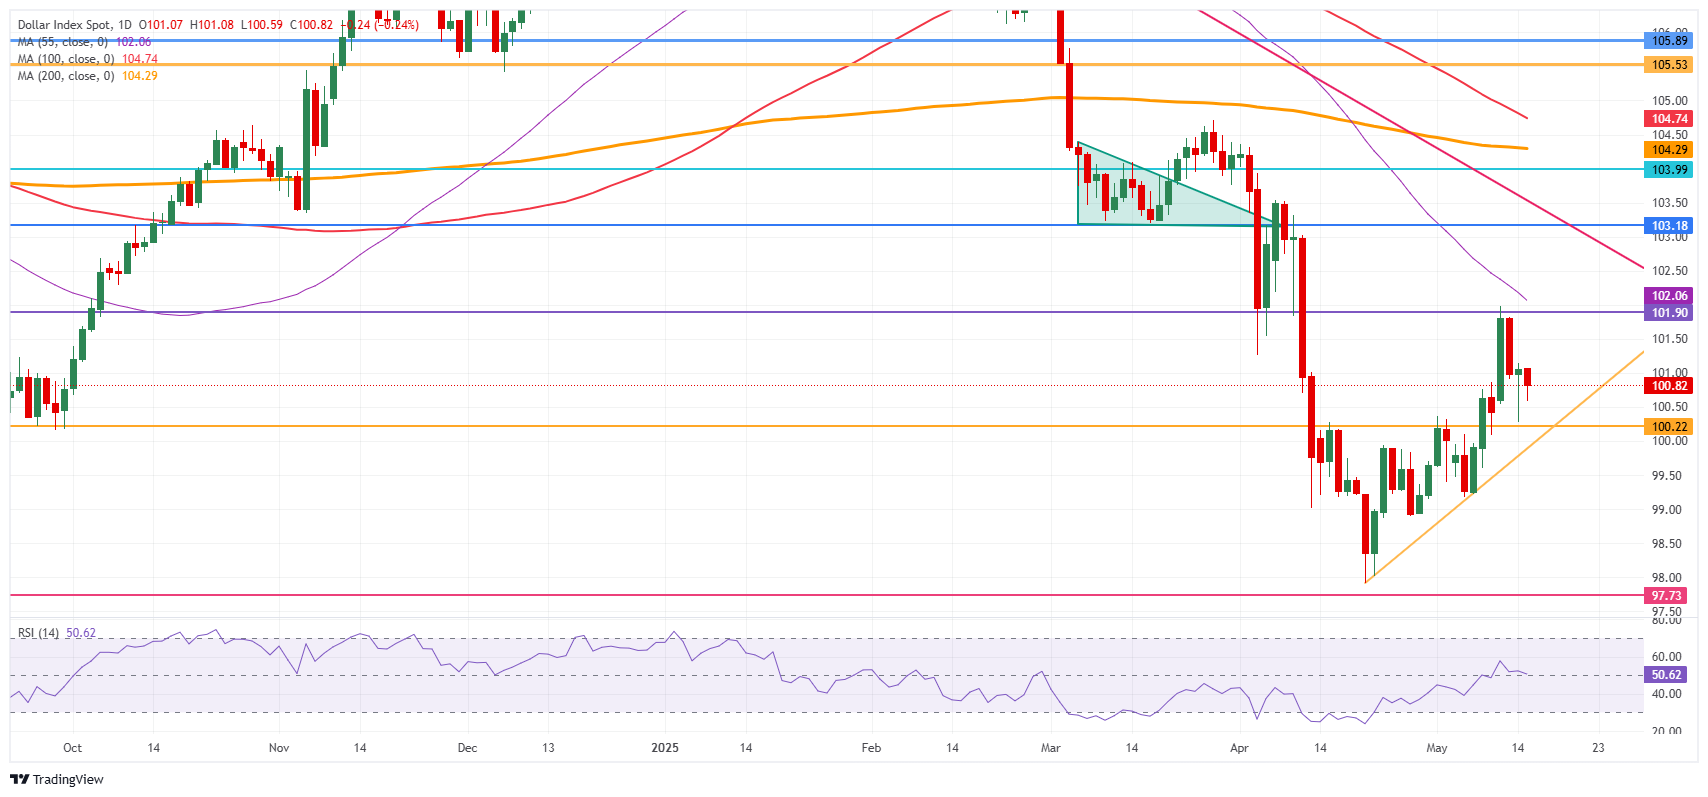
US Dollar Index: Daily Chart
US-China Trade War FAQs
Generally speaking, a trade war is an economic conflict between two or more countries due to extreme protectionism on one end. It implies the creation of trade barriers, such as tariffs, which result in counter-barriers, escalating import costs, and hence the cost of living.
An economic conflict between the United States (US) and China began early in 2018, when President Donald Trump set trade barriers on China, claiming unfair commercial practices and intellectual property theft from the Asian giant. China took retaliatory action, imposing tariffs on multiple US goods, such as automobiles and soybeans. Tensions escalated until the two countries signed the US-China Phase One trade deal in January 2020. The agreement required structural reforms and other changes to China’s economic and trade regime and pretended to restore stability and trust between the two nations. However, the Coronavirus pandemic took the focus out of the conflict. Yet, it is worth mentioning that President Joe Biden, who took office after Trump, kept tariffs in place and even added some additional levies.
The return of Donald Trump to the White House as the 47th US President has sparked a fresh wave of tensions between the two countries. During the 2024 election campaign, Trump pledged to impose 60% tariffs on China once he returned to office, which he did on January 20, 2025. With Trump back, the US-China trade war is meant to resume where it was left, with tit-for-tat policies affecting the global economic landscape amid disruptions in global supply chains, resulting in a reduction in spending, particularly investment, and directly feeding into the Consumer Price Index inflation.
추천 기사


