


Two earnings shocks cancel inside the Dow Jones Industrial Average
- DJIA trades near 52,500 after a 600-point round trip off the 52,000 handle.
- Apple down 10%, Amazon up 15%, both inside the index.
- The 30-year yield holds 2007 highs into a payrolls week.
The Dow Jones Industrial Average trades just beneath 52,500 on Friday, up around 230 points and roughly 1.6% under the record set early in July. That mild figure covers a session that ran close to 600 points, from a high in the 52,600 area down to a low fractionally beneath the 52,000 handle, before recovering more than 450 points inside two hours. No new information arrived between those two extremes.
Two earnings shocks, one index, almost no net
Apple (AAPL) trades around 10% lower after a fiscal third quarter in which revenue beat expectations on a 22% jump in iPhone sales, only for a shortfall in services to take the shares down anyway. Amazon (AMZN) trades over 15% higher on a second-quarter revenue beat carried by its cloud business, read as confirmation that the capital-spending cycle behind the technology trade is intact. Both names sit inside these thirty.
The index is price weighted, so a component contributes Dollars of share-price movement rather than percentage points of market value. Two names trading in a broadly similar price band, moving roughly the same distance in opposite directions, therefore subtract and add close to the same number of index points. The largest single-name earnings dispersion of the quarter nets out to a gain of less than half a percent.
The structure blamed all summer for this index lagging the technology trade is the same structure that neutralised the biggest earnings shock of the week. Five of the seven largest technology names now sit inside the average, Meta Platforms (META) and Tesla (TSLA) the absentees, so the gap between the benchmarks is weighting method and breadth rather than membership.
The long end declines to ratify it
The 30-year Treasury yield holds near its highest level since 2007 and extended again through Friday, while the 10-year sits above 4.7% and its own highest since January 2025. Both moves happened with equities bid. Two days after a fifth consecutive hold, decided nine to three with three regional presidents dissenting for a quarter-point increase, the long end is still selling.
The dissent is the tell, because a committee that will not move ahead of the data leaves the inflation risk sitting with whoever owns the bonds. The chair conceded this week that the central bank has no instant remedy for five years of above-target prices, and long-dated investors took the admission at face value and repriced thirty-year money accordingly.
A long bond at levels last seen before the financial crisis is a statement about the price of money over decades, not a verdict on next quarter's earnings. An equity index within a couple of percent of its record and a curve pricing tightening describe two different economies, and the war that keeps Crude Oil bid reconciles them in the bond market's favour.
Every American print landed on the hawkish side
The Employment Cost Index (ECI) for the second quarter, out at 12:30 GMT, rose 0.9% against a 0.8% consensus and matched the prior quarter. That is the cleanest quarterly read on labour costs the Federal Reserve gets, and it beat. The Chicago Purchasing Managers Index (PMI) at 13:45 GMT followed with 57.6 against 56, up from 56.7.
University of Michigan (UoM) sentiment then printed 55.2 against a 54 consensus at 14:00 GMT, with the expectations index at 55.4 against the same 54, and that beat is what carried the headlines. The inflation components did not move at all. One-year expectations held at 4.2% and the five-year at 3.3%, both in line and both unchanged on the month.
Sentiment improving while inflation expectations stay pinned is not the disinflation story it was reported as, and the tape worked that out. A regional Fed president who dissented for a quarter-point increase on Wednesday spoke into the same 14:00 GMT block, scoring hawkish well above the speaker's own running average, and the session low printed inside the following quarter hour.
A payrolls week follows
The Institute for Supply Management (ISM) manufacturing survey opens Monday at 14:00 GMT with a 54 consensus from 53.3, and its prices-paid component is seen easing to 70 from 73. The services survey lands Wednesday at 14:00 GMT at 54.2 from 54. Given where the long end is trading, the prices-paid readings matter more than either headline.
The private payrolls estimate arrives Wednesday at 12:15 GMT with a 75K consensus from 98K, and preliminary second-quarter productivity and unit labour costs follow on Thursday. Those two re-test from the output side the same wage question the Employment Cost Index raised on Friday.
Nonfarm payrolls land Friday 7 August at 12:30 GMT with a 91K consensus after June's 57K, the unemployment rate seen ticking up to 4.3% from 4.2%, and average hourly earnings at 0.3% MoM and 3.5% YoY. There is no meeting in August, so two payroll reports arrive before the 16 September decision. A soft number does not buy relief here, because the front end is pricing the next move as an increase.
Levels and bias
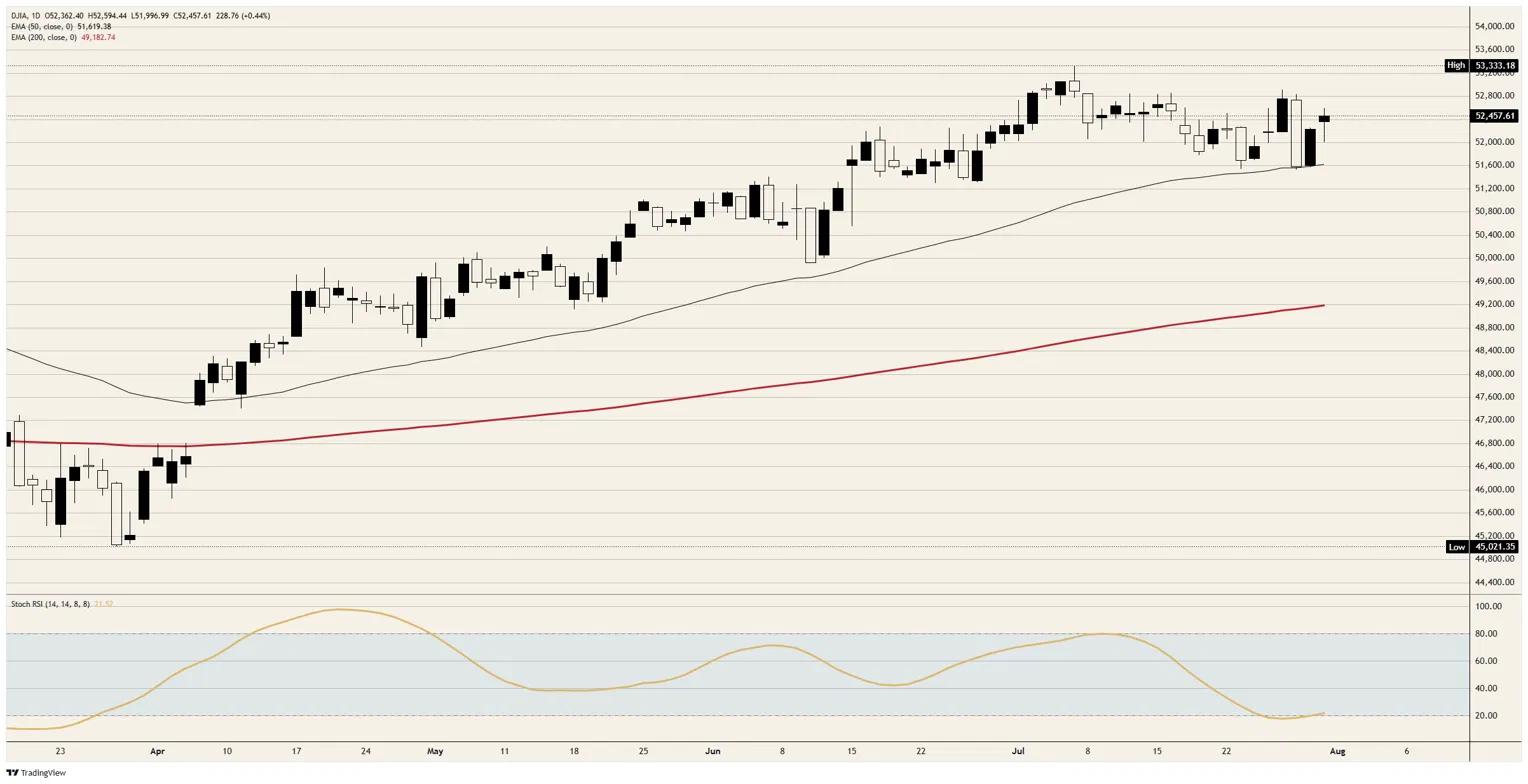
Resistance: The session high in the 52,600 area is the first ceiling, and it is the same shelf that capped the tape through late July. Above it the record just over 53,300 is the only mark left on the chart.
Support: The 52,000 handle held on the flush and is now the line that matters, with 51,800 beneath it and the 50-day Exponential Moving Average (EMA) near 51,600 rising into the price.
Bias: Bullish while the 52,000 handle holds. The daily Stochastic Relative Strength Index (Stoch RSI) near 21 is oversold and turning up off Wednesday's flush, the 5-minute reading above 90 argues the immediate bounce is stretched, and a daily close beneath 52,000 invalidates and exposes the 50-day EMA.
Dow Jones daily chart
Dow Jones FAQs
The Dow Jones Industrial Average, one of the oldest stock market indices in the world, is compiled of the 30 most traded stocks in the US. The index is price-weighted rather than weighted by capitalization. It is calculated by summing the prices of the constituent stocks and dividing them by a factor, currently 0.152. The index was founded by Charles Dow, who also founded the Wall Street Journal. In later years it has been criticized for not being broadly representative enough because it only tracks 30 conglomerates, unlike broader indices such as the S&P 500.
Many different factors drive the Dow Jones Industrial Average (DJIA). The aggregate performance of the component companies revealed in quarterly company earnings reports is the main one. US and global macroeconomic data also contributes as it impacts on investor sentiment. The level of interest rates, set by the Federal Reserve (Fed), also influences the DJIA as it affects the cost of credit, on which many corporations are heavily reliant. Therefore, inflation can be a major driver as well as other metrics which impact the Fed decisions.
Dow Theory is a method for identifying the primary trend of the stock market developed by Charles Dow. A key step is to compare the direction of the Dow Jones Industrial Average (DJIA) and the Dow Jones Transportation Average (DJTA) and only follow trends where both are moving in the same direction. Volume is a confirmatory criteria. The theory uses elements of peak and trough analysis. Dow’s theory posits three trend phases: accumulation, when smart money starts buying or selling; public participation, when the wider public joins in; and distribution, when the smart money exits.
There are a number of ways to trade the DJIA. One is to use ETFs which allow investors to trade the DJIA as a single security, rather than having to buy shares in all 30 constituent companies. A leading example is the SPDR Dow Jones Industrial Average ETF (DIA). DJIA futures contracts enable traders to speculate on the future value of the index and Options provide the right, but not the obligation, to buy or sell the index at a predetermined price in the future. Mutual funds enable investors to buy a share of a diversified portfolio of DJIA stocks thus providing exposure to the overall index.
추천 기사


