


Dow Jones Industrial Average finds out the ceasefire was load-bearing
- US inflation hit a three-year high on war-driven energy costs while the core reading came in soft.
- Trump threatened heavier strikes on Iran, leaving the truce and the Hormuz reopening in doubt.
- The index posted its sharpest daily fall since printing a record high days earlier.
The Dow Jones Industrial Average (DJIA) fell about 1.2% on Wednesday, a near 600-point slide that settled just under 50,250 after tagging session lows around 50,150. The awkward part is that the scheduled risk behaved: May Consumer Price Index (CPI) data landed on forecast and leaned friendly underneath, yet the index still booked its heaviest loss since topping out close to 51,400 early this month. The damage came from the unscheduled risk, a ceasefire with Iran that spent Wednesday visibly coming apart, taking the disinflation trade with it.
Hot headline, polite core
Headline CPI rose 0.5% MoM and 4.2% YoY, the hottest annual rate since April 2023 and a world away from January's 2.4%. Energy did the damage, jumping almost 4% on the month and driving over 60% of the gain, with gasoline up roughly 40% YoY. Beneath the war premium the report was almost polite: core CPI rose just 0.2% MoM against forecasts near 0.3%, the annual core rate sits at 2.9%, and core goods prices outright fell as tariff pass-through fades. The textbook read is an energy tax rather than a spiral, and rates traders trimmed hike bets accordingly.
No airbag from the Fed
The Federal Reserve (Fed) meets next week and is priced to do nothing, with the live debate now whether the next move is a hike before year-end rather than when the first cut arrives. A soft core print shaves that hike risk at the margin, but no central bank eases into a 4-handle headline while household inflation expectations in the University of Michigan (UoM) survey approach 5%. That leaves the index carrying war risk with no monetary cushion, which, more than the CPI arithmetic, is what Wednesday was about.
The Strait writes the next CPI
The escalation sequence was grim even by the standards of a war past its hundredth day. A US Apache helicopter went down near the Strait of Hormuz at the start of the week, Washington blamed an Iranian drone and struck air defense and radar sites around Bandar Abbas and Qeshm Island, and Iran answered against US bases in Bahrain and Kuwait. By Wednesday President Trump was telling reporters Tehran had stalled negotiations long enough, would be made to pay for it, and should expect far heavier strikes. Every forecast that has inflation rolling over later this year assumes Hormuz reopens and gasoline futures keep sliding, so renewed fire inside the strait is not a sideshow but the whole show. This column has treated the truce as a press release rather than a settlement, and with West Texas Intermediate (WTI) back near $90 and Brent pushing toward $93, the Crude Oil market now agrees.
A failed bounce and a close on the lows
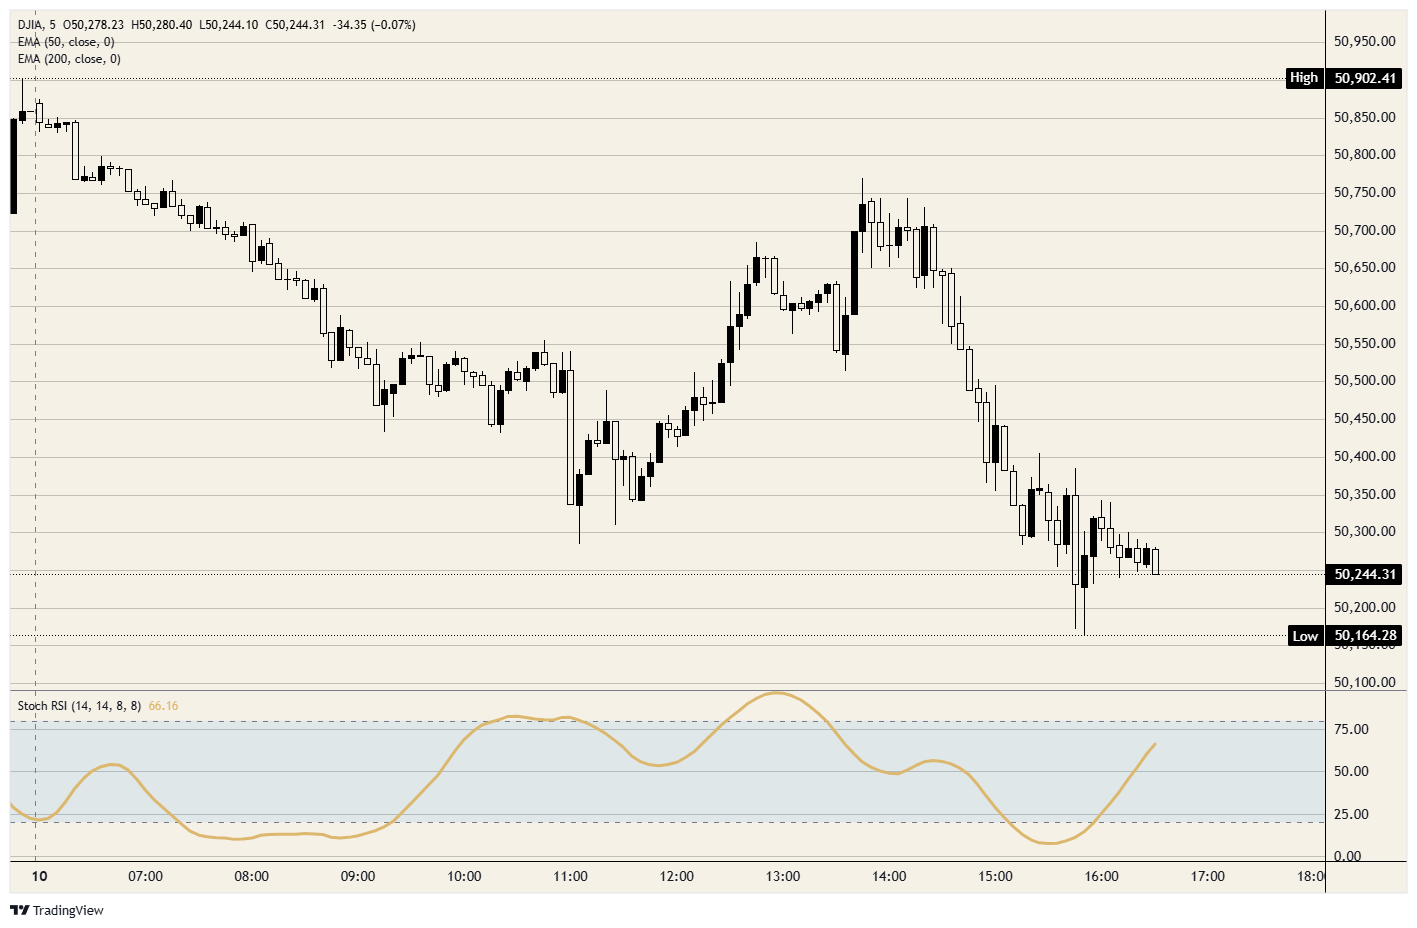
The daily uptrend is bruised rather than broken, with the index up from around 45,000 in April to a record close to 51,400 and still comfortably above the 50-day Exponential Moving Average (EMA) near 49,700. The session itself is the worry. The Dow opened just shy of 50,900, bled lower through the morning, based near 50,350, then staged a recovery that stalled short of 50,800 before a late slide left the close pinned at the bottom of the range. An afternoon rally sold to fresh lows is distribution, not dip-buying, and a daily Stochastic Relative Strength Index (Stoch RSI) rolling over from overbought says momentum sits with the sellers.
Thursday's PPI keeps the heat on
The calendar offers no breathing room either, with Thursday at 12:30 GMT bringing May Producer Price Index (PPI) figures: the headline is seen up 0.7% MoM after 1.4% in April with the annual rate climbing toward 6.4%, and core PPI is forecast near 0.5% MoM and 5.4% YoY, pipeline pressure that keeps the hike debate alive. Weekly jobless claims land alongside, seen close to 219K after 225K. Friday at 14:00 GMT delivers preliminary June UoM sentiment, where the 1-year inflation expectations series, last at 4.8%, is the line item the Fed genuinely fears.
Upside, downside, bias
Upside: a credible de-escalation headline that reclaims 50,750 and then the broken shelf near 50,900 puts a retest of the record around 51,400 back in view. Nothing in Wednesday's tape earns that without help from the diplomats.
Downside: a daily close under 50,150 exposes the 50,000 handle, and losing that drags the 50-day EMA near 49,700 into play as the line between a pullback and a trend question.
Bias: lower while the strait stays shut. The soft core print was the best news the index got all day, and it bought nothing, which tells you what is setting the price.
Dow Jones 5-minute chart
Dow Jones FAQs
The Dow Jones Industrial Average, one of the oldest stock market indices in the world, is compiled of the 30 most traded stocks in the US. The index is price-weighted rather than weighted by capitalization. It is calculated by summing the prices of the constituent stocks and dividing them by a factor, currently 0.152. The index was founded by Charles Dow, who also founded the Wall Street Journal. In later years it has been criticized for not being broadly representative enough because it only tracks 30 conglomerates, unlike broader indices such as the S&P 500.
Many different factors drive the Dow Jones Industrial Average (DJIA). The aggregate performance of the component companies revealed in quarterly company earnings reports is the main one. US and global macroeconomic data also contributes as it impacts on investor sentiment. The level of interest rates, set by the Federal Reserve (Fed), also influences the DJIA as it affects the cost of credit, on which many corporations are heavily reliant. Therefore, inflation can be a major driver as well as other metrics which impact the Fed decisions.
Dow Theory is a method for identifying the primary trend of the stock market developed by Charles Dow. A key step is to compare the direction of the Dow Jones Industrial Average (DJIA) and the Dow Jones Transportation Average (DJTA) and only follow trends where both are moving in the same direction. Volume is a confirmatory criteria. The theory uses elements of peak and trough analysis. Dow’s theory posits three trend phases: accumulation, when smart money starts buying or selling; public participation, when the wider public joins in; and distribution, when the smart money exits.
There are a number of ways to trade the DJIA. One is to use ETFs which allow investors to trade the DJIA as a single security, rather than having to buy shares in all 30 constituent companies. A leading example is the SPDR Dow Jones Industrial Average ETF (DIA). DJIA futures contracts enable traders to speculate on the future value of the index and Options provide the right, but not the obligation, to buy or sell the index at a predetermined price in the future. Mutual funds enable investors to buy a share of a diversified portfolio of DJIA stocks thus providing exposure to the overall index.
추천 기사


