


Bitcoin vs Gold: BTC and Gold struggle to gain momentum despite US-Iran truce
- Market focus shifts to Wednesday’s Fed rate decision after the US and Iran agreed to pause strikes.
- Bitcoin slides below the critical $65,000, weighed down by a weakening technical structure and capital outflows.
- Gold trades broadly sideways between support at $4,000 and resistance at $4,100.
Market participants are changing gears on Monday from the war between the United States (US) and Iran in the Middle East to the anticipated Federal Reserve (Fed) interest rate decision. Meanwhile, Bitcoin (BTC) and Gold (XAU) are losing momentum, with BTC slipping below the pivotal $65,000 level while XAU remains sideways in the $4,000-$4,100 range.
US and Iran suspend strikes ahead of Fed rate decision
The US has paused military operations, with the US ambassador to the United Nations (UN) confirming that President Trump is prioritizing diplomatic engagement with Iran, according to CNN.
In response, Iran also suspended retaliatory strikes on US military bases in the region. While some sources reported concerns over depleted US ammunition reserves, Trump denied these claims.
However, a report by CBS News notes that the Iranian regime insists it has not engaged in talks with the US, apart from ongoing discussions with Oman aimed at creating "mechanisms regarding maritime traffic" in the Strait of Hormuz.
Market participants are currently pricing in a 64% chance that the Federal Open Market Committee (FOMC) will leave interest rates unchanged in the 3.50%-3.75% range on Wednesday.
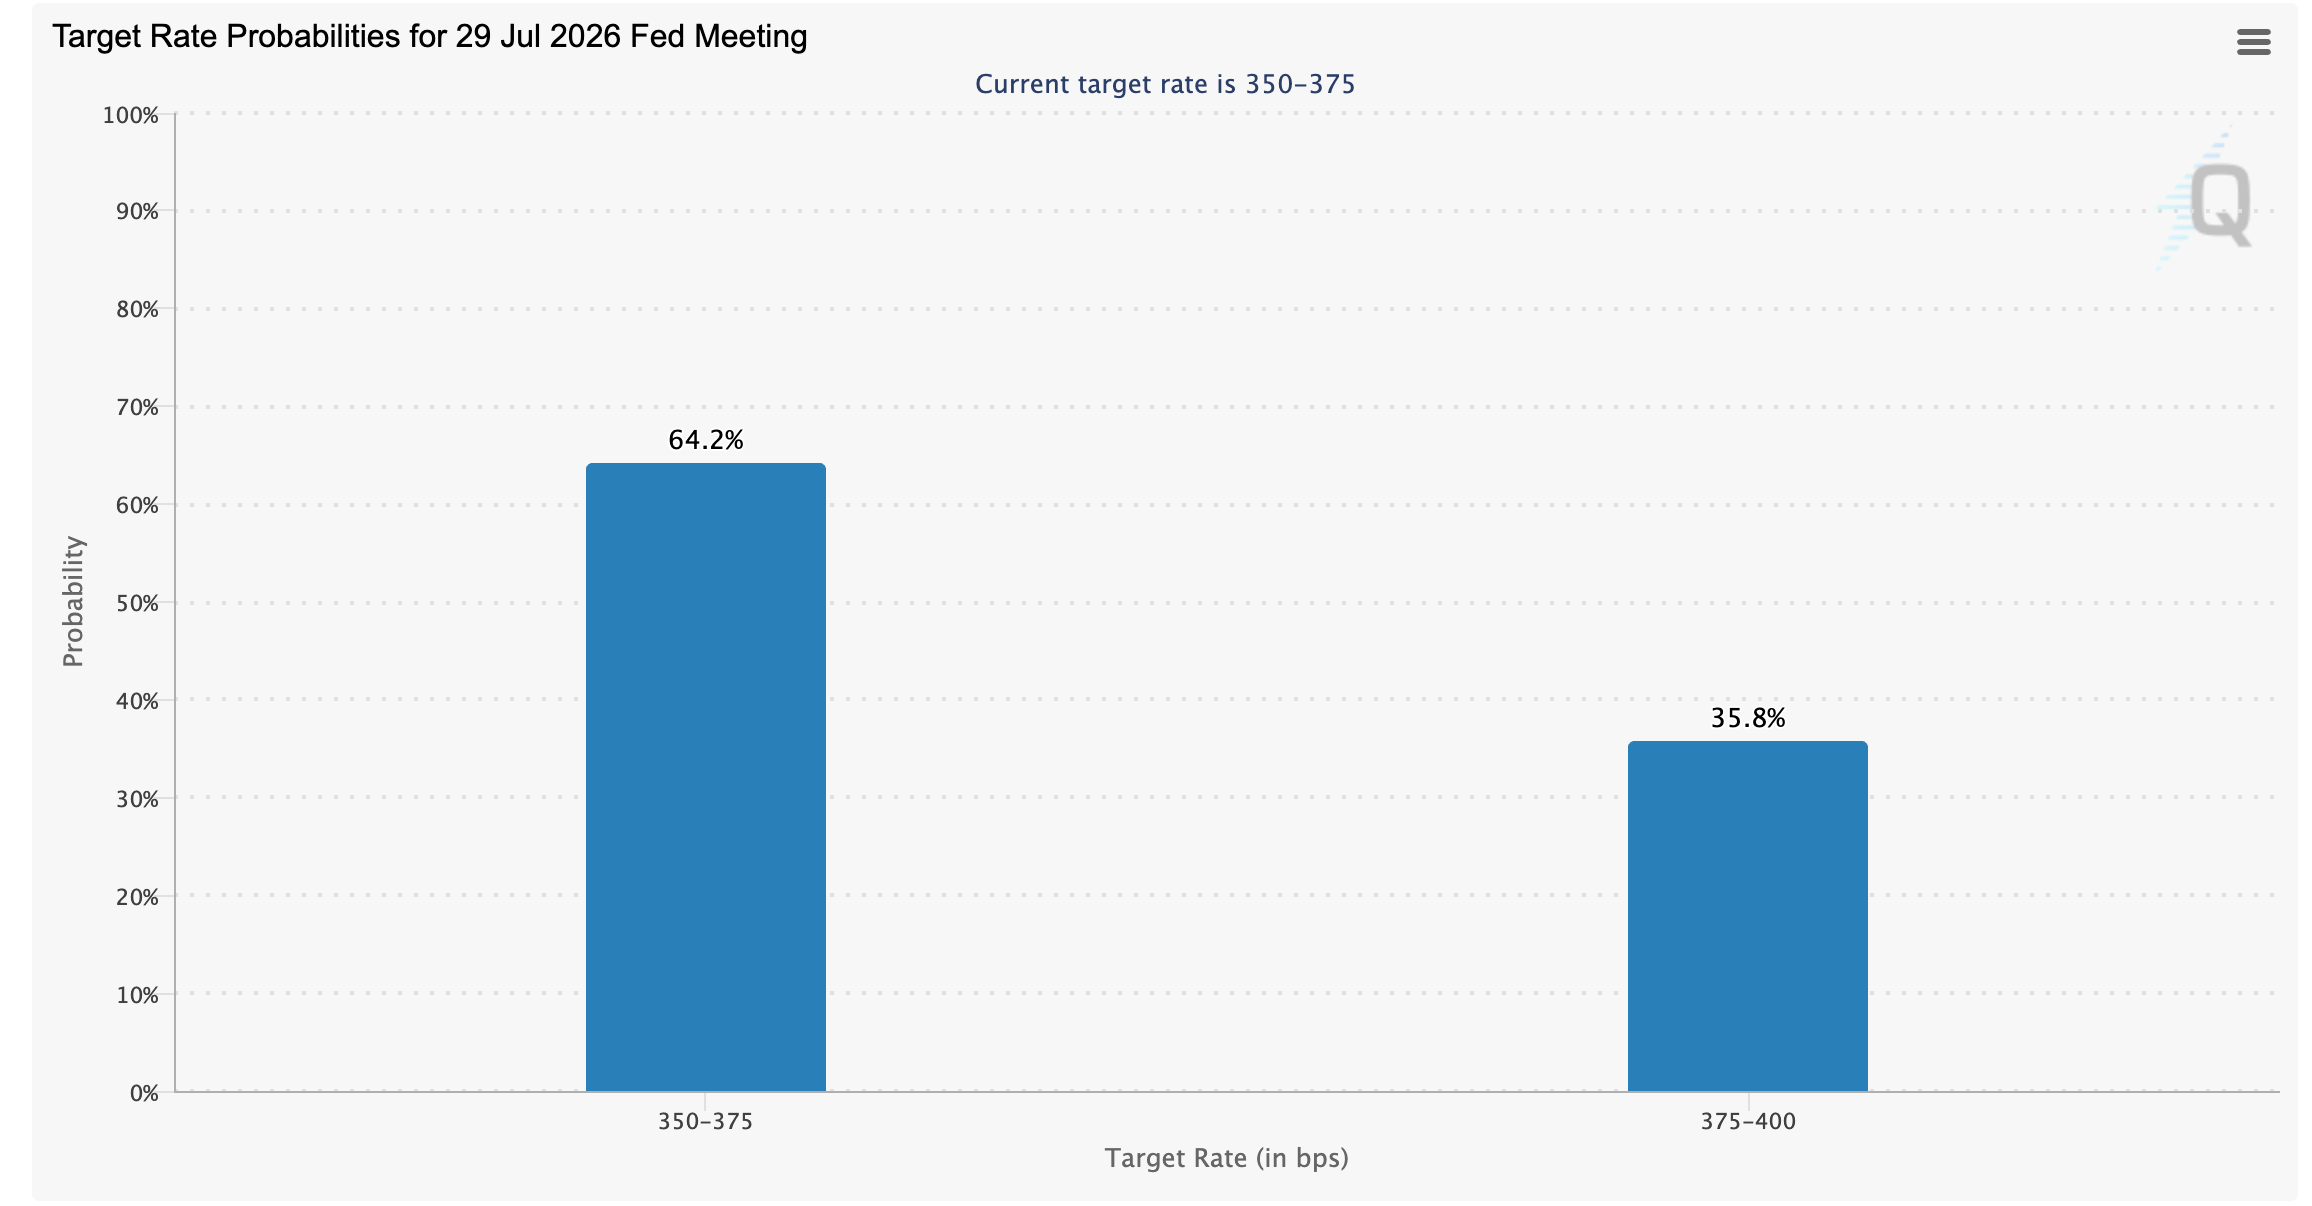
Recent macro reports, including the Consumer Price Index (CPI), signaled that inflation in the US cooled in June, giving the Fed some breathing room and bolstering the case for holding rates steady.
However, a 64% chance suggests that a rate hike may not be off the table, especially after Oil prices jumped above $90 last week before easing to $82 on Monday.
Loretta Mester, former Cleveland Fed President, said in an interview that the central bank officials “are going to have to ask themselves whether policy is at the right level to get inflation moving back down to 2%. Chair Warsh has been pretty vocal on saying that they're not going to tolerate inflation.”
Technical outlook: Bitcoin edges lower as headwinds surge
Bitcoin trades at $64,648, holding below the main moving averages and keeping a bearish near-term bias despite stabilizing momentum. The spot price is capped by the 50-day Exponential Moving Average (EMA) near $65,067, while the 100-day and 200-day EMAs around $67,759 and $73,465 remain well above, reinforcing a broader corrective tone.
The Relative Strength Index (RSI) hovers just above the midline on the daily chart, hinting at neutral-to-slightly positive momentum, but the marginally positive Moving Average Convergence Divergence (MACD) has been fading, suggesting upside attempts could struggle under the current EMA stack.
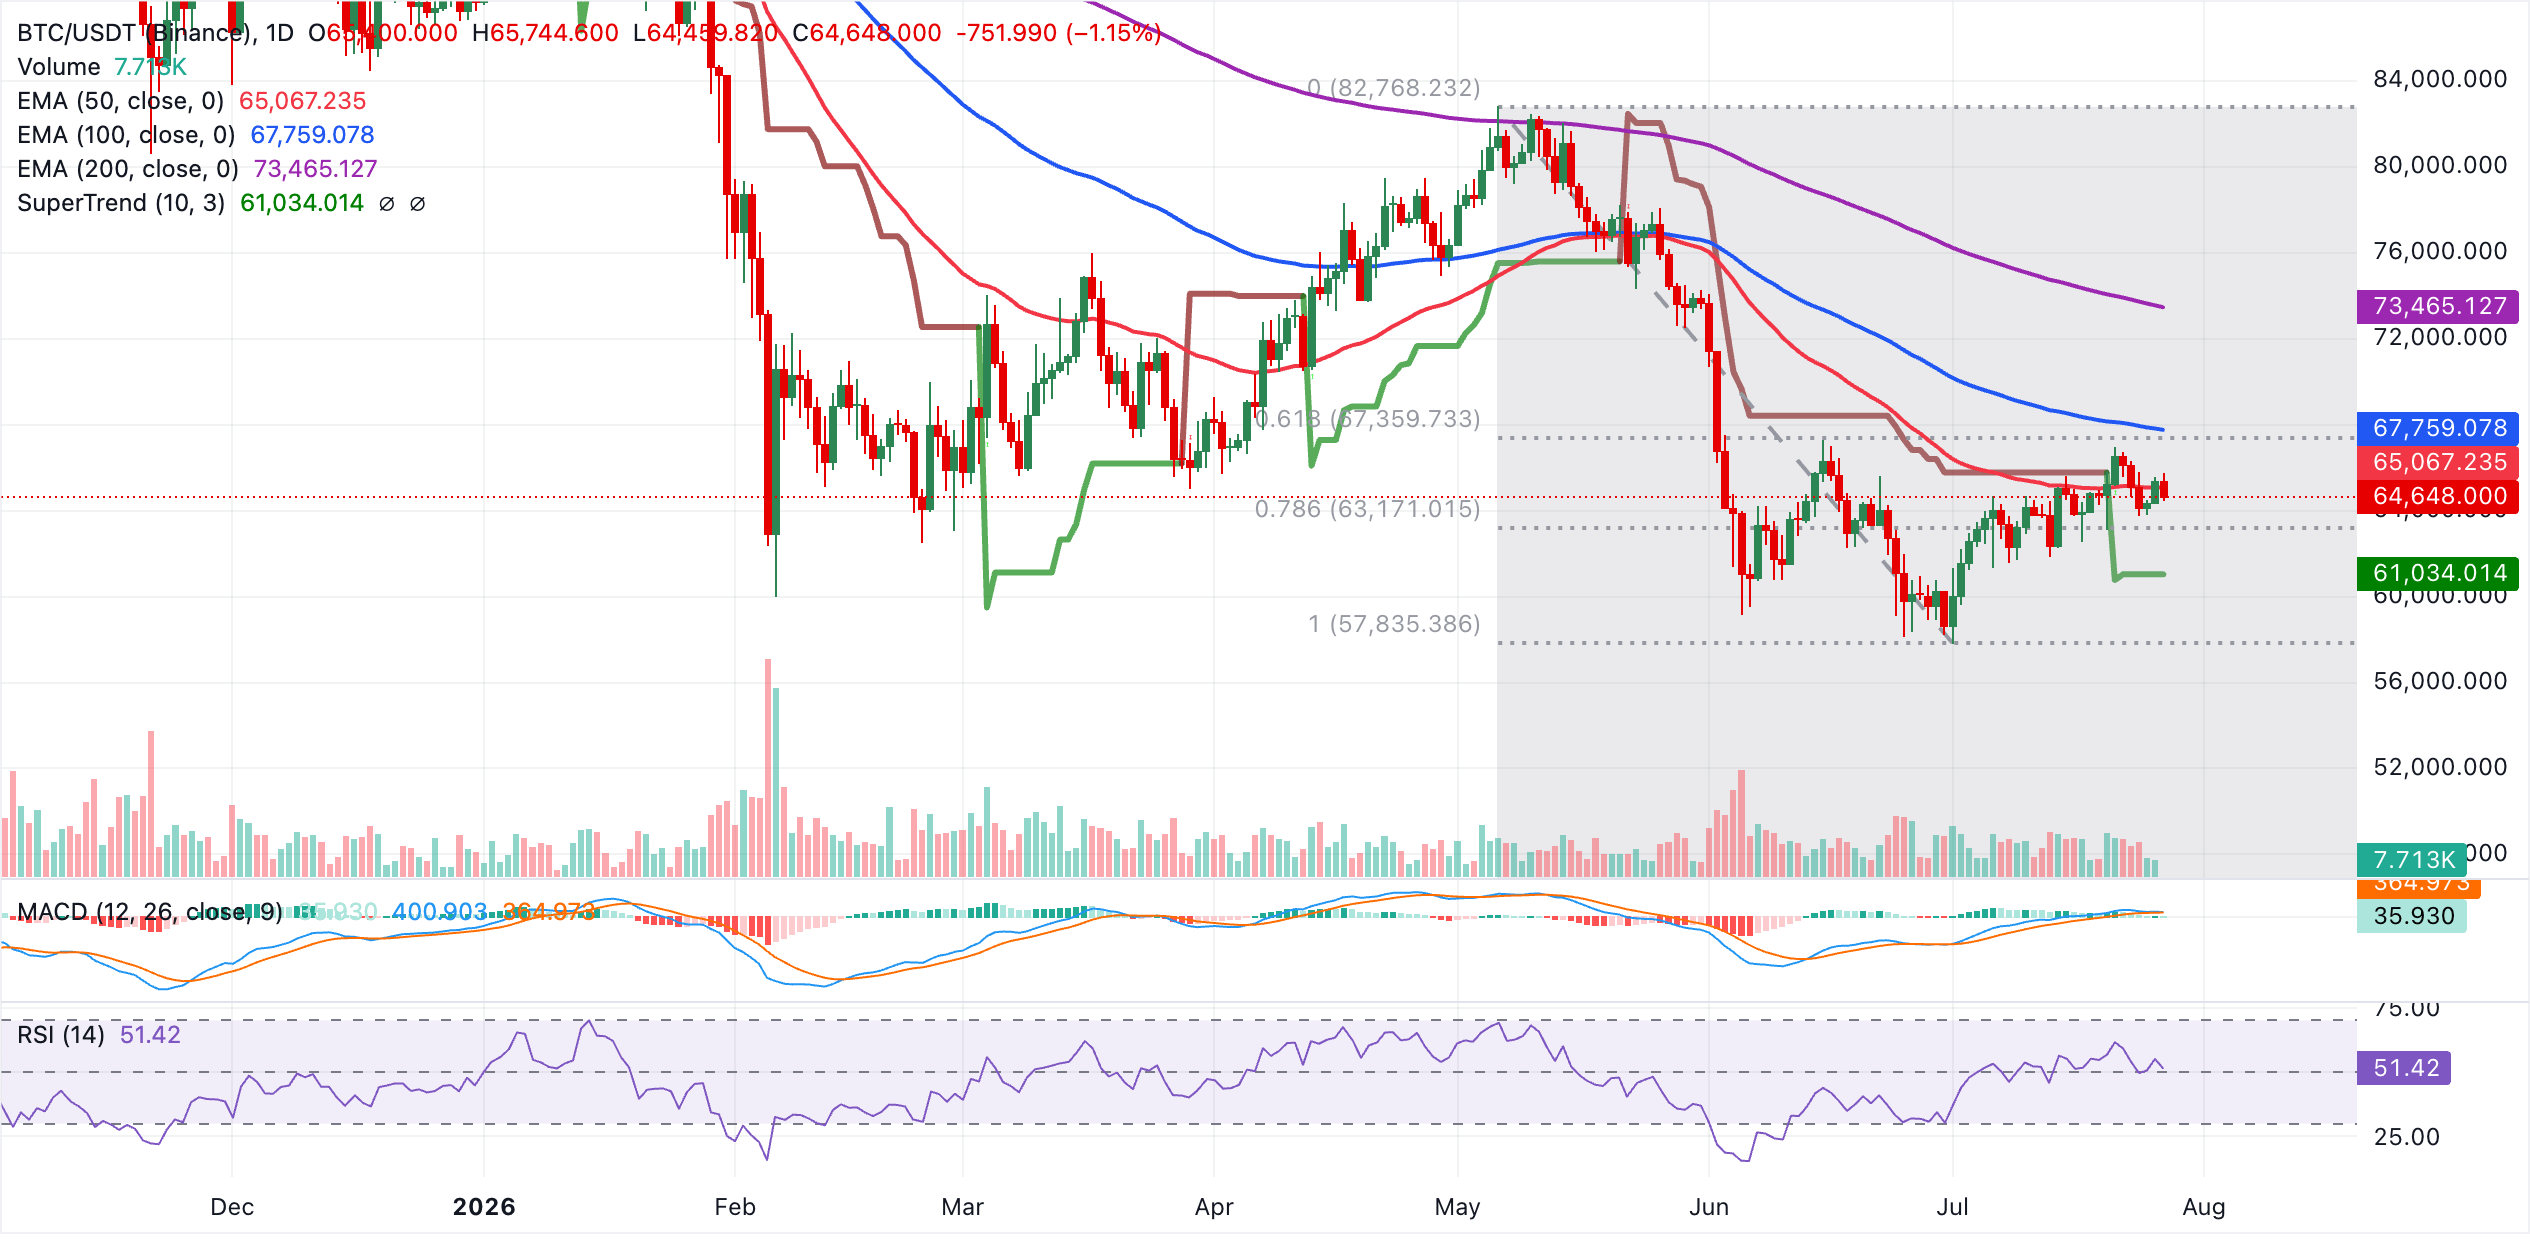
Immediate support is aligned with the 78.6% Fibonacci Retracement of the latest swing at roughly $63,171, ahead of the daily SuperTrend baseline near $61,034 and a deeper structural floor at the prior cycle low region around $57,835. On the topside, initial resistance is seen at the 50-day EMA at $65,067. A daily close above this barrier would be needed to ease bearish pressure and expose the Fibonacci 61.8% Retracement at $67,360, followed by the 100-day EMA at $67,759.
Further up, the 50% Fibonacci retracement near $70,302 and the 38.2% Fibonacci level around $73,244 sit close to the 200-day EMA at $73,465, forming a dense medium-term supply zone that would likely cap any extended recovery for now.
Technical analysis: Gold pares losses amid broad consolidation
Gold trades at $4,074, keeping a bearish near-term bias as spot holds beneath a dense cap of moving averages. The spot price is below the 50-day EMA at $4,217, the 200-day EMA at $4,298 and the 100-day EMA at $4,352, suggesting rallies are being sold while the broader downtrend from the established descending resistance line remains intact.
The MACD indicator is positive but flattening on the daily chart, and the RSI hovers in mid-range territory, hinting that upside momentum is tentative and insufficient for a sustained breakout through overhead levels.
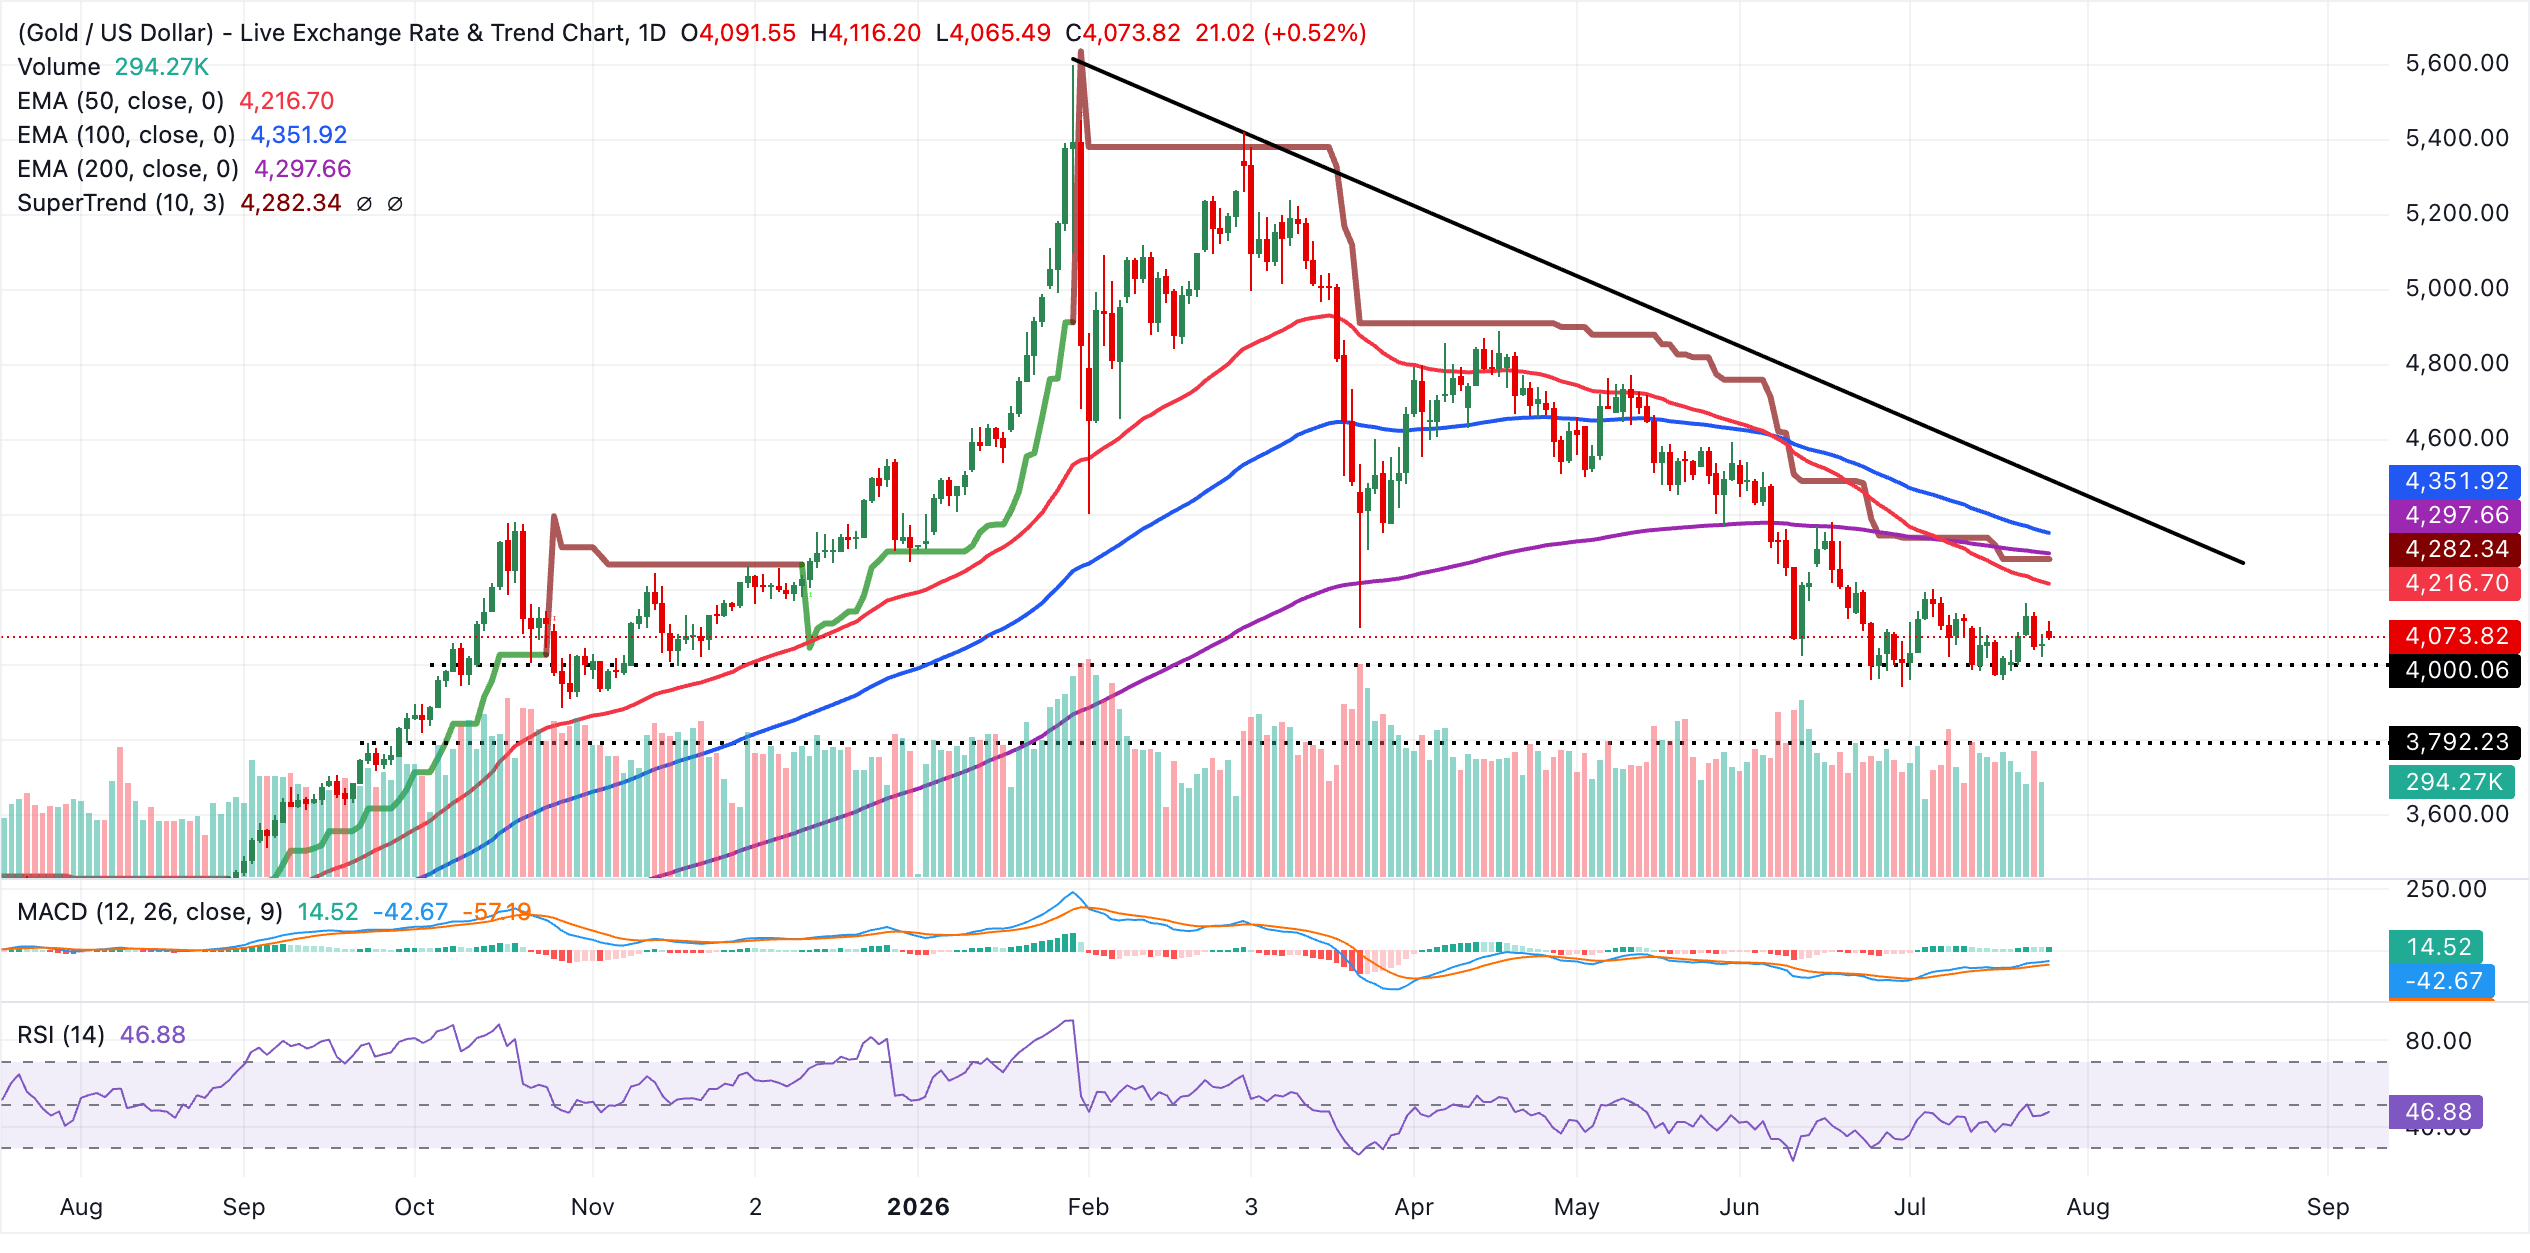
On the topside, initial resistance appears at the 50-day EMA near $4,217, followed by the SuperTrend line around $4,282 and the 200-day EMA at $4,298, which together form a key supply zone. Above these, the 100-day EMA at $4,352 and the descending trendline break level at roughly $4,432 are the next barriers that would need to be cleared to ease the prevailing bearish pressure. On the flip side, the lack of nearby major moving-average support leaves the metal vulnerable to fresh selling should the pivotal $4,000 level give way, with bears likely to stay in control.
(The technical analysis of this story was written with the help of an AI tool. Know more.)
Bitcoin, altcoins, stablecoins FAQs
Bitcoin is the largest cryptocurrency by market capitalization, a virtual currency designed to serve as money. This form of payment cannot be controlled by any one person, group, or entity, which eliminates the need for third-party participation during financial transactions.
Altcoins are any cryptocurrency apart from Bitcoin, but some also regard Ethereum as a non-altcoin because it is from these two cryptocurrencies that forking happens. If this is true, then Litecoin is the first altcoin, forked from the Bitcoin protocol and, therefore, an “improved” version of it.
Stablecoins are cryptocurrencies designed to have a stable price, with their value backed by a reserve of the asset it represents. To achieve this, the value of any one stablecoin is pegged to a commodity or financial instrument, such as the US Dollar (USD), with its supply regulated by an algorithm or demand. The main goal of stablecoins is to provide an on/off-ramp for investors willing to trade and invest in cryptocurrencies. Stablecoins also allow investors to store value since cryptocurrencies, in general, are subject to volatility.
Bitcoin dominance is the ratio of Bitcoin's market capitalization to the total market capitalization of all cryptocurrencies combined. It provides a clear picture of Bitcoin’s interest among investors. A high BTC dominance typically happens before and during a bull run, in which investors resort to investing in relatively stable and high market capitalization cryptocurrency like Bitcoin. A drop in BTC dominance usually means that investors are moving their capital and/or profits to altcoins in a quest for higher returns, which usually triggers an explosion of altcoin rallies.
추천 기사


