


Crypto Today: Bitcoin, Ethereum, XRP hold key support as US and Iran agree to halt strikes
- Bitcoin struggles to gain momentum but holds above $65,000 after the US and Iran paused strikes.
- Ethereum approaches the pivotal $2,000 level, supported by a marginal improvement in crypto market sentiment.
- XRP is trading broadly sideways with the 50-day EMA capping the upside and the MACD holding onto a mild buy signal.
Bitcoin (BTC) maintains a neutral-to-bullish outlook, trading above $65,000 on Monday. Ethereum (ETH) is approaching the key supply and inflection point $2,000, while Ripple (XRP) hovers slightly above $1.10, underscoring a marginal improvement in the broader cryptocurrency market sentiment.
US-Iran pause strikes to explore diplomatic solution
The United States (US) has temporarily suspended military operations, with the US ambassador to the United Nations (UN) stating that President Donald Trump is allowing diplomatic efforts with Iran to proceed, according to CNN.
In turn, Iran has also halted its retaliatory actions. Although some reports suggested the US was depleting its ammunition reserves, Trump refuted these claims.
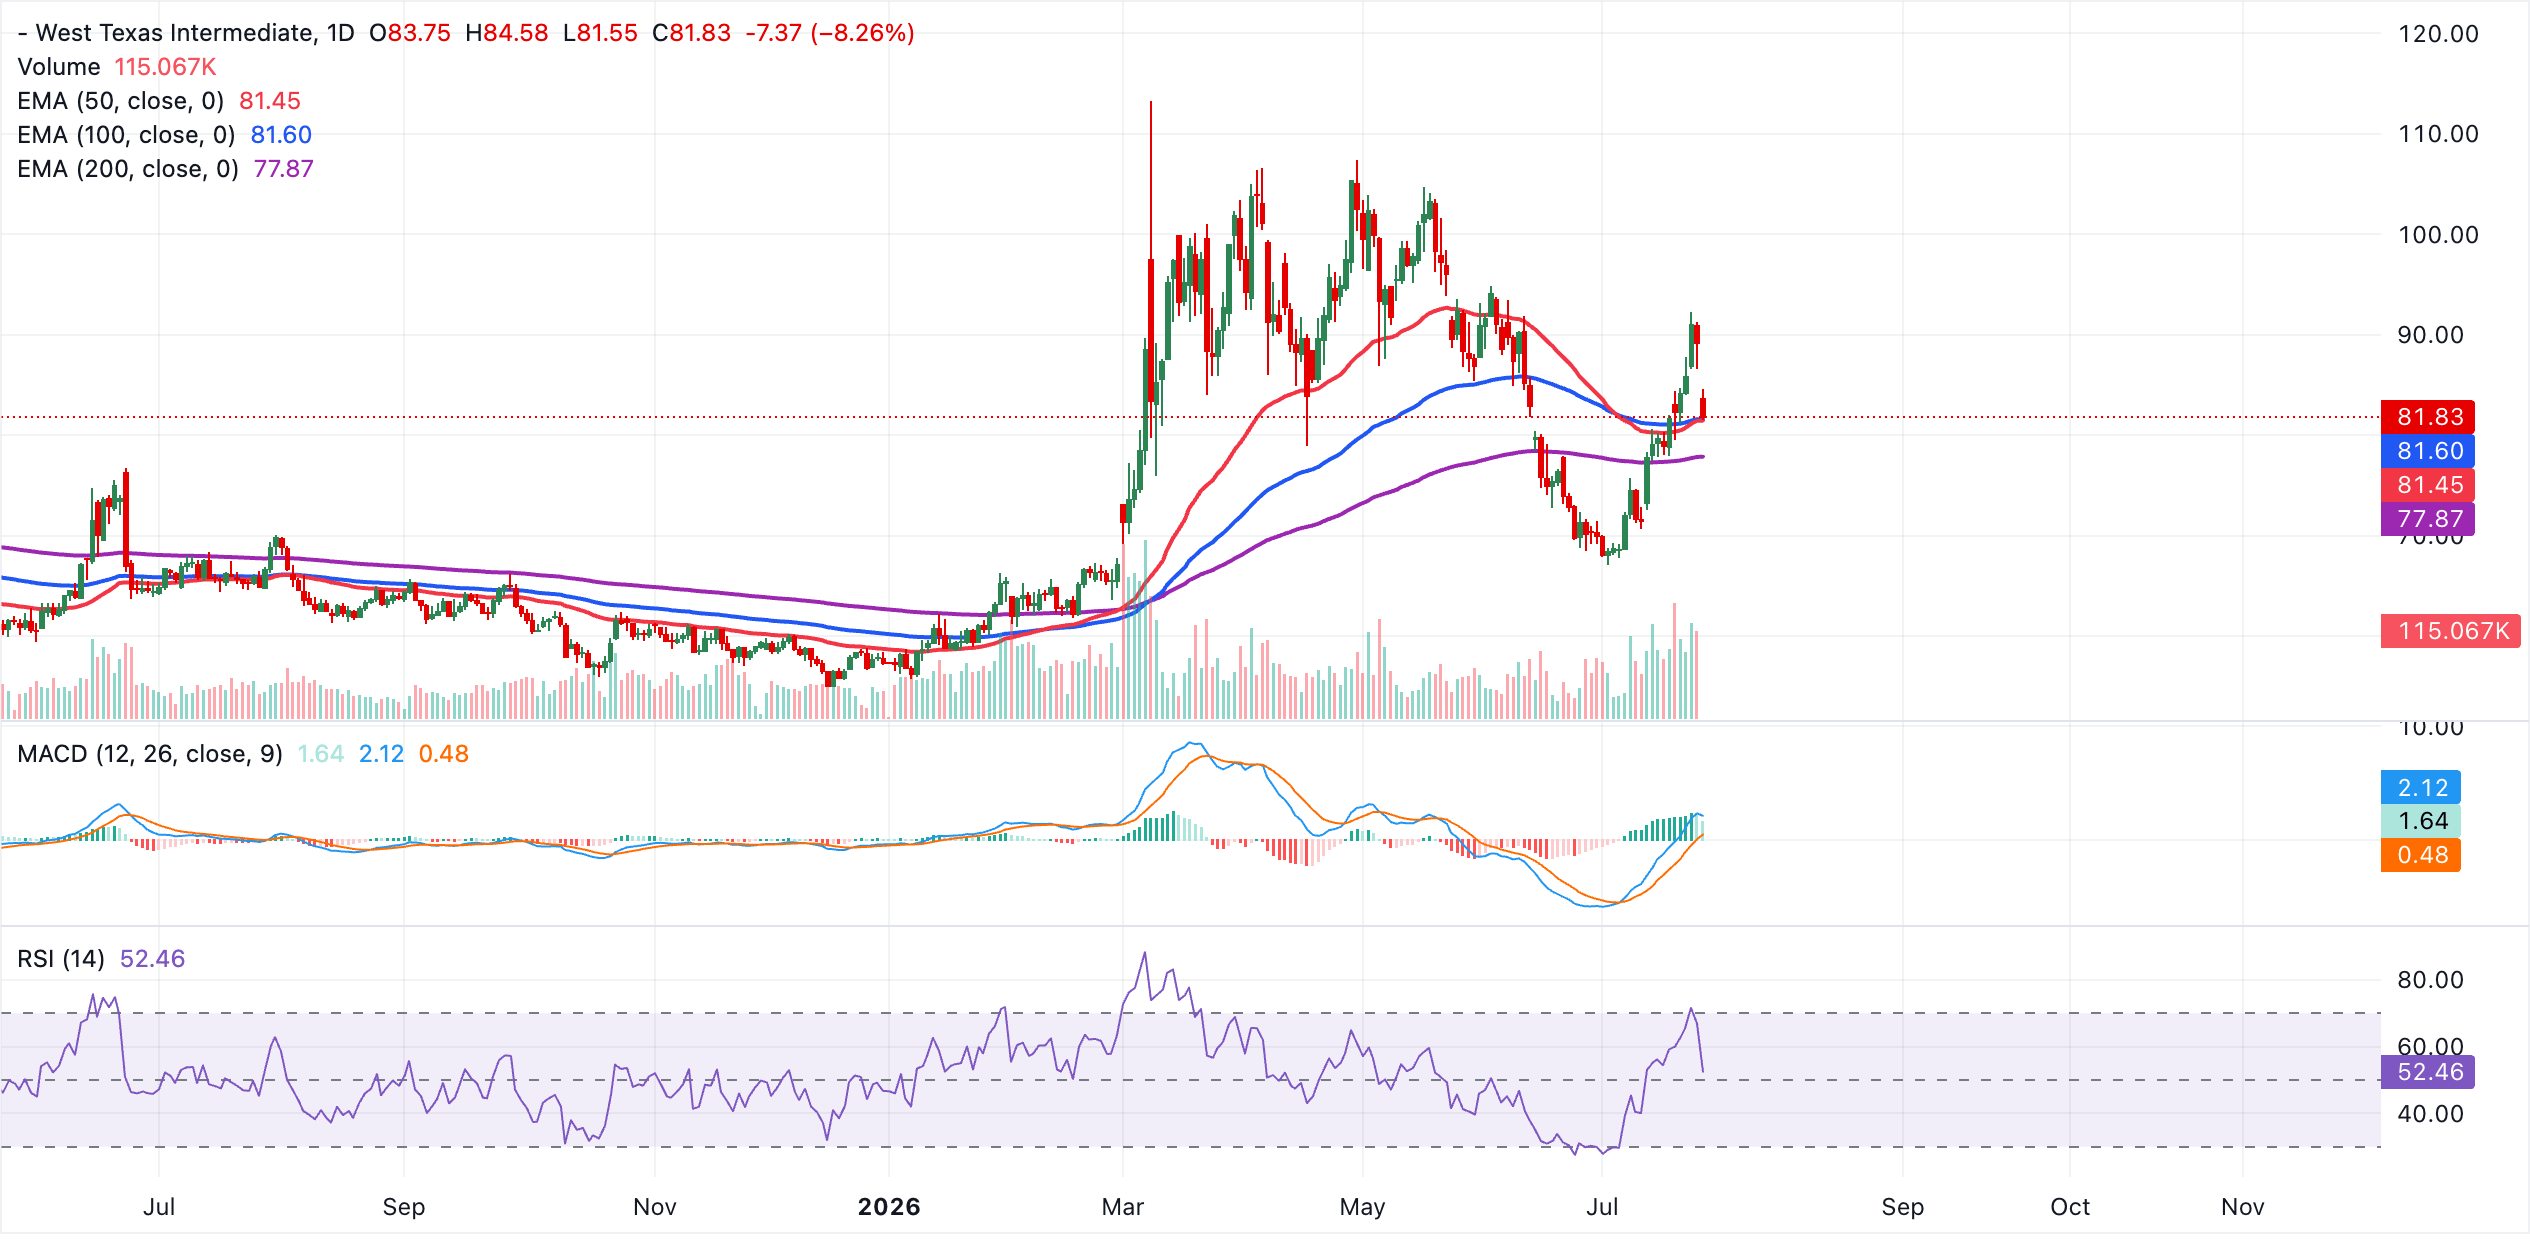
Global Oil prices eased on Monday, with the West Texas Intermediate (WTI) Crude trading around $81. However, shipping activity in the Strait of Hormuz remained low during the weekend, undermining the temporary pause of strikes between the two countries.
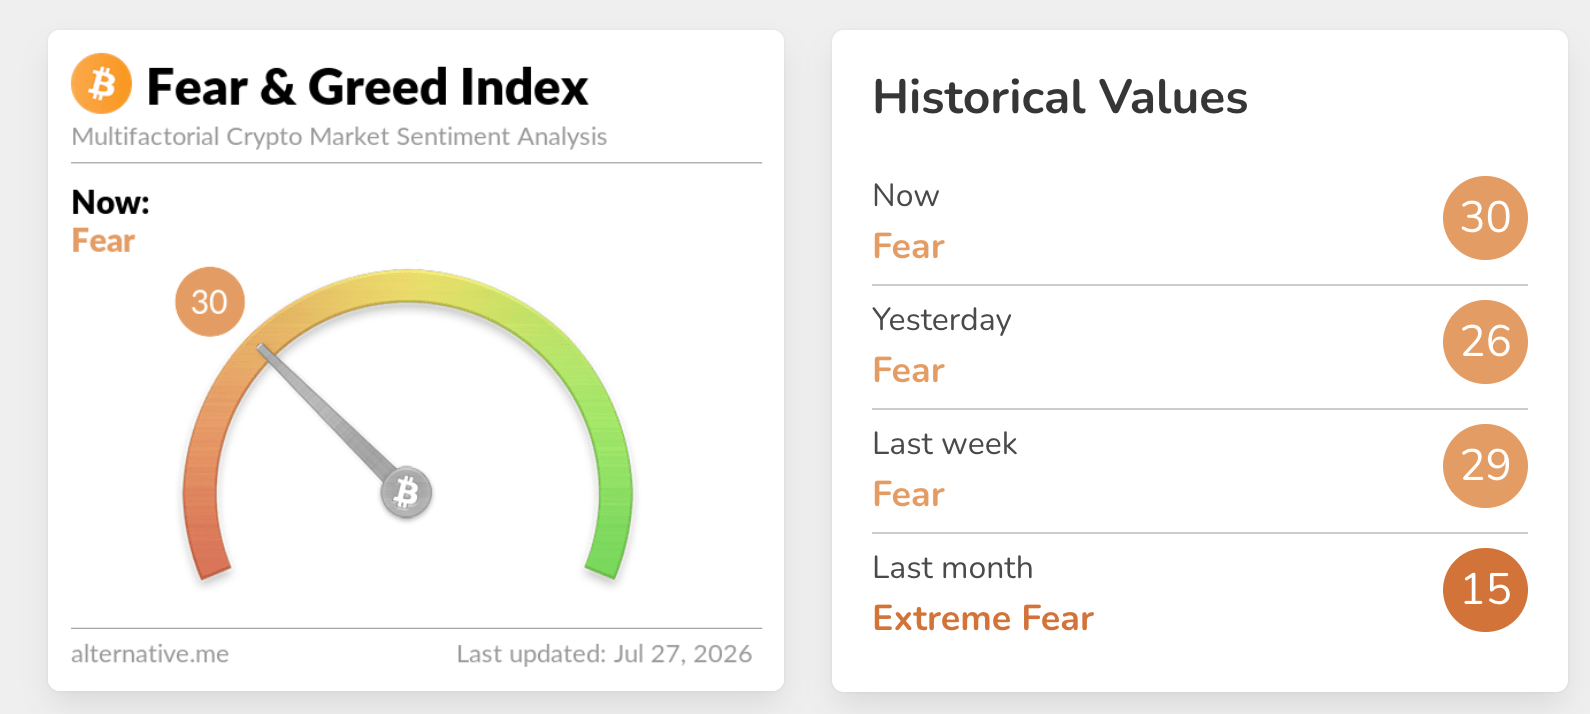
The crypto market sentiment edged higher, albeit marginally, underlined by the positive gesture by the US and Iran to explore a diplomatic solution to the conflict, which has lasted since late February. The Fear & Greed Index remains in the Fear territory at 33 on Monday, increasing slightly from 28 the day before. This marginal increase aligns with investors' hope for a lasting US-Iran peace agreement.
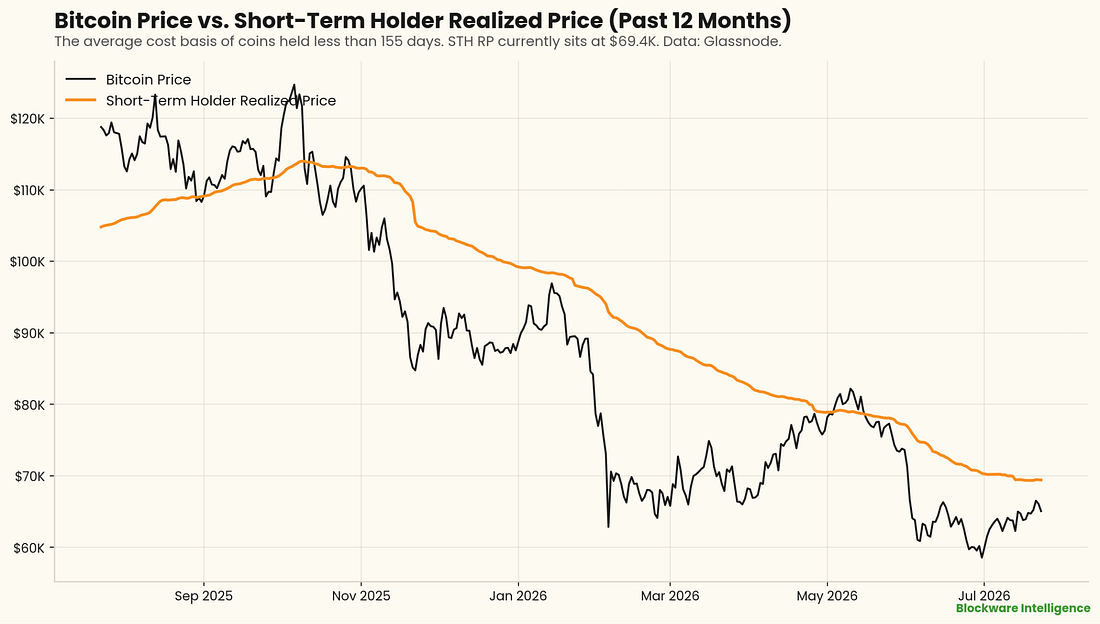
According to a report by Blockware Intelligence, “the short-term holder realized price is now at approximately $69,000… If BTC sustains a breakout above this key on-chain cost basis metric, that will provide strong confirmation that the worst of the bear market (price wise) is behind us.”
Price analysis: Bitcoin bulls reclaim key support
Bitcoin trades above $65,000, holding just above the 50-day Exponential Moving average (EMA) at $65,199 while still capped well beneath the 100-day EMA at $67,771 and the higher 200-day EMA at $73,596. This configuration hints at a tentative recovery within a broader corrective phase, with price supported by the reclaimed 78.6% Fibonacci retracement of the latest downswing at $63,171.
The Relative Strength Index (RSI) at 54 sits in neutral territory, and the latest Moving Average Convergence Divergence (MACD) reading remains mildly positive but subdued, suggesting only modest bullish momentum as buyers attempt to build a base above the short-term average.
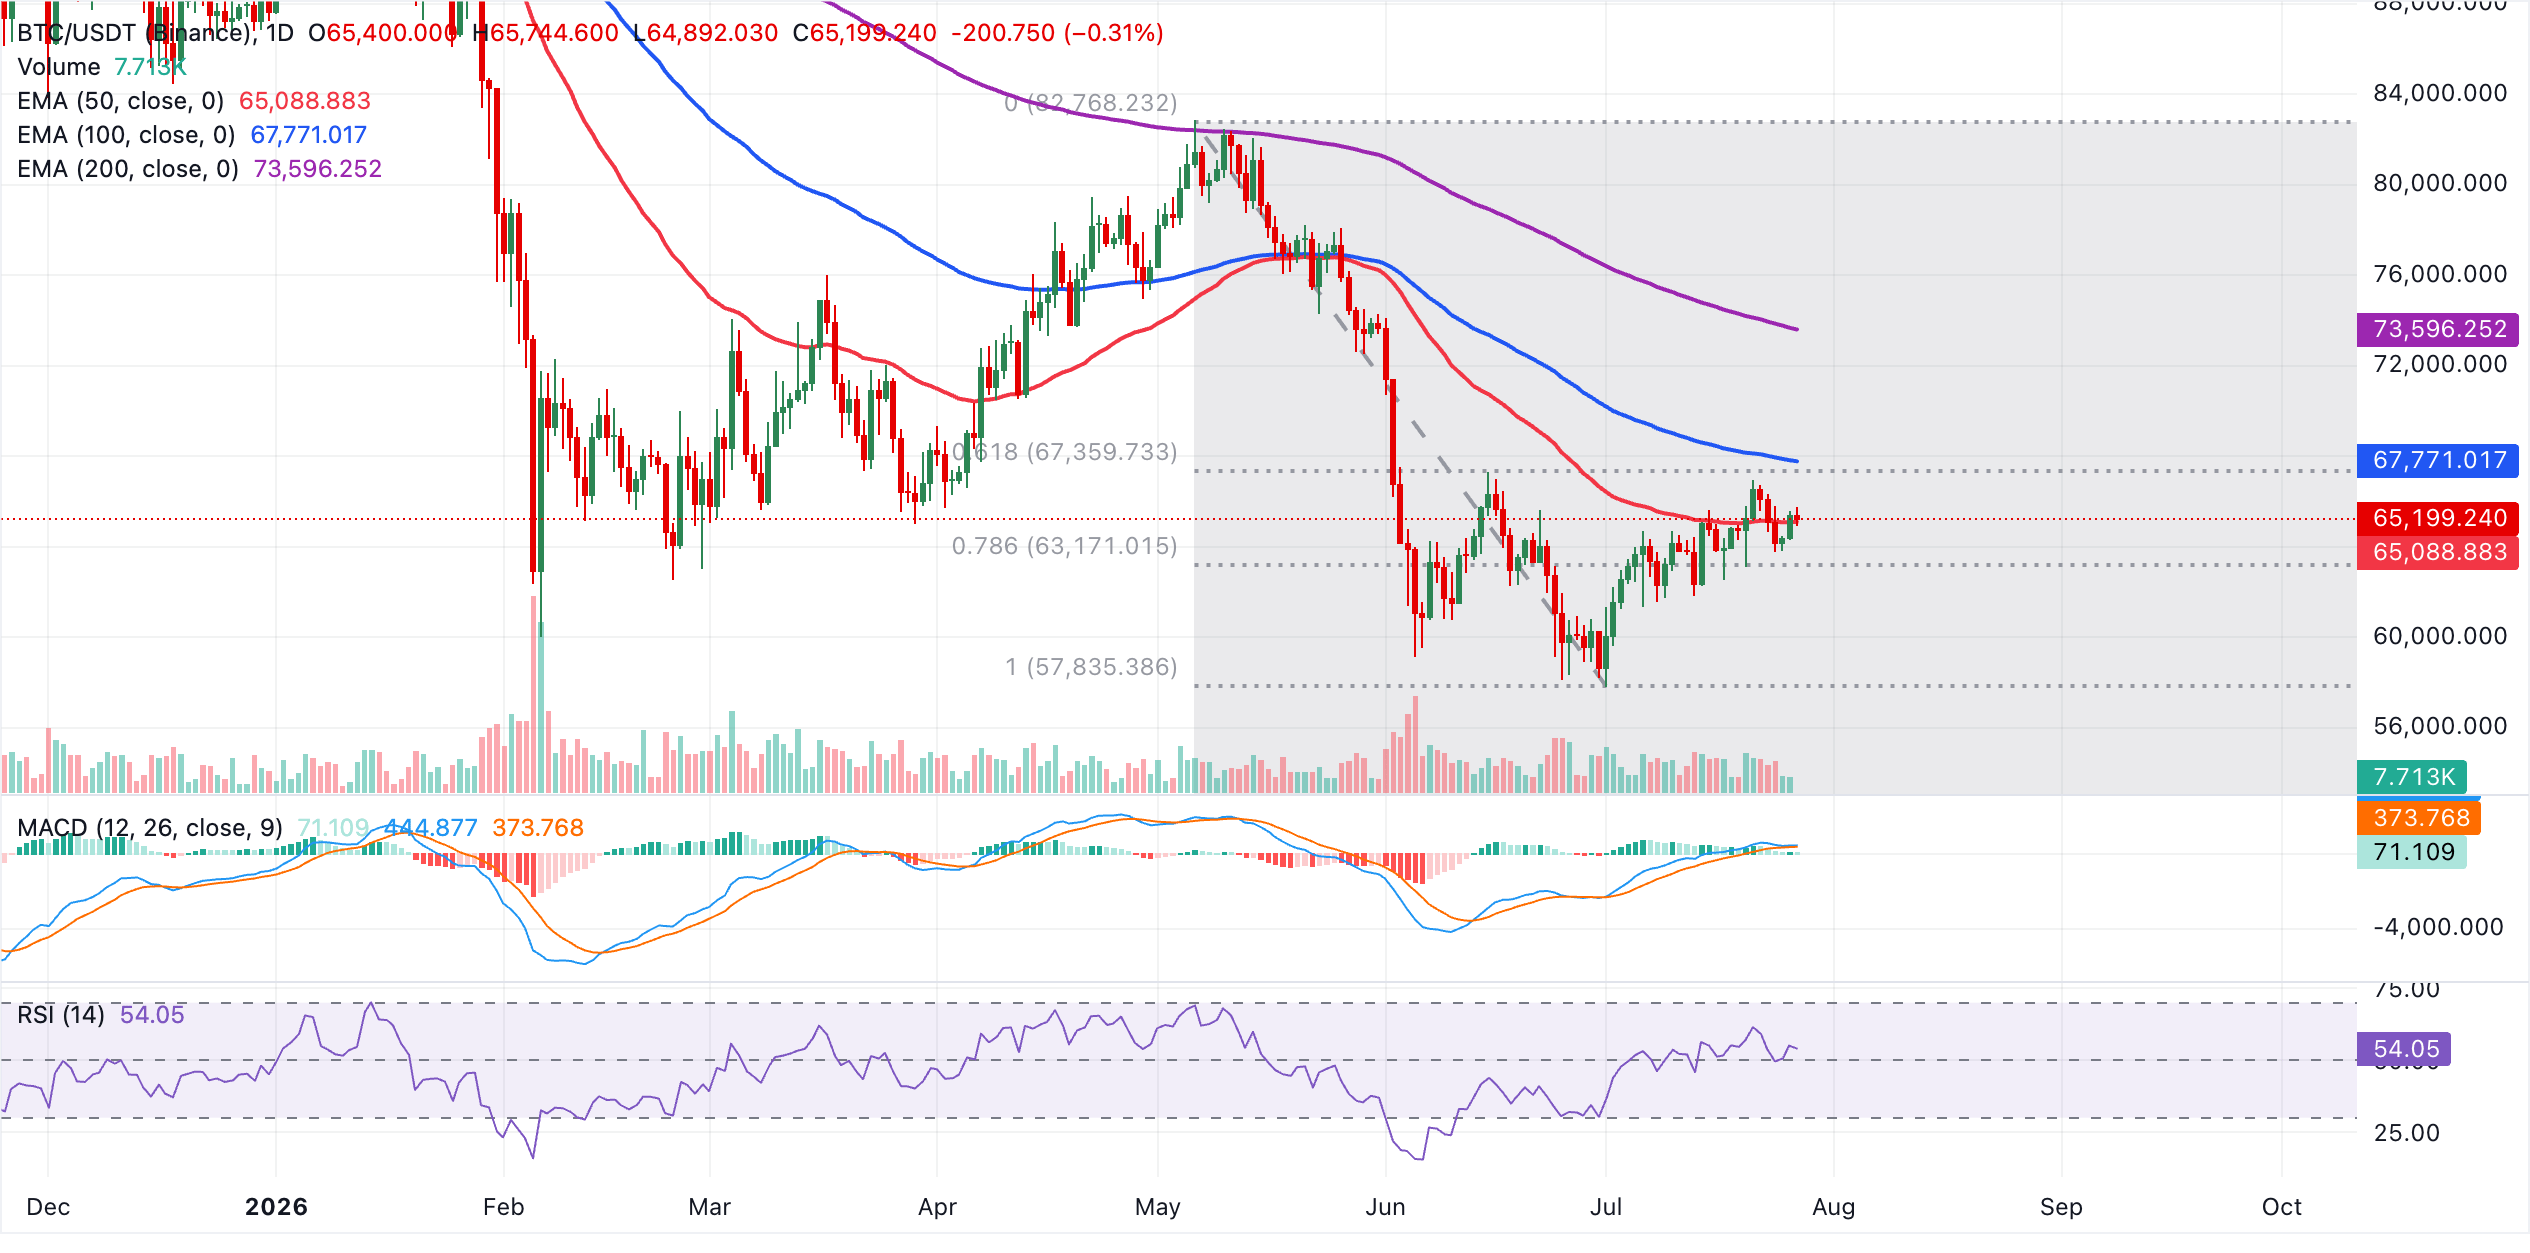
On the topside, initial resistance is aligned at the 61.8% Fibonacci retracement at $67,359, followed closely by the 100-day EMA near $67,771. A sustained break above this cluster would open the door toward the 50.0% retracement at $70,302 and then the denser barrier formed by the 38.2% Fibonacci retracement level at $73,244 and the 200-day EMA at $73,596. On the downside, immediate support is provided by the 50-day EMA at $65,088, with a deeper pullback exposing the 78.6% Fibonacci level at $63,171.01. A loss of that floor would risk a more pronounced decline toward the prior swing low reference at $57,835.
Altcoins outlook: Ethereum and XRP eye short-term breakout
Ethereum trades at $1,965, maintaining a bullish near-term bias as price holds above the 50-day and 100-day EMAs. The pair is comfortably supported by the 100-day EMA near $1,934, while the 50-day EMA around $1,842 underpins the broader recovery structure.
Momentum remains constructive, with the RSI hovering in the mid-60s on the daily chart, suggesting firm buying interest but still shy of overbought territory. The MACD stays in positive territory with a positive histogram, hinting that upward pressure is still in play.
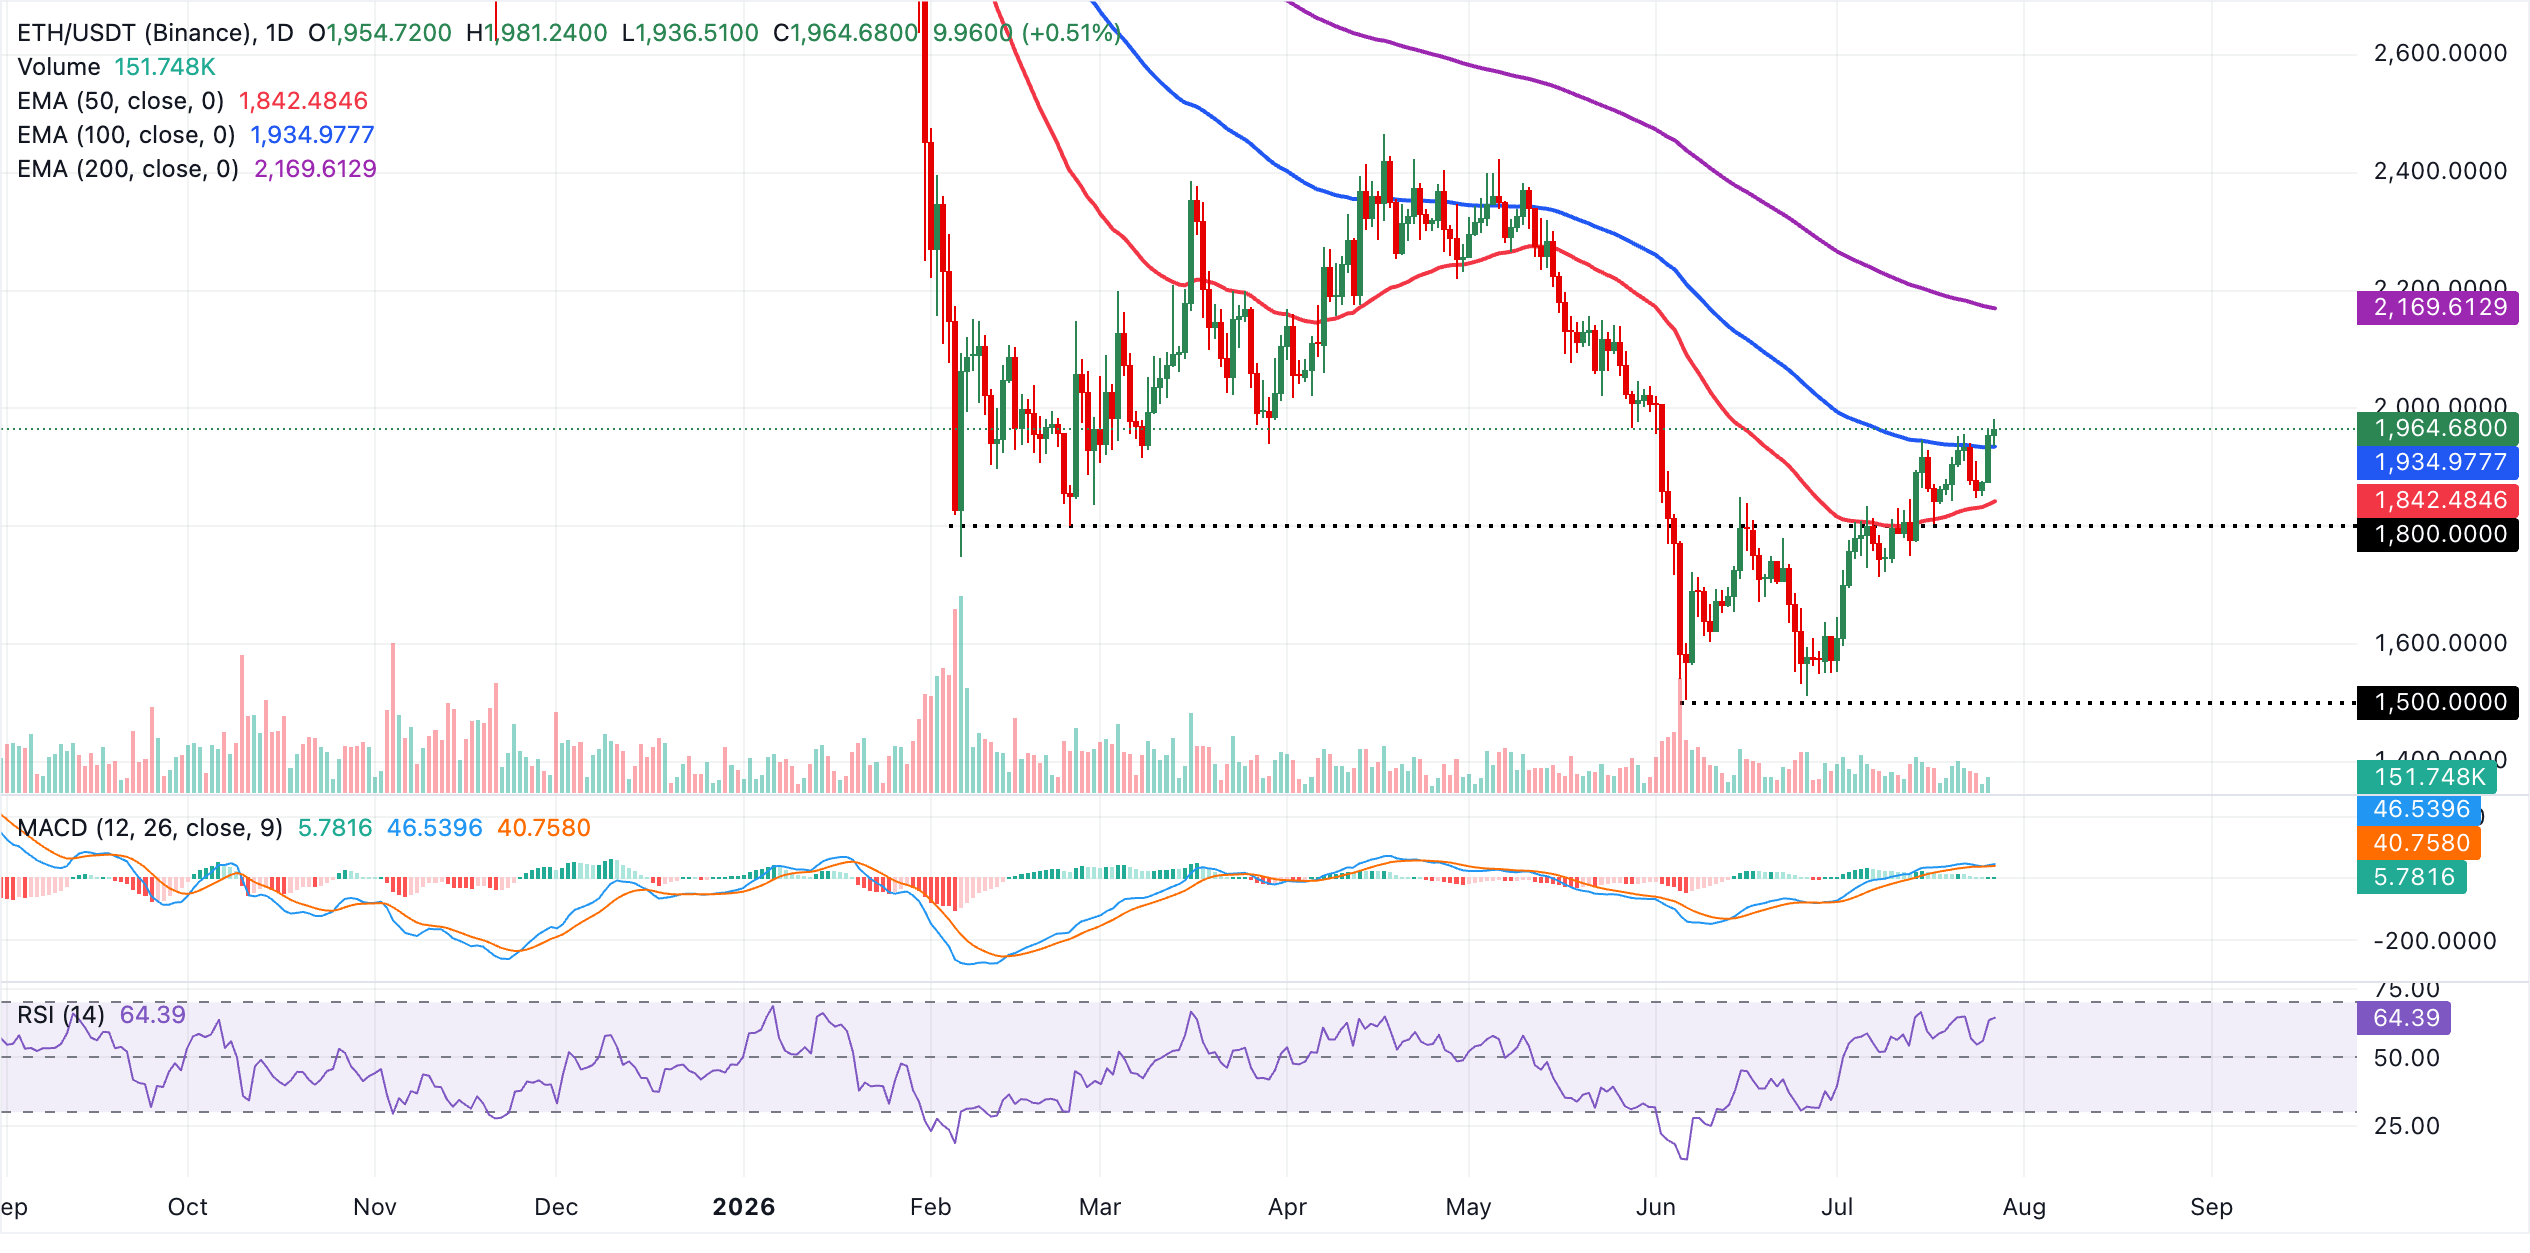
On the topside, the main obstacle is the 200-day EMA, which now acts as the next significant resistance around $2,170 and caps the scope for an immediate extension higher unless decisively reclaimed. On the downside, initial support is located at the 100-day EMA near $1,935, with the 50-day EMA at $1,842 providing a deeper technical floor. A break below this latter level would weaken the current bullish structure and expose the pair to a broader corrective phase.
XRP, on the other hand, trades above $1.10, holding a bearish near-term bias as price remains capped beneath the 50-day, 100-day and 200-day EMAs. The 78.6% Fibonacci retracement of the latest swing at $1.14 sits just under the 50-day EMA at $1.14, creating a nearby resistance cluster that reinforces the downside tone.
Momentum is mixed, with the RSI hovering around a neutral 49 on the daily chart and the MACD mildly positive but flattening, which suggests waning upside pressure rather than a decisive bullish shift while price trades below these key averages.
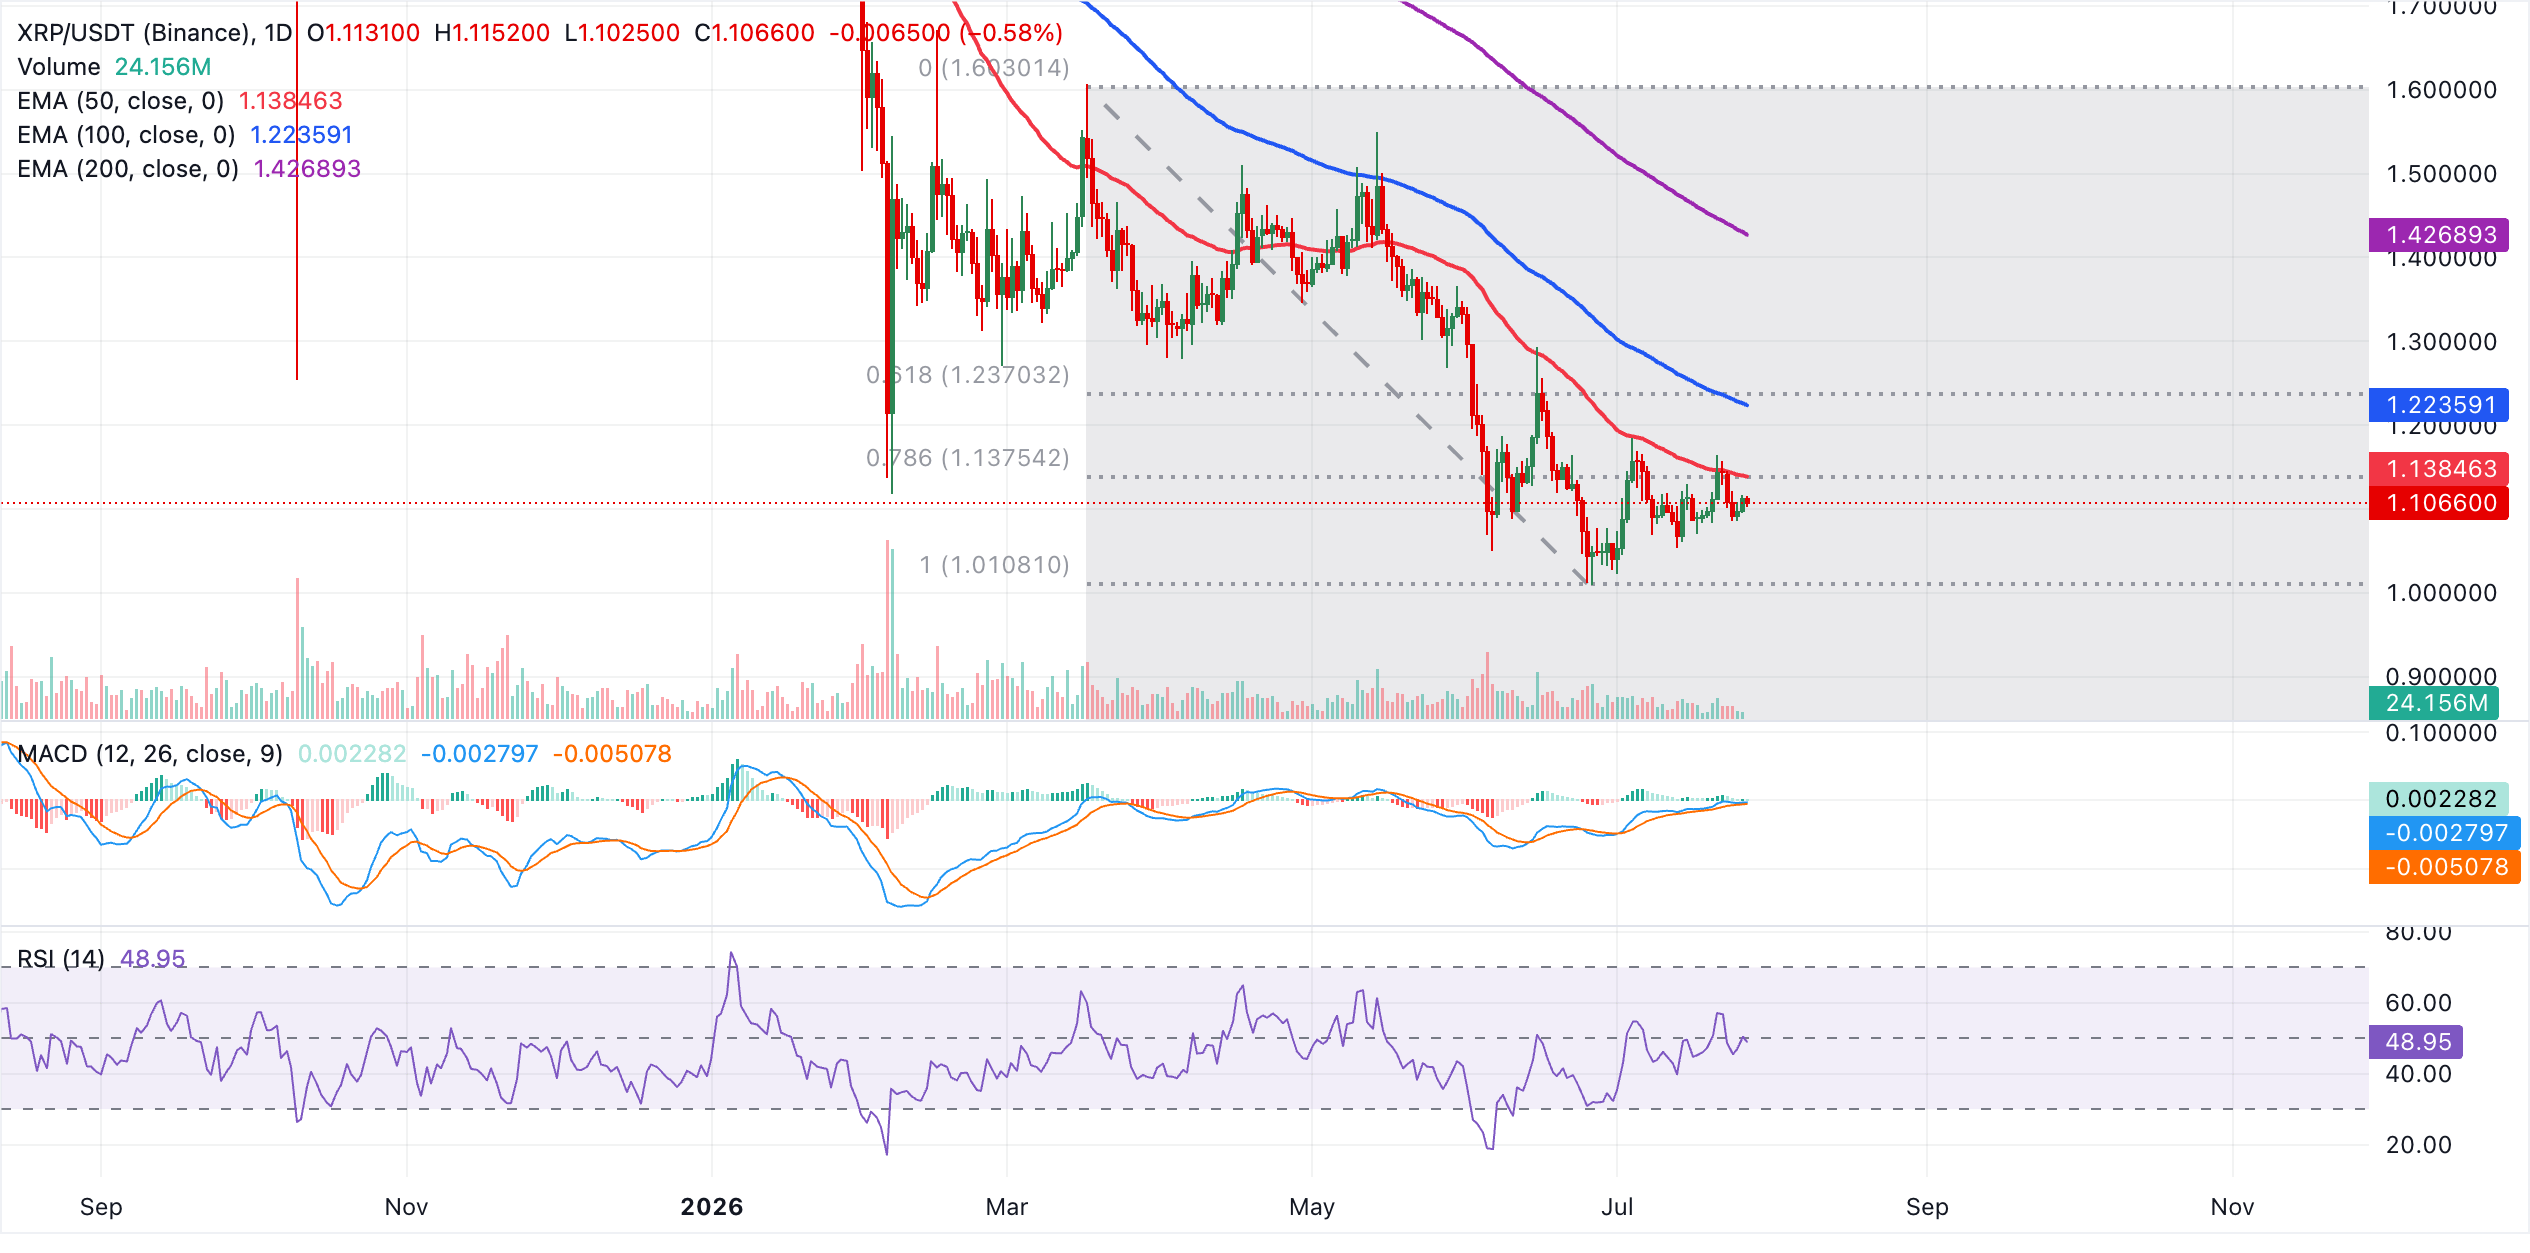
On the topside, initial resistance is seen at the 78.6% Fibonacci retracement at $1.14, which coincides with the 50-day EMA. A daily close above this band would be needed to ease immediate downside pressure. Further barriers emerge at the 100-day EMA at $1.22, converging with the 61.8% Fibonacci retracement at $1.24, ahead of the 50.0% Fibonacci retracement level at $1.31.
On the downside, the main nearby support is the prior swing anchor around the 100.0% Fibonacci level at $1.01. A break below this floor would likely reopen the decline towards lower psychological levels, while holding above it keeps XRP/USDT in a corrective consolidation under heavy overhead resistance.
(The technical analysis of this story was written with the help of an AI tool. Know more.)
Bitcoin, altcoins, stablecoins FAQs
Bitcoin is the largest cryptocurrency by market capitalization, a virtual currency designed to serve as money. This form of payment cannot be controlled by any one person, group, or entity, which eliminates the need for third-party participation during financial transactions.
Altcoins are any cryptocurrency apart from Bitcoin, but some also regard Ethereum as a non-altcoin because it is from these two cryptocurrencies that forking happens. If this is true, then Litecoin is the first altcoin, forked from the Bitcoin protocol and, therefore, an “improved” version of it.
Stablecoins are cryptocurrencies designed to have a stable price, with their value backed by a reserve of the asset it represents. To achieve this, the value of any one stablecoin is pegged to a commodity or financial instrument, such as the US Dollar (USD), with its supply regulated by an algorithm or demand. The main goal of stablecoins is to provide an on/off-ramp for investors willing to trade and invest in cryptocurrencies. Stablecoins also allow investors to store value since cryptocurrencies, in general, are subject to volatility.
Bitcoin dominance is the ratio of Bitcoin's market capitalization to the total market capitalization of all cryptocurrencies combined. It provides a clear picture of Bitcoin’s interest among investors. A high BTC dominance typically happens before and during a bull run, in which investors resort to investing in relatively stable and high market capitalization cryptocurrency like Bitcoin. A drop in BTC dominance usually means that investors are moving their capital and/or profits to altcoins in a quest for higher returns, which usually triggers an explosion of altcoin rallies.
추천 기사


