

The Dow Jones Industrial Average relearns that good news is bad news
- A stronger-than-expected May jobs report sent Treasury yields higher and revived bets on a Fed hike by year-end.
- The Dow held up better than the Nasdaq and S&P 500 as money fled chip stocks for defensive consumer staples.
- Rate expectations, not growth or earnings, drove Friday's tape.
There is an old reflex in equity markets that never quite dies: when the economy looks too strong, stocks get nervous. Friday brought it straight back. The Dow Jones Industrial Average (DJIA) drifted lower through the US session and closed down around 0.8%, but that still-modest headline number hides what actually happened underneath. A much stronger than expected jobs report lit a fire under Treasury yields, the rate market quietly shifted toward pricing a Federal Reserve (Fed) hike rather than a cut, and the high-multiple corners of the market took the punishment. The Dow's relative calm was not strength. It was the cleanest seat in a room that was rotating hard.
A jobs number nobody asked for
The Bureau of Labor Statistics (BLS) reported that Nonfarm Payrolls (NFP) rose 172K in May, more than double the 85K consensus, with the prior two months revised higher. The unemployment rate held at 4.3%, bang in line, while Average Hourly Earnings (AHE) printed 0.3% MoM and 3.4% YoY, neither hot enough to scare nor soft enough to soothe. In isolation it is an unremarkable report. The problem is what it does to the Fed. A labor market this firm hands policymakers no excuse to ease, and the curve repriced accordingly: the 10-year yield pushed above 4.5% and the 30-year cleared 5%. A Fed speaker scheduled for the afternoon (Hammack) was flagged hawkish, which only poured fuel on the move.
Where the pain actually landed
Under the index level, the rotation was brutal. Chipmakers led the bleed, with Broadcom, Marvell and Micron all sharply lower as the artificial intelligence (AI) trade kept unwinding after Thursday's drubbing. The Nasdaq shed more than 2% and the S&P 500 over 1%, while cash bolted for the defensive end. Consumer staples names such as Coca-Cola and Colgate-Palmolive rallied hard, both up more than 3%. The Dow, light on megacap semiconductors and heavy on exactly the dull, cash-generative businesses investors run toward when they get nervous, wore the selloff far better than its peers. That is the entire explanation for its outperformance: not conviction, just composition.
The chart says buyers quit at 12:30
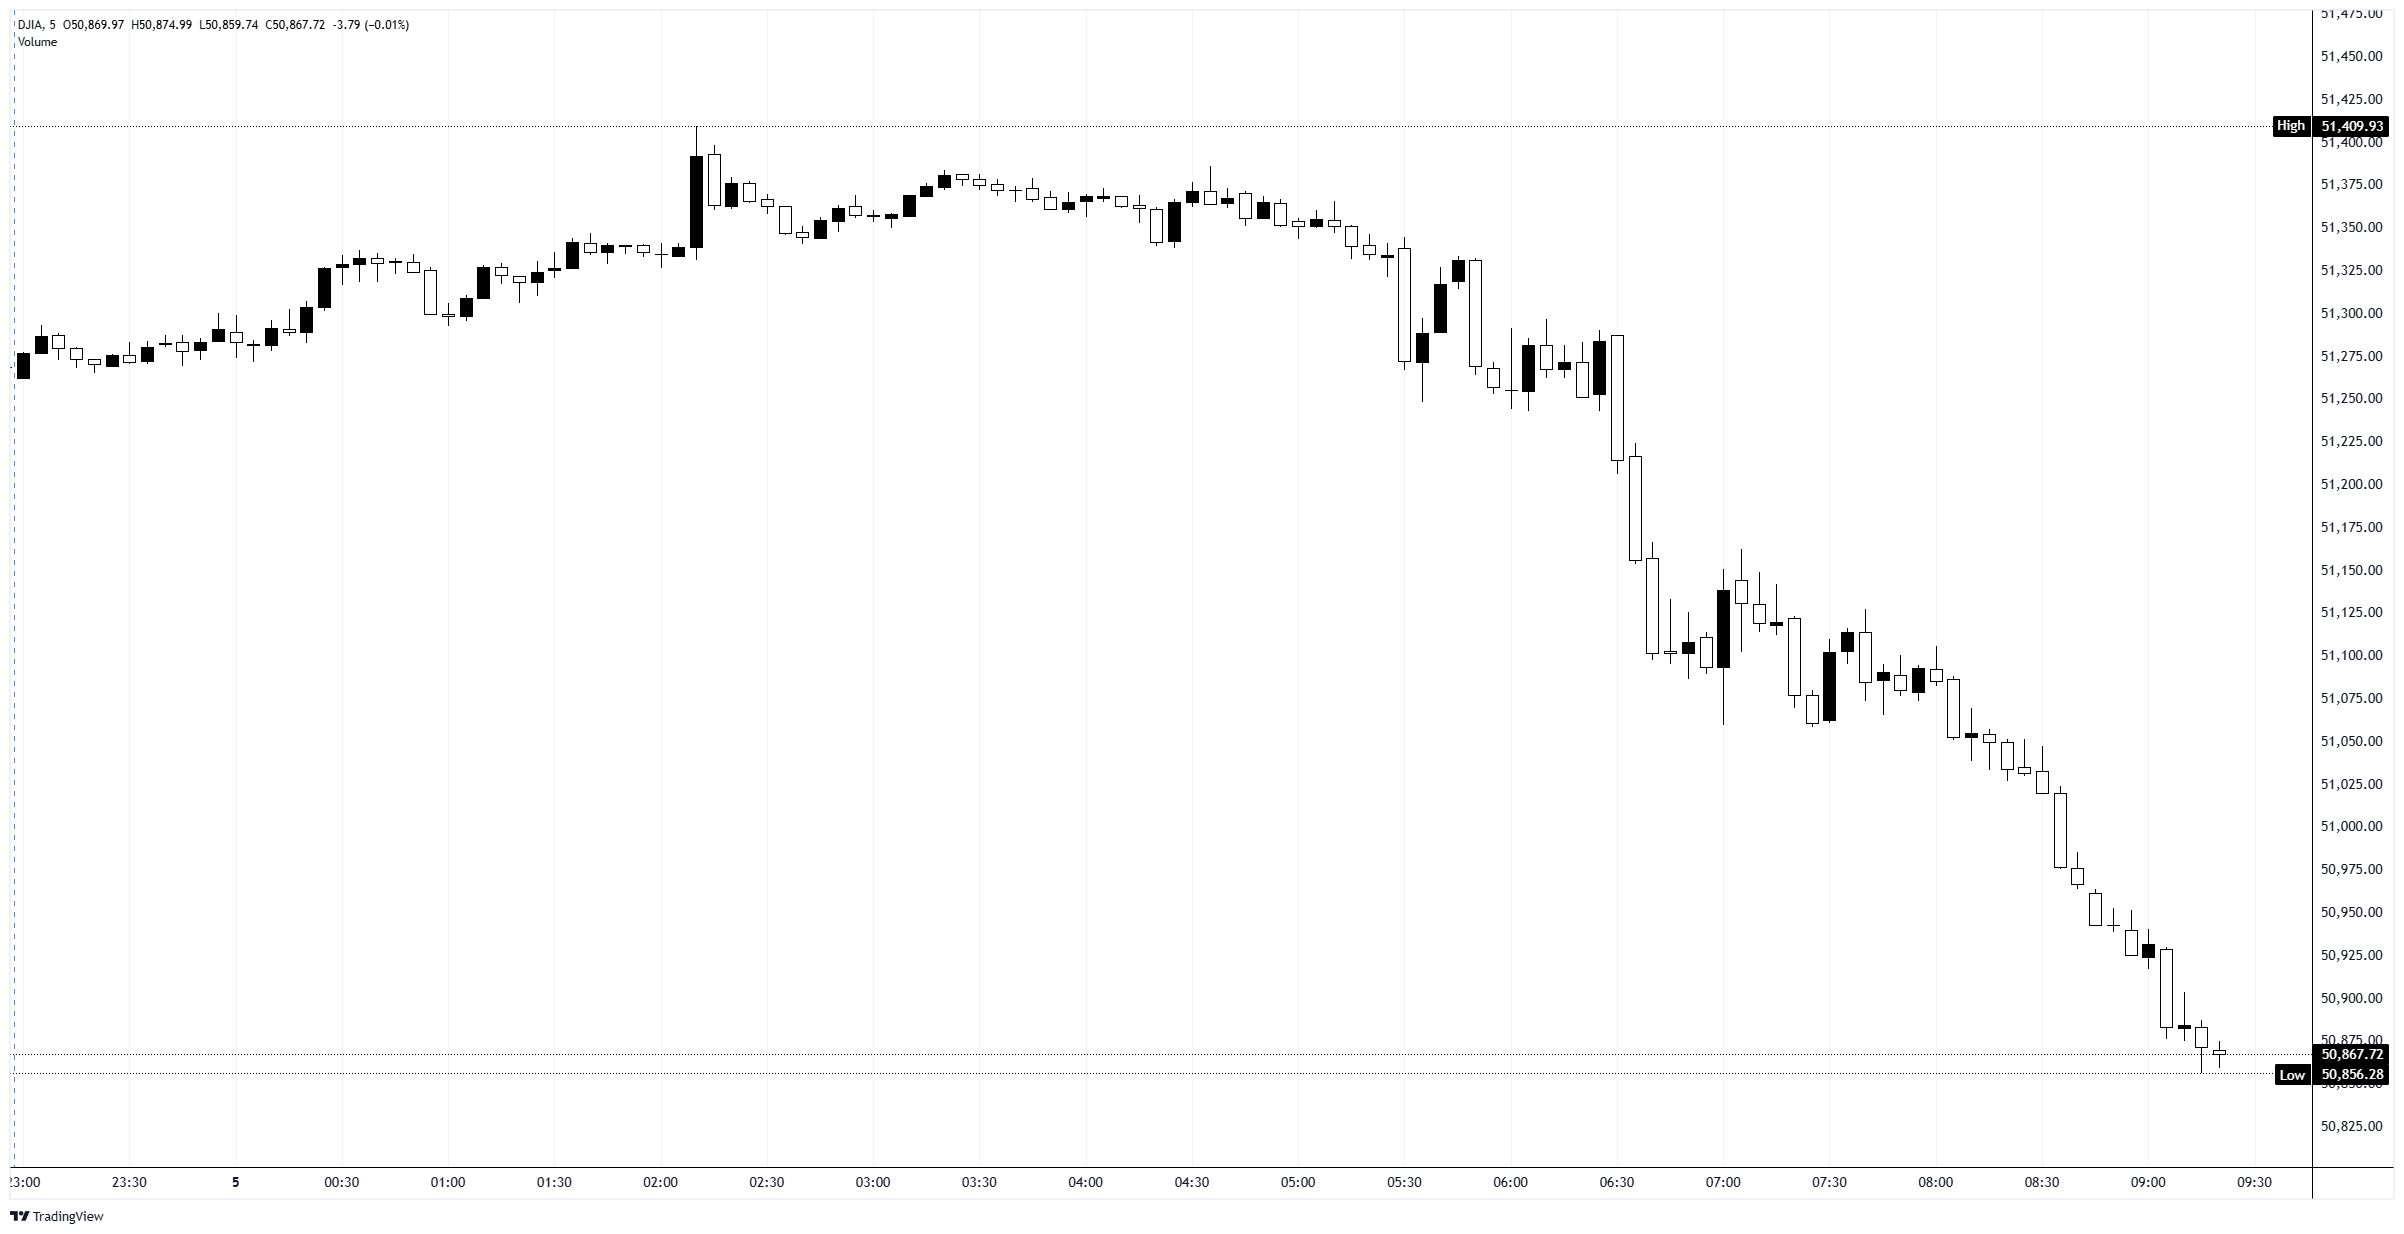
Dow futures had spent the overnight session grinding higher, topping out near 51,400 around 09:00 GMT before going quiet through the European morning. The NFP release at 12:30 GMT broke the spell. Price sliced through 51,200, then 51,100, then the 51,000 handle in a near-uninterrupted slide, and every attempted bounce was sold. By late afternoon the contract had extended the slide to a fresh session low near 50,850, having shed around 550 points from the overnight peak. There was no panic spike and no obvious capitulation, just steady, methodical selling, which is what a repricing looks like rather than a fright.
Trading the rates regime
The framework here is unglamorous. As long as the rate market keeps leaning toward hikes instead of cuts, bounces in the Dow are sales until proven otherwise, and the path of least resistance points lower. The 51,000 handle, surrendered so easily on Friday, becomes the first resistance on any rebound, with the broken shelf near 51,200 above it. To the downside, with the index now pinned near 50,850, the first reference is 50,800, and a sustained break there opens the door toward 50,500, with the index trading as a rates proxy rather than a growth story for now. The real tell is whether the defensive bid that cushioned the Dow holds up, or whether higher yields eventually drag even the staples down with everything else. The next major inflation reading is the obvious referee. Until then, treat strength with suspicion.
Dow Jones 5-minute chart
Dow Jones FAQs
The Dow Jones Industrial Average, one of the oldest stock market indices in the world, is compiled of the 30 most traded stocks in the US. The index is price-weighted rather than weighted by capitalization. It is calculated by summing the prices of the constituent stocks and dividing them by a factor, currently 0.152. The index was founded by Charles Dow, who also founded the Wall Street Journal. In later years it has been criticized for not being broadly representative enough because it only tracks 30 conglomerates, unlike broader indices such as the S&P 500.
Many different factors drive the Dow Jones Industrial Average (DJIA). The aggregate performance of the component companies revealed in quarterly company earnings reports is the main one. US and global macroeconomic data also contributes as it impacts on investor sentiment. The level of interest rates, set by the Federal Reserve (Fed), also influences the DJIA as it affects the cost of credit, on which many corporations are heavily reliant. Therefore, inflation can be a major driver as well as other metrics which impact the Fed decisions.
Dow Theory is a method for identifying the primary trend of the stock market developed by Charles Dow. A key step is to compare the direction of the Dow Jones Industrial Average (DJIA) and the Dow Jones Transportation Average (DJTA) and only follow trends where both are moving in the same direction. Volume is a confirmatory criteria. The theory uses elements of peak and trough analysis. Dow’s theory posits three trend phases: accumulation, when smart money starts buying or selling; public participation, when the wider public joins in; and distribution, when the smart money exits.
There are a number of ways to trade the DJIA. One is to use ETFs which allow investors to trade the DJIA as a single security, rather than having to buy shares in all 30 constituent companies. A leading example is the SPDR Dow Jones Industrial Average ETF (DIA). DJIA futures contracts enable traders to speculate on the future value of the index and Options provide the right, but not the obligation, to buy or sell the index at a predetermined price in the future. Mutual funds enable investors to buy a share of a diversified portfolio of DJIA stocks thus providing exposure to the overall index.
추천 기사


