

US Dollar Index Price Forecast: Journey towards 100.00 remains intact amid hawkish Fed bets
- The US Dollar Index trades higher against its peers amid firm hawkish Fed bets.
- Traders have priced out dovish Fed bets due to elevated oil prices.
- Iran threatens to extend the war with the US beyond the Middle East if Washington resumes military attacks.
The US Dollar Index (DXY), which tracks the Greenback’s value against six major currencies, reflects strength ahead of the United States (US) stock markets' opening near its six-week high of 99.40.
US Dollar Price Today
The table below shows the percentage change of US Dollar (USD) against listed major currencies today. US Dollar was the strongest against the Swiss Franc.
| USD | EUR | GBP | JPY | CAD | AUD | NZD | CHF | |
|---|---|---|---|---|---|---|---|---|
| USD | 0.03% | -0.06% | -0.05% | 0.09% | -0.33% | -0.24% | 0.14% | |
| EUR | -0.03% | -0.10% | -0.09% | 0.06% | -0.36% | -0.26% | 0.10% | |
| GBP | 0.06% | 0.10% | 0.00% | 0.16% | -0.30% | -0.16% | 0.19% | |
| JPY | 0.05% | 0.09% | 0.00% | 0.14% | -0.28% | -0.19% | 0.19% | |
| CAD | -0.09% | -0.06% | -0.16% | -0.14% | -0.42% | -0.28% | 0.05% | |
| AUD | 0.33% | 0.36% | 0.30% | 0.28% | 0.42% | 0.11% | 0.45% | |
| NZD | 0.24% | 0.26% | 0.16% | 0.19% | 0.28% | -0.11% | 0.36% | |
| CHF | -0.14% | -0.10% | -0.19% | -0.19% | -0.05% | -0.45% | -0.36% |
The heat map shows percentage changes of major currencies against each other. The base currency is picked from the left column, while the quote currency is picked from the top row. For example, if you pick the US Dollar from the left column and move along the horizontal line to the Japanese Yen, the percentage change displayed in the box will represent USD (base)/JPY (quote).
The US Dollar trades firmly as traders have almost priced out the possibility of an interest rate cut by the Federal Reserve (Fed) this year. According to the CME FedWatch tool, the odds of the Fed delivering at least one interest rate hike this year are 56.3%, a sharp turnaround from two interest rate cuts anticipated before the war started in the Middle East.
Traders have priced out dovish Fed bets as oil prices have remained elevated due to fears of a prolonged closure of the Strait of Hormuz.
Meanwhile, fears of renewed US-Iran conflicts have increased as US President Donald Trump has threatened to resume military attacks on Iran if he doesn’t agree to a deal soon. Trump said on Tuesday that he doesn’t favor a war, but Washington can hit Iran again in the next few days.
In response, Iran’s Islamic Revolutionary Guard Corps (IRGC) has threatened to extend a renewed war beyond the Middle East if the US resumes attacks against Tehran, The Guardian reported. “Should aggression against Iran be repeated, the regional war that was promised will this time extend beyond the region, and our crushing blows in places you can scarcely imagine will reduce you to ashes,” a spokesperson from IRGC said.
US Dollar Index technical analysis
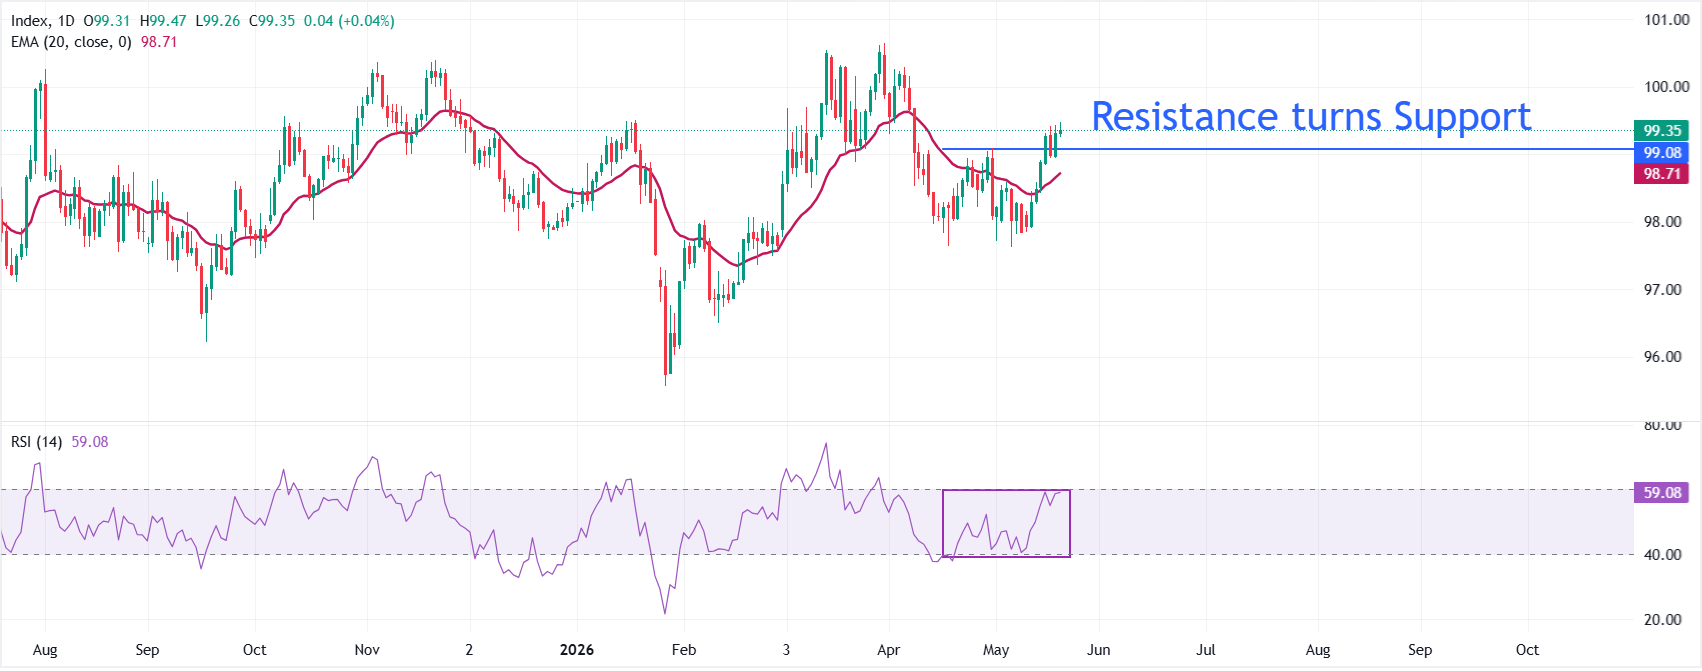
The Dollar Index Spot trades slightly higher at around 99.35 as of writing. The near-term tone is bullish as price holds above the 20-day Exponential Moving Average (EMA) at 98.71 and the key support zone at around 99.00, which used to be a major hurdle.
The Relative Strength Index (RSI) at 59.08 sits in positive but not overbought territory, hinting that upside momentum is firm but not yet stretched.
On the downside, initial support is aligned with the 20-day EMA at 98.71, which now acts as the first line of defense for dip buyers. A daily close back below this moving average would weaken the constructive bias and open the door to a deeper correction toward 98.00. Looking up, the index aims to extend the advance towards the psychological level of 100.00. A decisive move above 100.00 would open the door for further advancement towards the March high at 100.64.
(The technical analysis of this story was written with the help of an AI tool.)
US Dollar FAQs
The US Dollar (USD) is the official currency of the United States of America, and the ‘de facto’ currency of a significant number of other countries where it is found in circulation alongside local notes. It is the most heavily traded currency in the world, accounting for over 88% of all global foreign exchange turnover, or an average of $6.6 trillion in transactions per day, according to data from 2022. Following the second world war, the USD took over from the British Pound as the world’s reserve currency. For most of its history, the US Dollar was backed by Gold, until the Bretton Woods Agreement in 1971 when the Gold Standard went away.
The most important single factor impacting on the value of the US Dollar is monetary policy, which is shaped by the Federal Reserve (Fed). The Fed has two mandates: to achieve price stability (control inflation) and foster full employment. Its primary tool to achieve these two goals is by adjusting interest rates. When prices are rising too quickly and inflation is above the Fed’s 2% target, the Fed will raise rates, which helps the USD value. When inflation falls below 2% or the Unemployment Rate is too high, the Fed may lower interest rates, which weighs on the Greenback.
In extreme situations, the Federal Reserve can also print more Dollars and enact quantitative easing (QE). QE is the process by which the Fed substantially increases the flow of credit in a stuck financial system. It is a non-standard policy measure used when credit has dried up because banks will not lend to each other (out of the fear of counterparty default). It is a last resort when simply lowering interest rates is unlikely to achieve the necessary result. It was the Fed’s weapon of choice to combat the credit crunch that occurred during the Great Financial Crisis in 2008. It involves the Fed printing more Dollars and using them to buy US government bonds predominantly from financial institutions. QE usually leads to a weaker US Dollar.
Quantitative tightening (QT) is the reverse process whereby the Federal Reserve stops buying bonds from financial institutions and does not reinvest the principal from the bonds it holds maturing in new purchases. It is usually positive for the US Dollar.
추천 기사


