

Bitcoin Price Forecast: BTC recovers above $77,000 as markets hinge on Nvidia Q1 earnings
- Bitcoin price recovers slightly on Wednesday after holding strong around the major EMAs support earlier this week.
- Spot BTC ETFs recorded an outflow of over $330 million on Tuesday, extending withdrawals for the third consecutive day.
- Traders await the Fed Minutes and Nvidia’s Q1 earnings report on Wednesday, which could bring fresh volatility to BTC.
Bitcoin (BTC) recovers, trading above $77,000 after finding support around the key Exponential Moving Averages (EMAs) earlier this week. Fading institutional demand keeps the lid on Crypto King’s recovery as spot Exchange Traded Funds (ETFs) recorded continuous outflows so far this week. Meanwhile, market participants are focusing on the Wednesday Federal Reserve (Fed) Minutes and Nvidia’s Q1 earnings report, which could bring fresh volatility to BTC.
Nvidia could lift the BTC price
The tech giant Nvidia is set to announce its Q1 earnings report on Wednesday. The firm is expected to report revenue of $78.91 billion, roughly 15% higher than the last quarter and nearly 80% above the same quarter last year, as shown in the chart below.
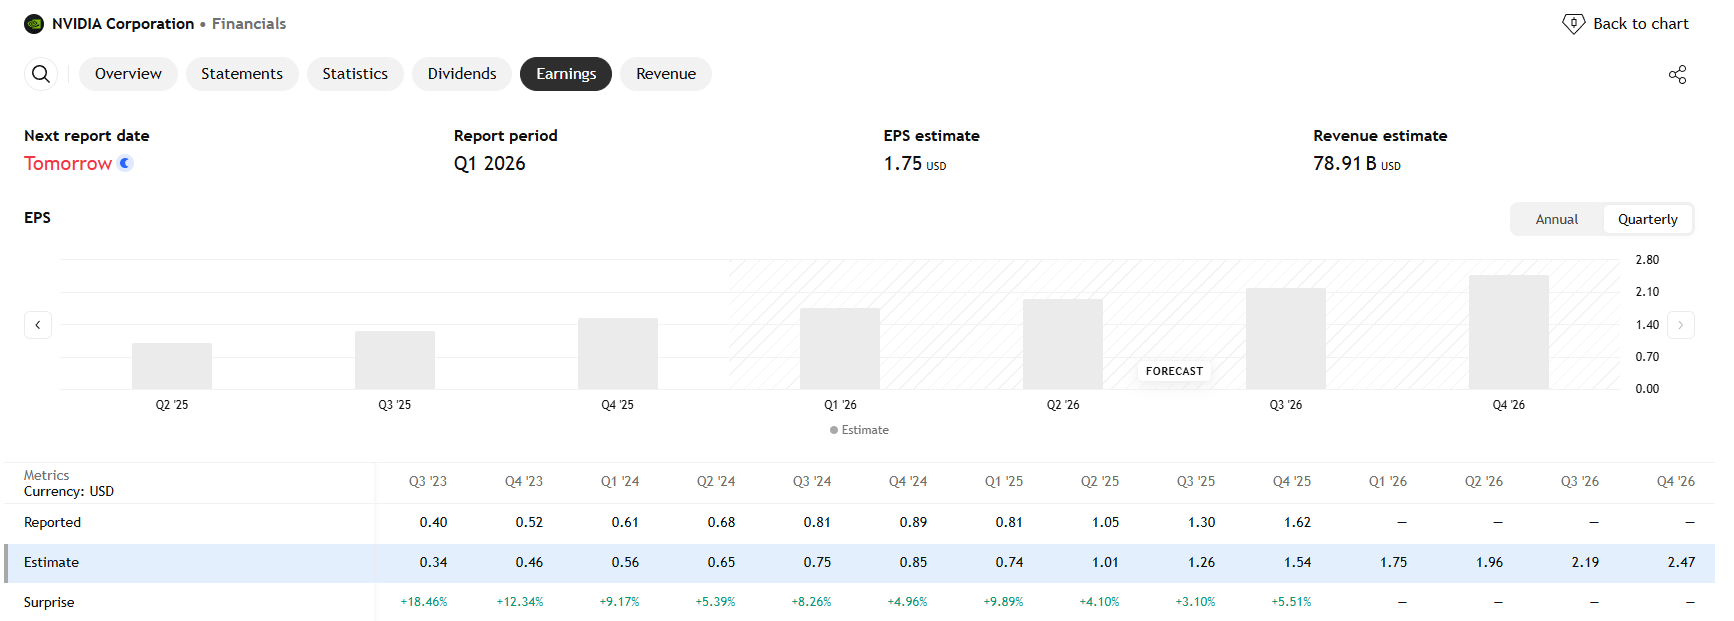
Market participants are already anticipating an earnings beat, as Nvidia has historically delivered them. The main focus remains on the CEO’s forward guidance, Jensen Huang.
Jensen Huang’s recent visit to China alongside US President Donald Trump has heightened traders’ focus on Wednesday’s earnings report, which could provide fresh updates on Nvidia’s business outlook in China.
In addition, Nvidia accounts for roughly 13%–14% of the Nasdaq-100 index, making its earnings a potentially major catalyst for broader risk sentiment. Meanwhile, there has been a strong positive correlation between the Nasdaq-100 and Bitcoin, so today’s report could inject fresh volatility into the crypto market, with BTC attempting to recover above the $77,000 ahead of the announcement.
Beyond the positive correlation, Nvidia also maintains indirect ties to the crypto sector through its high-performance chips, which are widely used in crypto mining and Artificial Intelligence (AI) related blockchain infrastructure. As a result, both NVIDIA and Bitcoin are often viewed as high-beta, risk-sensitive assets that tend to react strongly to shifts in investor sentiment, liquidity conditions and technology-driven market momentum.
In an exclusive interview with Nicolai Sondergaard, Research Analyst at Nansen, told FXStreet, "There is still a lot of uncertainty around how the market reads Nvidia tonight. If earnings beat, you could see risk appetite push toward $80,000 (maybe there are already some positive expectations as BTC has been up the past few hours), but it is too soon to tell whether that holds. If they disappoint, stablecoin inflows might accelerate instead. At this point open interest is at $2.17B but not extreme, so traders seem positioned without being overextended."
Why the FOMC meeting could bring volatility?
The macroeconomic outlook continues to keep a lid on the risk appetite. Last week’s hotter-than-expected US April inflation figures and Thursday’s US Retail Sales data continue to dampen the risk-on sentiment.
Moreover, uncertainty surrounding the war in the Middle East has boosted crude oil prices, prompting investors to worry about global inflation.
These fresh inflation concerns lifted market expectations for a more hawkish US Federal Reserve (Fed) and continue to act as a tailwind for the US Dollar (USD), while weighing on risky assets such as BTC.
Wednesday’s Federal Open Market Committee (FOMC) meeting minutes will provide more cues about the central bank’s policy path. If forward guidance is projected to be more hawkish due to inflation risks, this will lead the bank to tighten its policy, which generally doesn’t bode well for the Crypto King. In high-interest-rate environments, liquidity declines and markets shift towards safer, yield-bearing assets.
ETFs outflows continue
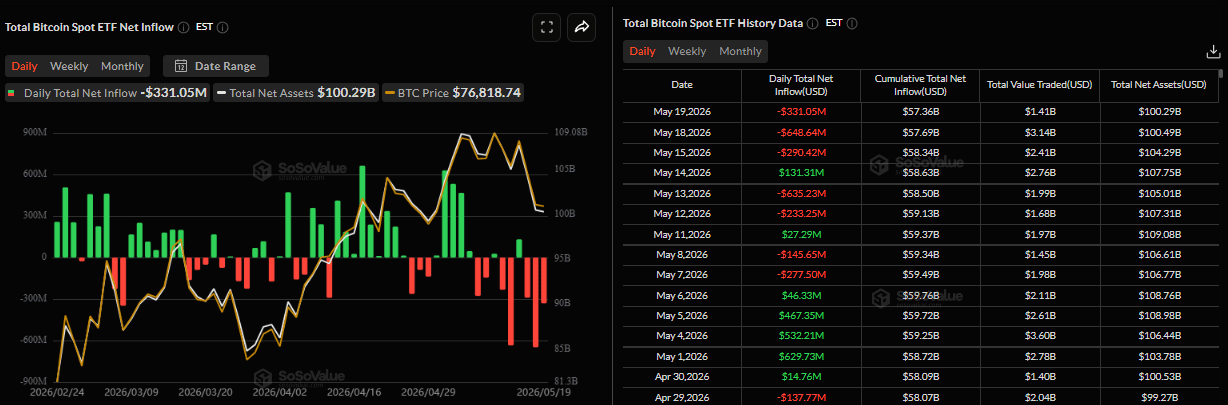
Institutional demand keeps fading so far this week. SoSoValue data showed that BTC spot ETFs recorded an outflow of $331.05 million on Tuesday after a $648.64 million outflow the previous day and a $1 billion total withdrawal the previous week. If this outflow trend continues and intensifies, BTC could see further correction.
Is capital rotating toward Bonds?
As discussed above, fading institutional demand continues to signal caution for Bitcoin. In addition, persistent geopolitical tensions, ongoing uncertainty surrounding the Strait of Hormuz, tightening global oil inventories and rising crude prices have pushed the US 10-year Treasury yields higher.
If bond yields remain elevated, investor appetite for riskier assets such as Bitcoin could weaken further as capital rotates toward safer yield-bearing assets, thereby decreasing the liquidity in cryptos.
Market participants should closely monitor this capital rotation, which could trigger intensified selling in BTC and potentially lead to a deeper correction.
Bitcoin Price Forecast: BTC support zone holds strong
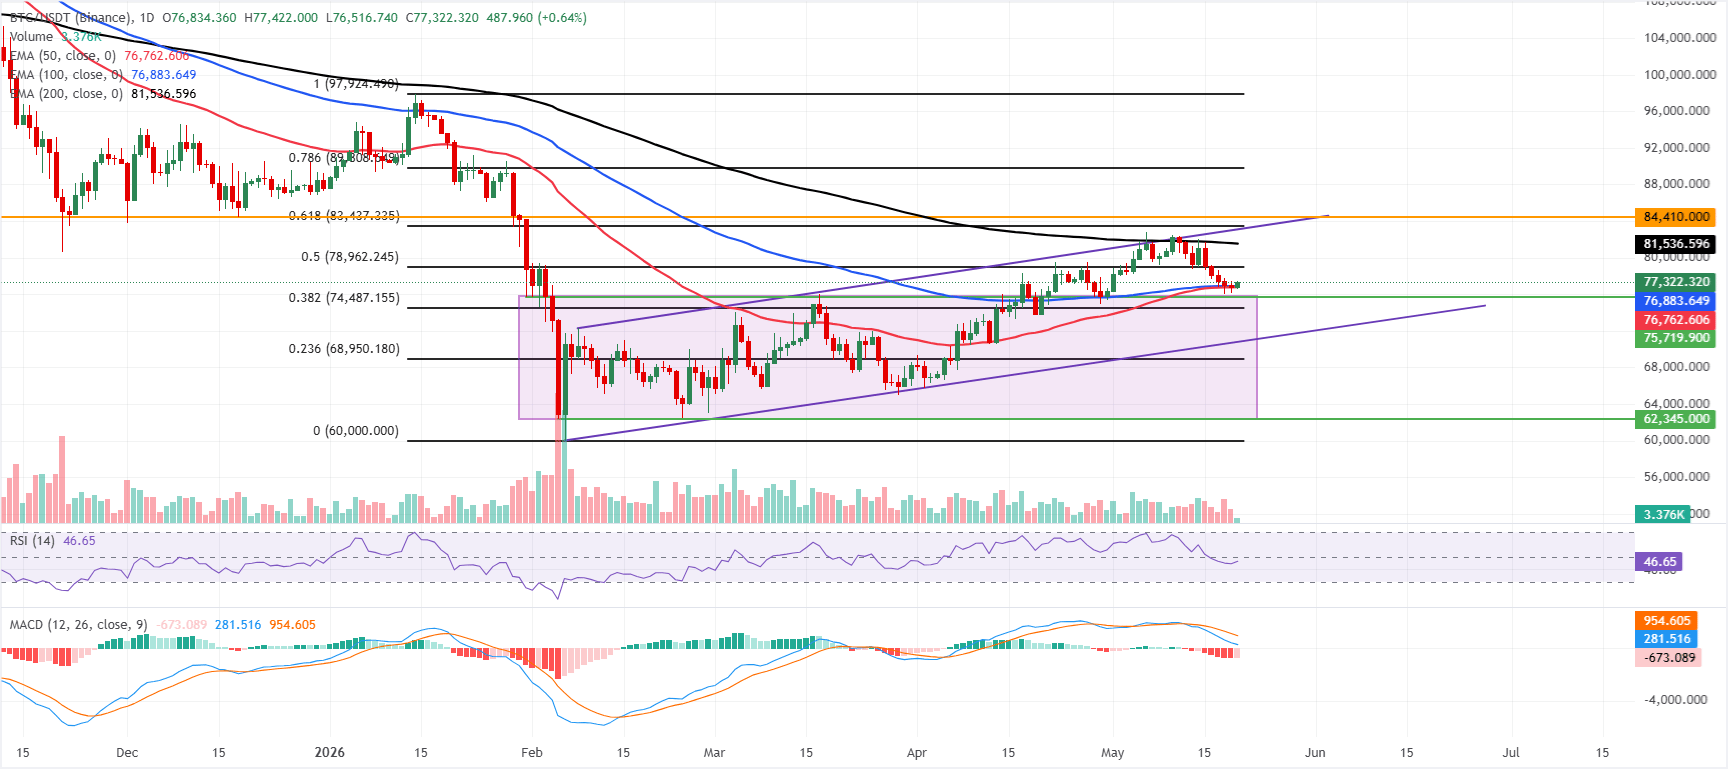
Bitcoin price recovers slightly, trading above $77,000 on Wednesday after finding support around the 50-day and 100-day Exponential Moving Averages (EMAs) near $76,762 and $76,883, respectively. This key technical area is roughly above the previously broken horizontal channel at $75,719, making it a key support zone.
The Crypto King remains capped below the 200-day EMA at $81,536, as well as higher Fibonacci and horizontal barriers. However, the underlying uptrend is still supported by the intact rising trend structure.
The Relative Strength Index around 47 and the negative Moving Average Convergence Divergence (MACD) below zero, both on the daily chart, hint that upside momentum is waning, leaving the price caught between nearby EMA support and a dense band of overhead resistance defined by Fibonacci retracements and a prior horizontal cap.
On the topside, initial resistance aligns with the the 50% Fibonacci retracement at $78,962 (drawn from the January high to the February low), ahead of the 200-day EMA at 81,536, with further barriers at the 61.8% Fibonacci retracement near $83,437 and the horizontal resistance around $84,410.
On the downside, immediate support is provided by the 100-day and 50-day EMAs, clustered just under spot, followed by the 38.2% Fibonacci level near $74,487. The former trendline break zone around $70,815 and the 23.6% Fibonacci retracement at $68,950 provide deeper cushioning if selling pressure extends.
(The technical analysis of this story was written with the help of an AI tool.)
Crypto ETF FAQs
An Exchange-Traded Fund (ETF) is an investment vehicle or an index that tracks the price of an underlying asset. ETFs can not only track a single asset, but a group of assets and sectors. For example, a Bitcoin ETF tracks Bitcoin’s price. ETF is a tool used by investors to gain exposure to a certain asset.
Yes. The first Bitcoin futures ETF in the US was approved by the US Securities & Exchange Commission in October 2021. A total of seven Bitcoin futures ETFs have been approved, with more than 20 still waiting for the regulator’s permission. The SEC says that the cryptocurrency industry is new and subject to manipulation, which is why it has been delaying crypto-related futures ETFs for the last few years.
Yes. The SEC approved in January 2024 the listing and trading of several Bitcoin spot Exchange-Traded Funds, opening the door to institutional capital and mainstream investors to trade the main crypto currency. The decision was hailed by the industry as a game changer.
The main advantage of crypto ETFs is the possibility of gaining exposure to a cryptocurrency without ownership, reducing the risk and cost of holding the asset. Other pros are a lower learning curve and higher security for investors since ETFs take charge of securing the underlying asset holdings. As for the main drawbacks, the main one is that as an investor you can’t have direct ownership of the asset, or, as they say in crypto, “not your keys, not your coins.” Other disadvantages are higher costs associated with holding crypto since ETFs charge fees for active management. Finally, even though investing in ETFs reduces the risk of holding an asset, price swings in the underlying cryptocurrency are likely to be reflected in the investment vehicle too.
추천 기사


