
Ripple Price Forecast: XRP plummets 14% from record high, could the decline extend?
- XRP delicately balances above support at $3.00 following a sharp drop to $2.95.
- Interest in XRP takes a hit as futures Open Interest dives below $10 billion.
- Liquidations surge, reaching $98 million, with long position holders bearing the brunt amid a potential long squeeze.
Ripple (XRP) trades slightly in the red on Thursday following a drastic extension of a drop from its record high of $3.66. XRP tested support at $2.95 amid the crash, before recovering to exchange hands at $3.15.
The derivatives market reflects the price decline, with the futures Open Interest (OI) making a sharp reversal below the $10 billion mark. Leveraged investors counted losses over the past 24 hours as liquidations surged almost tagging $100 million.
XRP claws back gains amid derivatives headwinds
XRP is facing a drastic change in market sentiment, evidenced by the drop in futures contract OI from a July peak of $10.94 billion. It is averaging $9.32 billion at the time of writing.
Such as drop implies that interest in the token is declining as traders reduce exposure or refrain from open new positions. Open Interest refers to the notional value of outstanding futures or options contracts. It is a measure of the amount of money invested in XRP derivatives at any given time.
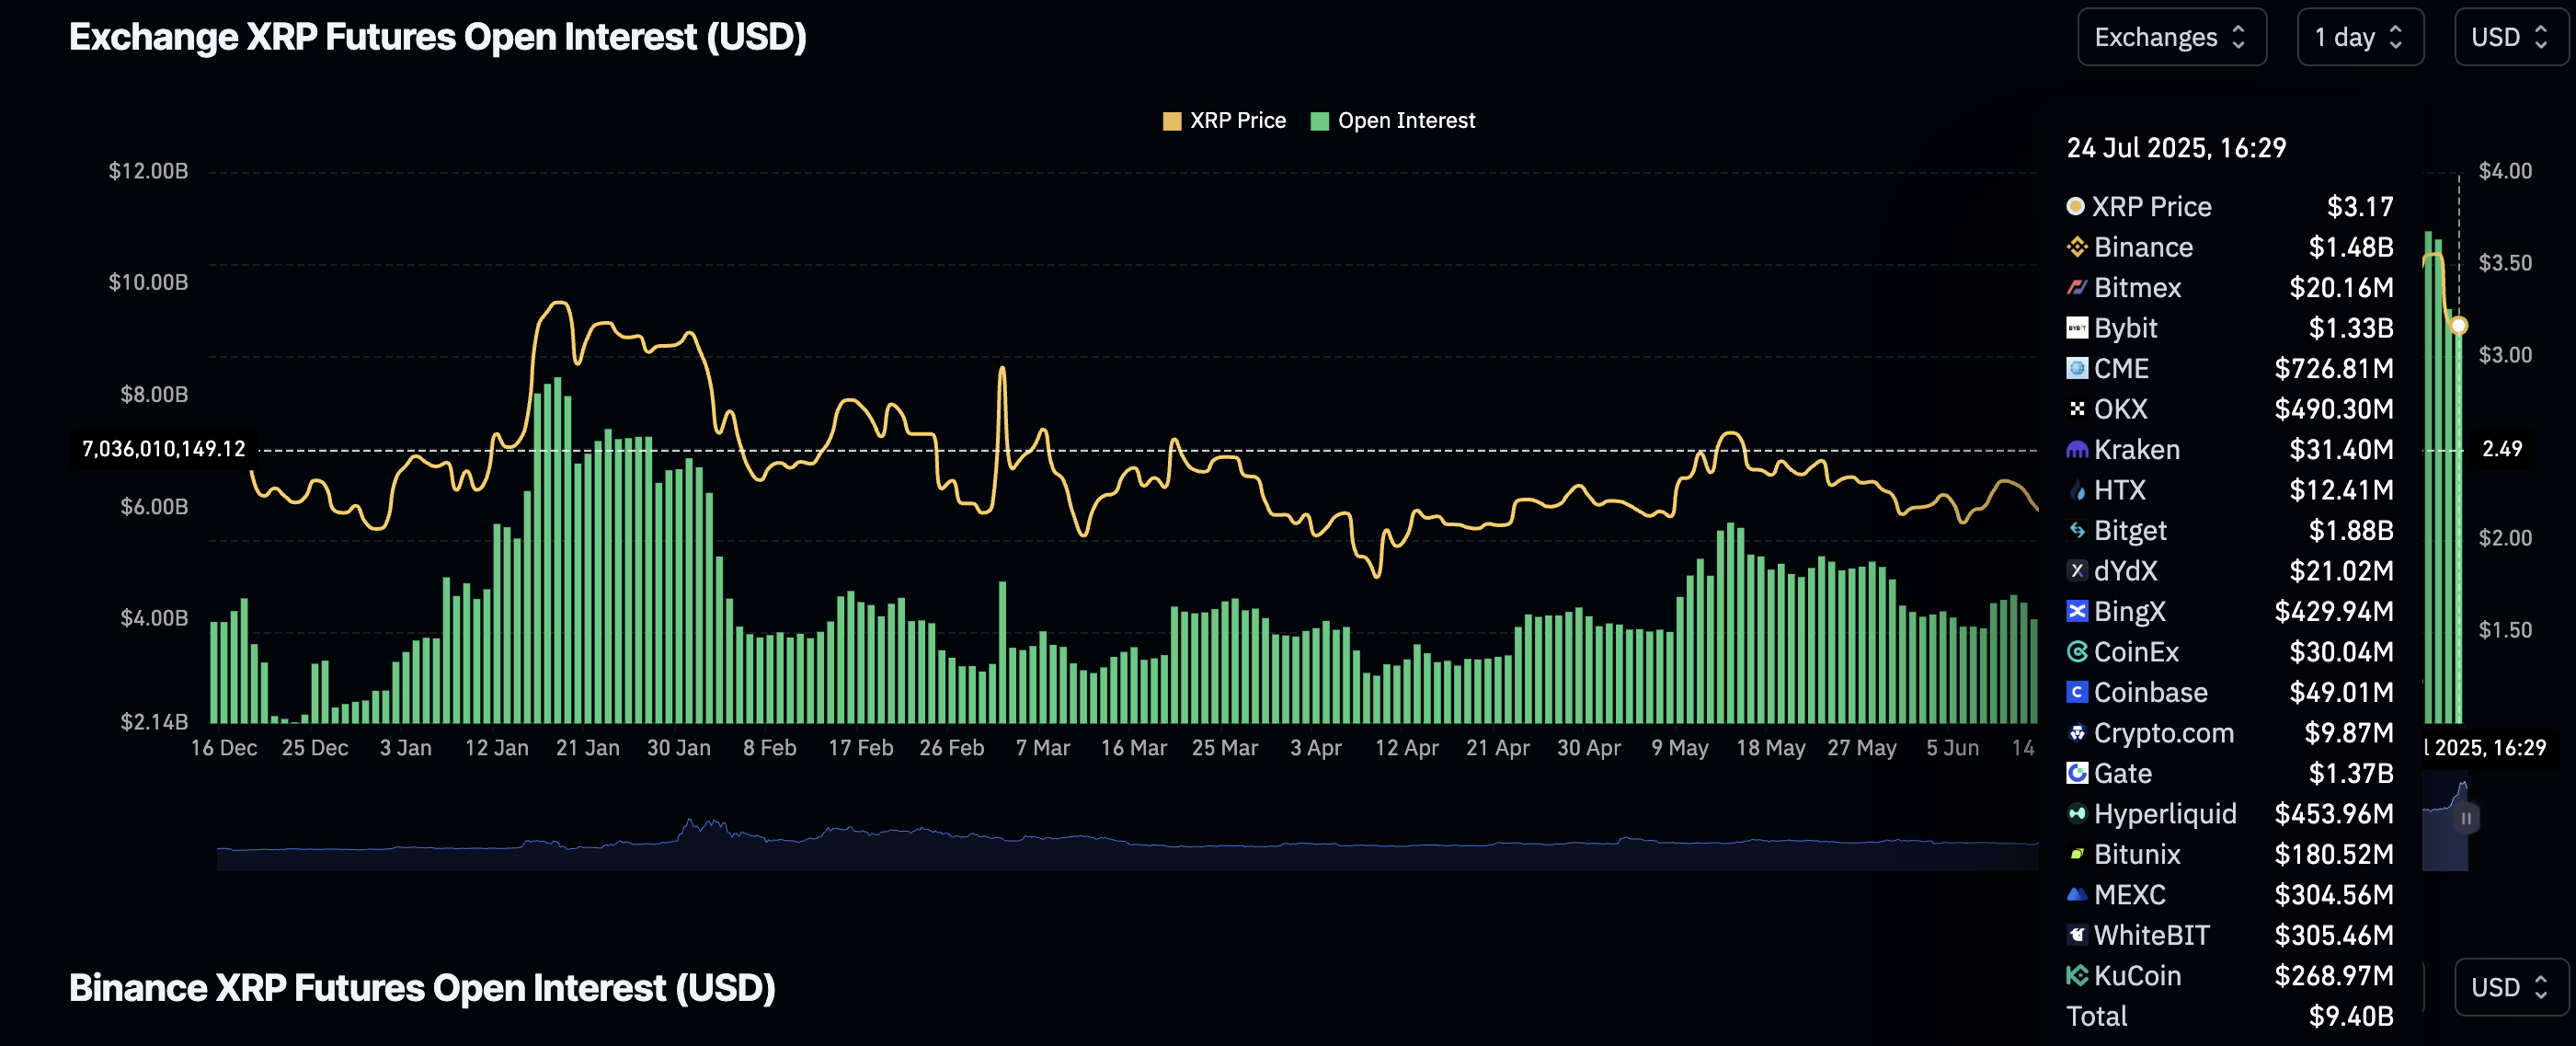
XRP Futures Open Interest chart | Source: CoinGlass
Should the reversal develop into a downward trend, it would indicate a lack of conviction in the ability of XRP to sustain an uptrend. Moreover, the surge in liquidations to $98 million over the last 24 hours, suggests XRP faces an upside heavy trend, likely to lead to a long squeeze and an extended sell-off.
Long position holders accounted for the majority of the losses at $86 million compared to $12 million wiped out in shorts. However, the liquidation of long positions has significantly reduced in the last four hours, as shown in the chart below, hinting at a potential increase in price.
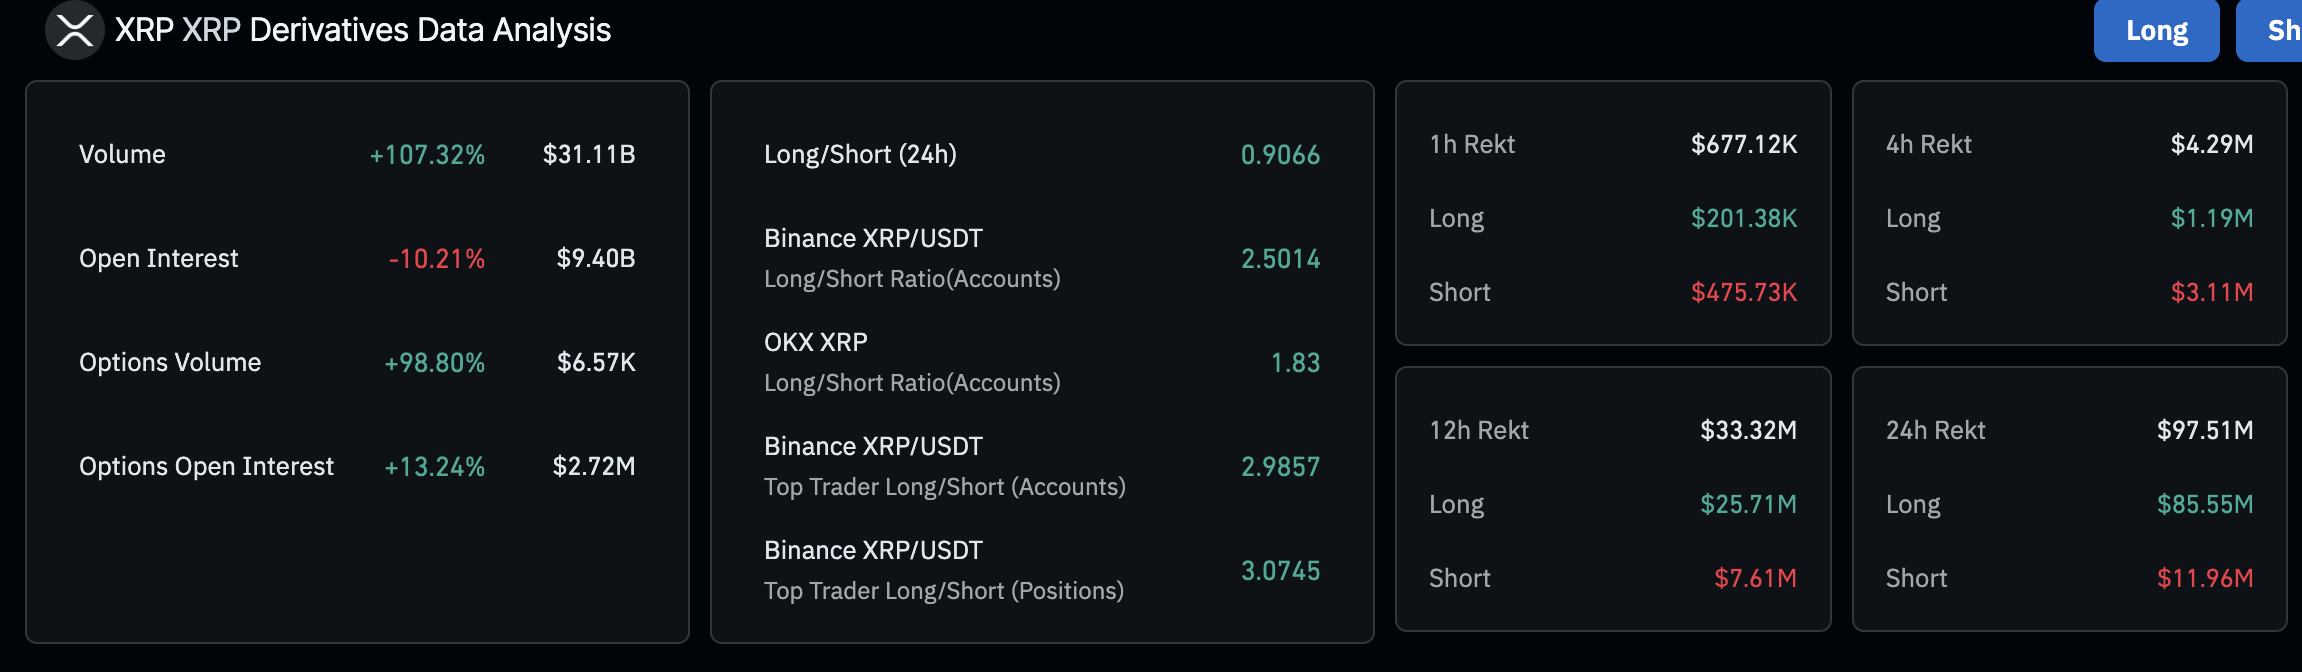
XRP derivatives market data Source: CoinGlass
Despite the crash, CryptoQuant said in Thursday’s Sentiment Analysis report that “a new ‘altcoin season’ may be underway.” The On-chain data analytics platform added that “the spot trading volume for altcoins totaled $67 billion on July 17, signaling renewed interest from traders for these types of coins.”
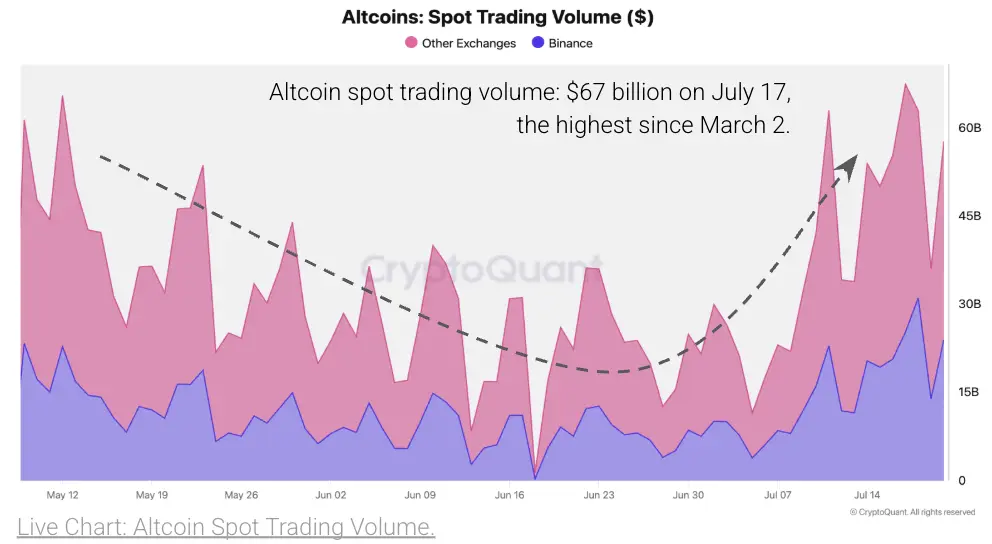
Altcoin spot trading volume
As for XRP, its Spot Volume Bubble Map highlights neutral conditions, otherwise referred to by CryptoQuant as decreasing. The map indicates that XRP is far from overheating conditions and may reverse the trend upward to reach fresh record highs above $3.66.
-1753368505755.png)
XRP Spot Volume Bubble Map | Source: CryptoQuant
Technical outlook: XRP recovery could be elusive
XRP price holds above support at $3.00, and by extension its intraday low of $2.95. The prevailing technical picture shows that it could be difficult to sustain a recovery unless bulls aggressively buy the dip to boost bullish momentum.
A downward-facing Relative Strength Index (RSI) at 61 reflects the short-term bearish outlook. If the RSI decline persists, bearish momentum could increase amid a reduction in buying pressure.
Still, traders should temper their bearish expectations at least until the Moving Average Convergence Divergence (MACD) validates a sell signal on the daily chart. Such a signal which often encourages investors to reduce exposure would manifest with the blue MACD line crossing and settling below the red signal line.
Red histogram bars below the zero line, a downward slope in the indicator and a sudden increase in volume are other factors that could help reinforce the bearish grip.
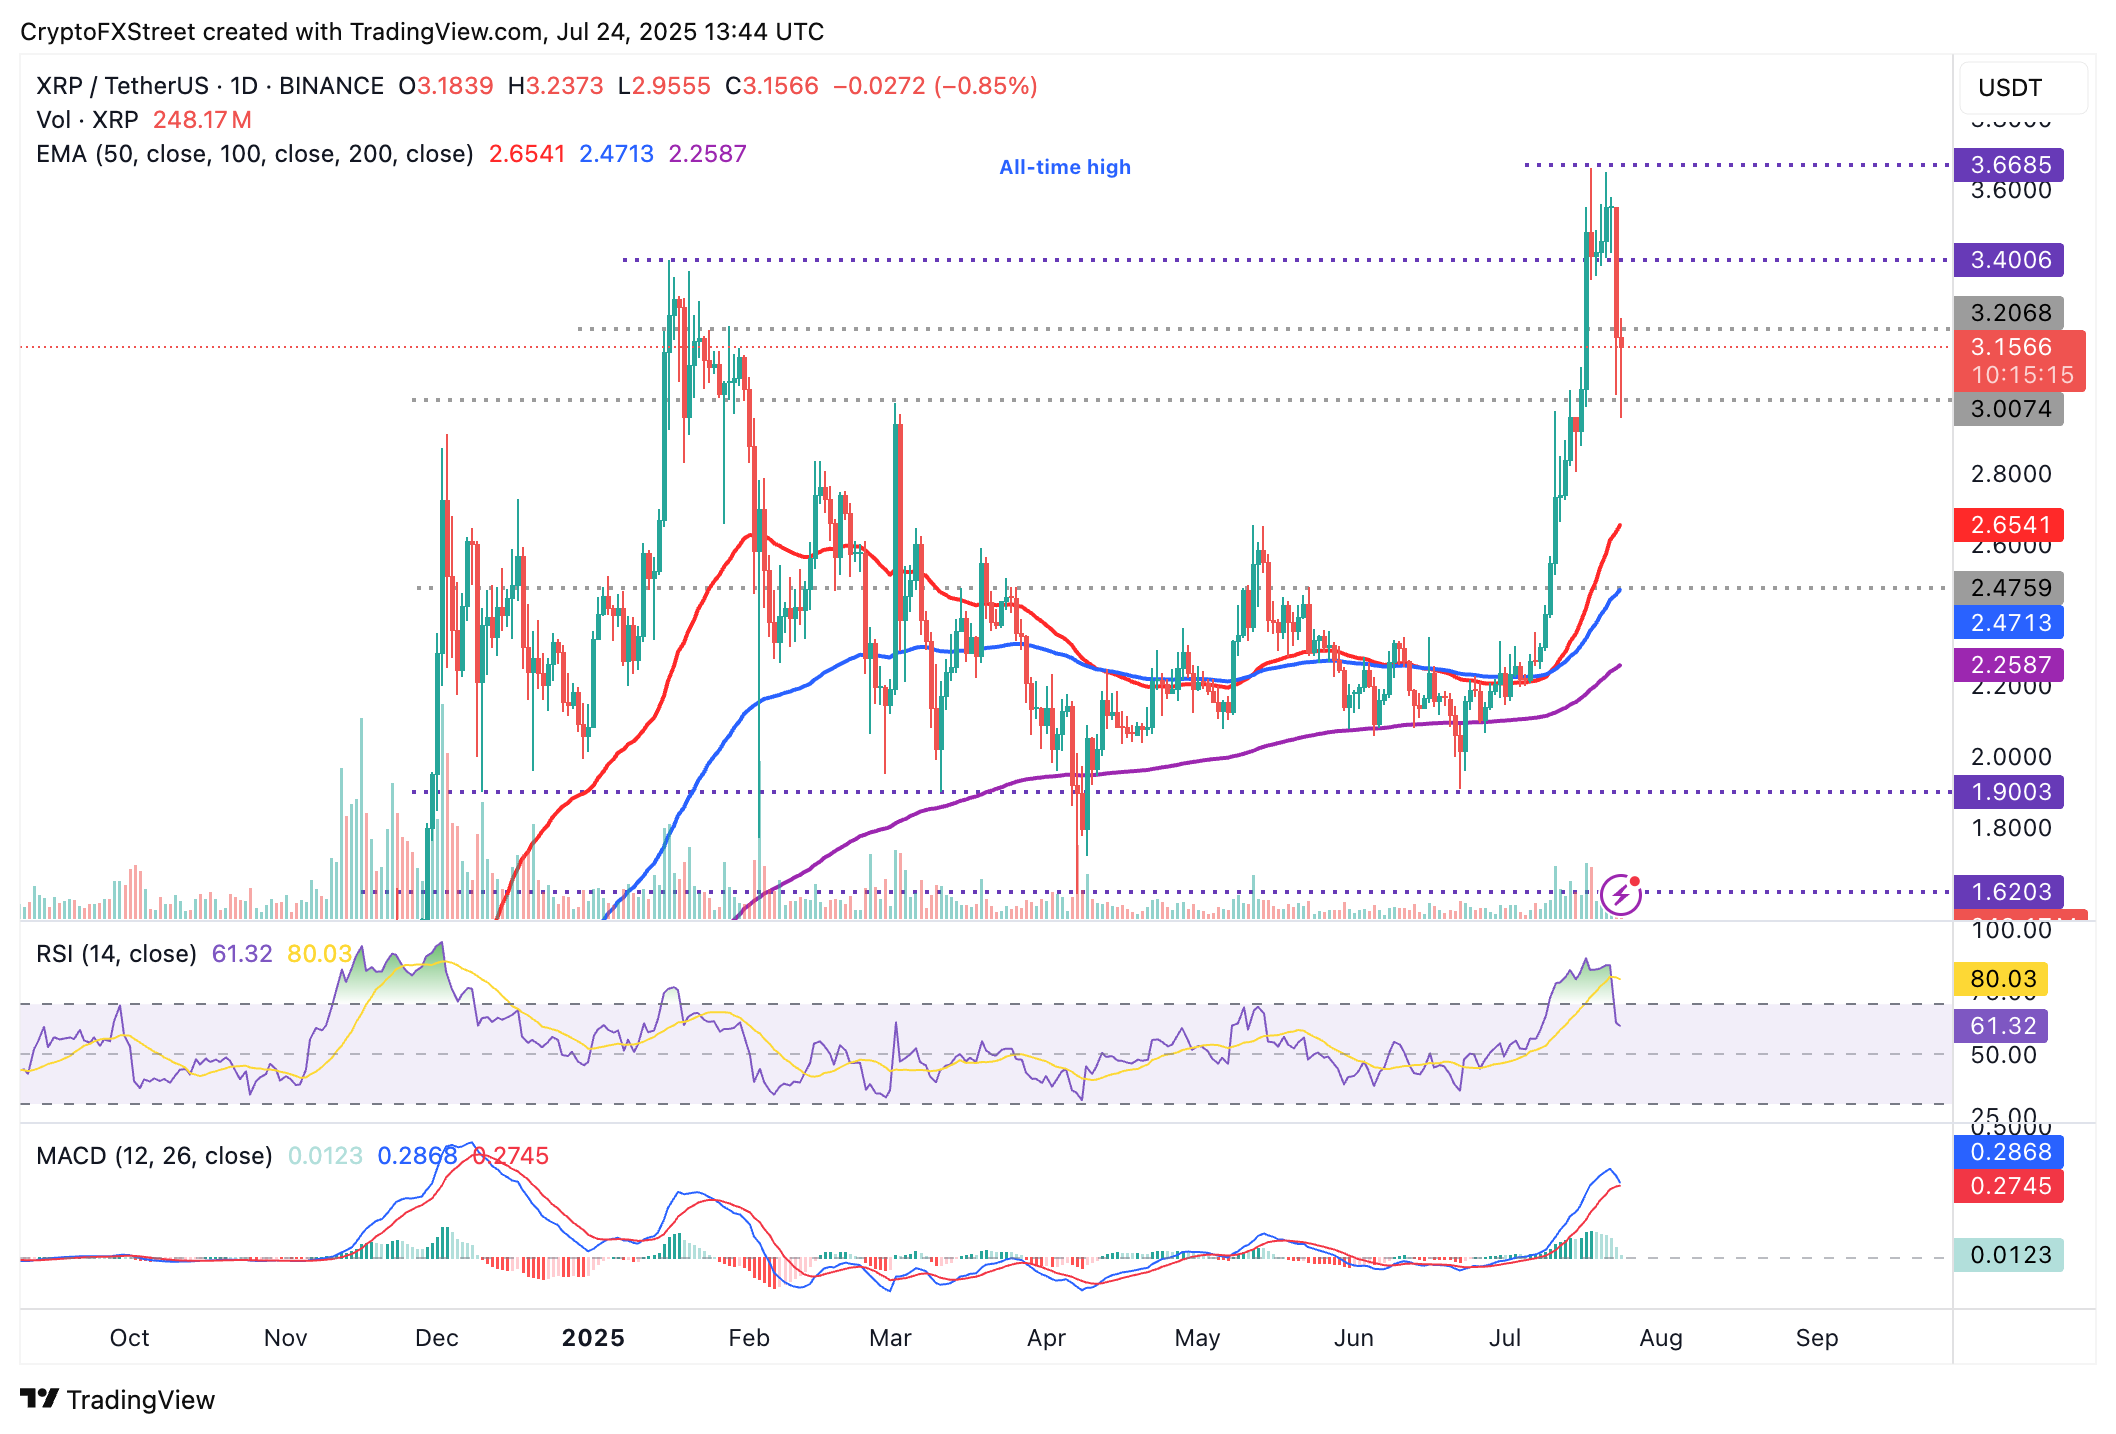
XRP/USDT daily chart
On other hand, the mid-term outlook of XRP remains bullish based on the upward trending moving averages. In the event the decline accelerates below $3.00, the 50-day Exponential Moving Average (EMA) at $2.65, the 100-day EMA at $2.47, and the 200-day EMA at $2.25 would be in line as tentative support levels to prevent XRP from falling below the critical $2.00.
Cryptocurrency prices FAQs
Token launches influence demand and adoption among market participants. Listings on crypto exchanges deepen the liquidity for an asset and add new participants to an asset’s network. This is typically bullish for a digital asset.
A hack is an event in which an attacker captures a large volume of the asset from a DeFi bridge or hot wallet of an exchange or any other crypto platform via exploits, bugs or other methods. The exploiter then transfers these tokens out of the exchange platforms to ultimately sell or swap the assets for other cryptocurrencies or stablecoins. Such events often involve an en masse panic triggering a sell-off in the affected assets.
Macroeconomic events like the US Federal Reserve’s decision on interest rates influence crypto assets mainly through the direct impact they have on the US Dollar. An increase in interest rate typically negatively influences Bitcoin and altcoin prices, and vice versa. If the US Dollar index declines, risk assets and associated leverage for trading gets cheaper, in turn driving crypto prices higher.
Halvings are typically considered bullish events as they slash the block reward in half for miners, constricting the supply of the asset. At consistent demand if the supply reduces, the asset’s price climbs.
추천 기사


