
Bitcoin Price Forecast: BTC bears aim for $100k as escalation in Russia-Ukraine war sparks risk-off sentiment
- Bitcoin extends its decline on Monday after falling over 3% in the previous week.
- Market sentiment sours as the Russia-Ukraine war escalates, signaling weakness in risky assets like BTC.
- Bitcoin spot ETF inflow records a mild weekly outflow while MetaPlanet adds 1,088 BTC on Monday.
Bitcoin (BTC) is extending its decline on Monday, trading below $105,000 at the time of writing after falling over 3% last week. The largest cryptocurrency by market capitalization weakens as geopolitical tensions escalate, with the Russia-Ukraine conflict intensifying and driving investors toward safe-haven assets. Moreover, Bitcoin spot Exchange Traded Funds (ETFs) recorded a modest outflow last week, while MetaPlanet adds 1,088 BTC to its treasury.
Risk-on sentiment fades as geopolitical uncertainty increases
BBC reports on Monday that Ukraine completed its biggest long-range attack of the war with Russia on Sunday, targeting four airbases and damaging 40 Russian warplanes.
The covert operation, the so-called “Spider’s Web,” used 117 drones, striking 34% of Russia’s strategic cruise missile carriers, said Ukraine’s President Volodymyr Zelensky.
Russia confirmed these attacks in five regions, calling them a “terrorist act,” reports BBC.
The peace talks between the two countries are set to resume in Istanbul on Monday, but the likelihood of negotiations yielding meaningful progress toward ending the Russia-Ukraine war is slim.
These rising war tensions and geopolitical uncertainties are driving investors toward safe-haven assets, such as Gold (XAU), which brings a risk-off sentiment to the market, not boding well for the Bitcoin price.
Institutional flow raises some early signs of concern
Institutional demand for Bitcoin weakened last week. According to SoSoValue data, Bitcoin spot ETFs experienced a mild outflow of $157.40 million last week, marking a break in their long-standing weekly streak of inflows since mid-April. This outflow is weak as compared to the flow seen during Feburary. However, if this outflow intensifies, then the Bitcoin price could see a sharp decline in the upcoming days.
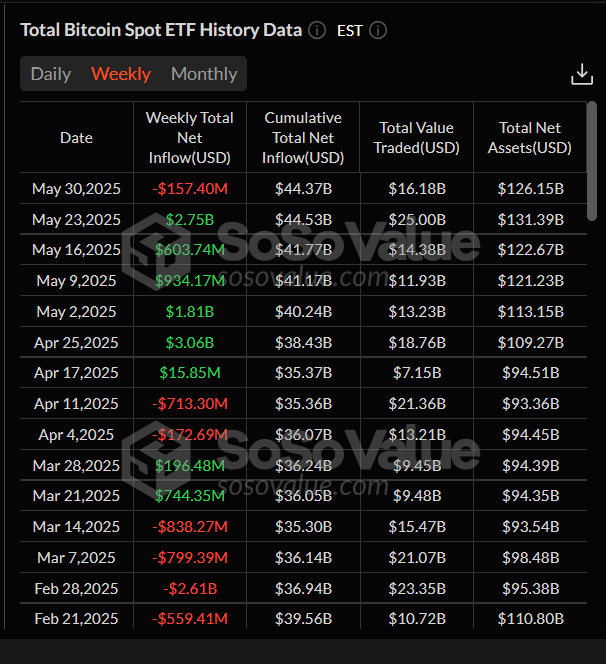
Total Bitcoin Spot ETFs weekly chart. Source: SoSoValue
Despite signs of weakness in Bitcoin ETFs, Japanese investment firm Metaplanet announced on Monday that it had purchased an additional 1,088 BTC. The firm currently holds a total of 8,888 BTC. If the corporate companies’ demand for BTC continues, it could act as a cushion for any price dips in Bitcoin prices.
What is there for Bitcoin in June?
Bitcoin reached a new all-time high of $111,980 in May, marking a return of nearly 11% for the month. According to Bitcoin’s historical data, BTC generally yielded the second-lowest return for traders in June, averaging a loss of 0.30%. If the ETFs’ demand continues to weaken, holders realize profits (increasing selling pressure), and tariffs and geopolitical uncertainty gain momentum, traders should be cautious of a correction in June.
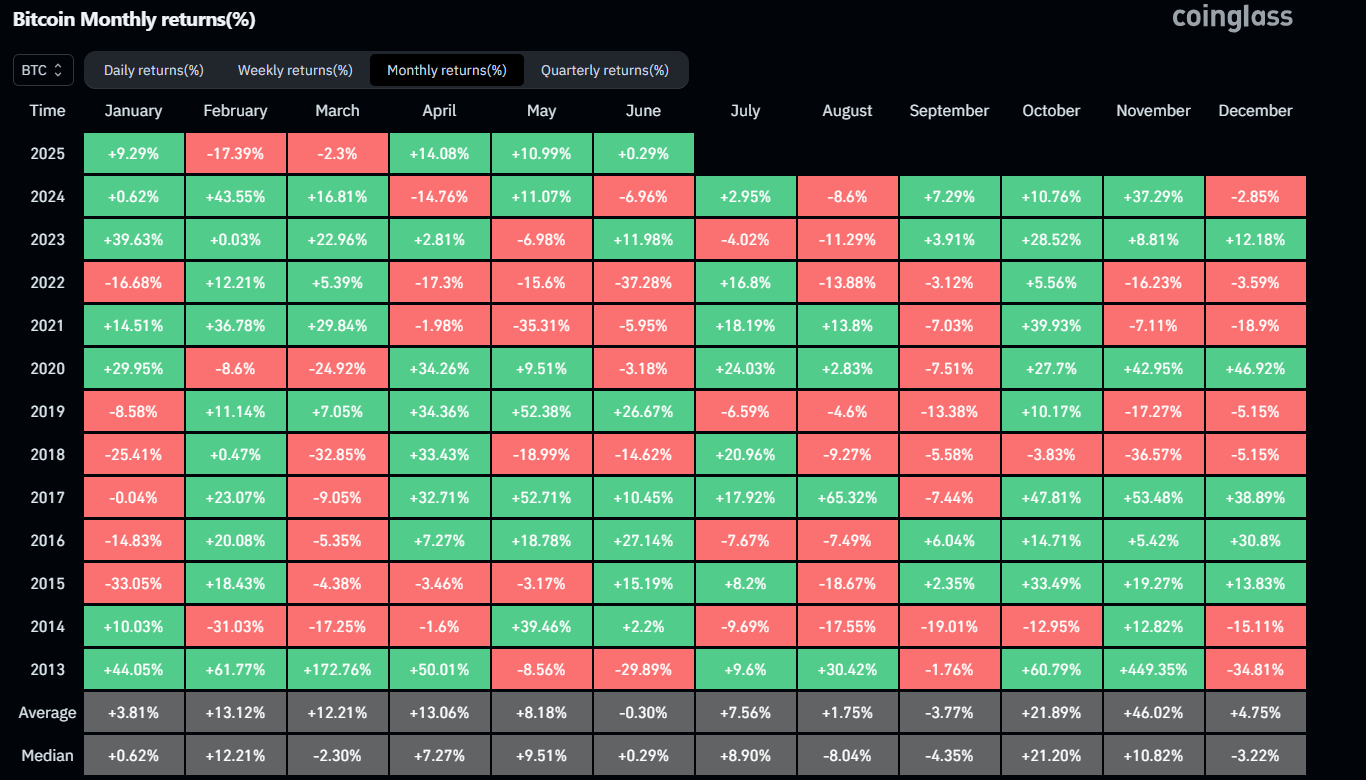
Bitcoin historical monthly returns chart. Source: Coinglass
Bitcoin Price Forecast: BTC bears target $100k mark
Bitcoin price closed below the daily support level of $106,406 on Thursday and declined by 1.50% the following day. However, it recovered slightly during the weekend. At the time of writing on Monday, it trades below $105,500.
Suppose BTC faces resistance around the $106,406 daily level and continues its correction. It could extend the decline to revisit the psychologically important level of $100,000.
The Relative Strength Index (RSI) on the daily chart reads 53, pointing downward toward its neutral level of 50, indicating fading bullish momentum. The Moving Average Convergence Divergence (MACD) also showed a bearish crossover last week. It also shows rising red histogram bars below its neutral level, indicating a correction ahead.
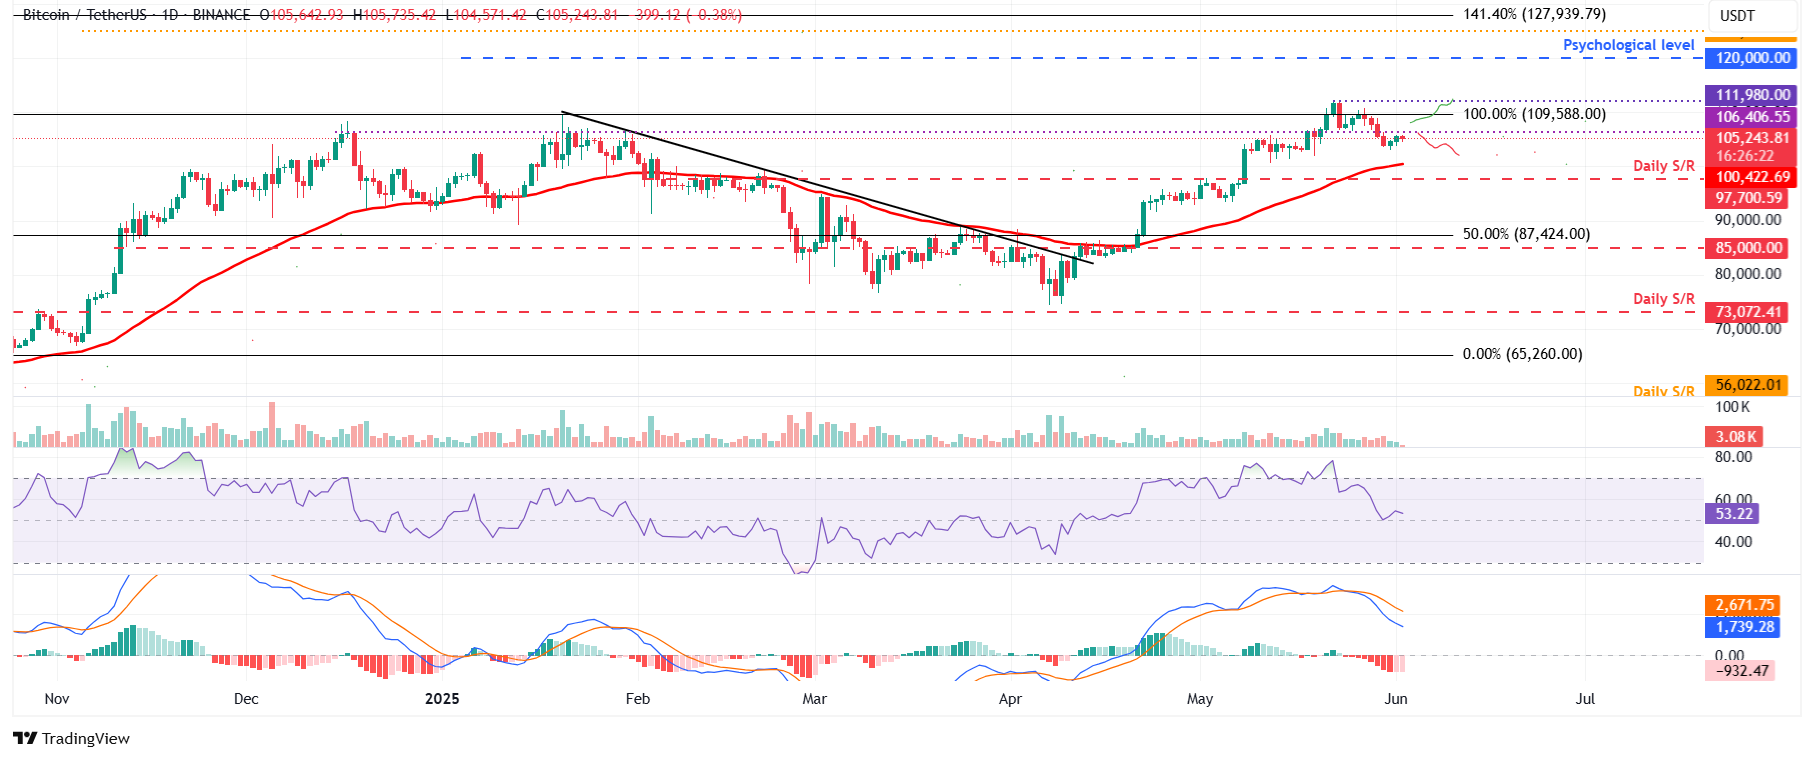
BTC/USDT daily chart
However, if BTC recovers and closes above $106,406, it could extend the rally toward its all-time high of $111,980.
Crypto ETF FAQs
An Exchange-Traded Fund (ETF) is an investment vehicle or an index that tracks the price of an underlying asset. ETFs can not only track a single asset, but a group of assets and sectors. For example, a Bitcoin ETF tracks Bitcoin’s price. ETF is a tool used by investors to gain exposure to a certain asset.
Yes. The first Bitcoin futures ETF in the US was approved by the US Securities & Exchange Commission in October 2021. A total of seven Bitcoin futures ETFs have been approved, with more than 20 still waiting for the regulator’s permission. The SEC says that the cryptocurrency industry is new and subject to manipulation, which is why it has been delaying crypto-related futures ETFs for the last few years.
Yes. The SEC approved in January 2024 the listing and trading of several Bitcoin spot Exchange-Traded Funds, opening the door to institutional capital and mainstream investors to trade the main crypto currency. The decision was hailed by the industry as a game changer.
The main advantage of crypto ETFs is the possibility of gaining exposure to a cryptocurrency without ownership, reducing the risk and cost of holding the asset. Other pros are a lower learning curve and higher security for investors since ETFs take charge of securing the underlying asset holdings. As for the main drawbacks, the main one is that as an investor you can’t have direct ownership of the asset, or, as they say in crypto, “not your keys, not your coins.” Other disadvantages are higher costs associated with holding crypto since ETFs charge fees for active management. Finally, even though investing in ETFs reduces the risk of holding an asset, price swings in the underlying cryptocurrency are likely to be reflected in the investment vehicle too.
추천 기사


