

Bitcoin Price Forecast: BTC could hit $110,000, supported by the Fed’s dovish stance and Trump’s flexibility on tariffs
- Bitcoin price hovers above $87,000 on Monday after recovering 4.25% last week.
- BitMEX co-founder Arthur Hayes predicts BTC could hit $110,000 before retracing to $76,500.
- US Bitcoin spot ETF data recorded a total net inflow of $744.30 million last week.
Bitcoin (BTC) price extends its gains and trade above $87,400 at the time of writing on Monday after recovering 4.25% last week. BitMEX co-founder Arthur Hayes predicts that BTC could hit $110,000 before retracing to $76,500, supported by the US Federal Reserve’s (Fed) dovish stance on inflation and United States (US) President Donald Trump’s flexibility on tariffs. The US spot Exchange Traded Funds (ETFs) also supported BTC recovery as it recorded $744.30 million inflows last week.
Bitcoin could ‘hit $110,000’ – says BitMEX co-founder Arthur Hayes
Bitcoin price edges slightly higher, trading above $87,000 during the early European session on Monday after recovering nearly 5% the previous week. This recovery was fueled by the news that the White House is narrowing its approach to tariffs set to take effect on April 2, likely omitting a set of industry-specific tariffs while applying reciprocal levies on a targeted set of nations that account for the bulk of foreign trade with the US.
Moreover, BitMEX co-founder Arthur Hayes predicted that BTC could hit $110,000 before retracing to $76,500 on an X post on Monday. According to Hayes, the US Federal Reserve’s dovish stance on inflation and President Trump’s flexibility on tariffs could be the catalysts that could ease market concerns and possibly strengthen investor confidence.
Bitcoin institutional demand shows signs of a comeback
Diving down into Bitcoin’s institutional demand, it shows signs of strength. According to Coinglass, Bitcoin spot ETF data recorded net inflows of $744.30 million last week, after $830.50 million outflows in the previous week. Bitcoin’s price could recover further if this inflow continues and intensifies, indicating a reduction in sell-side pressure.
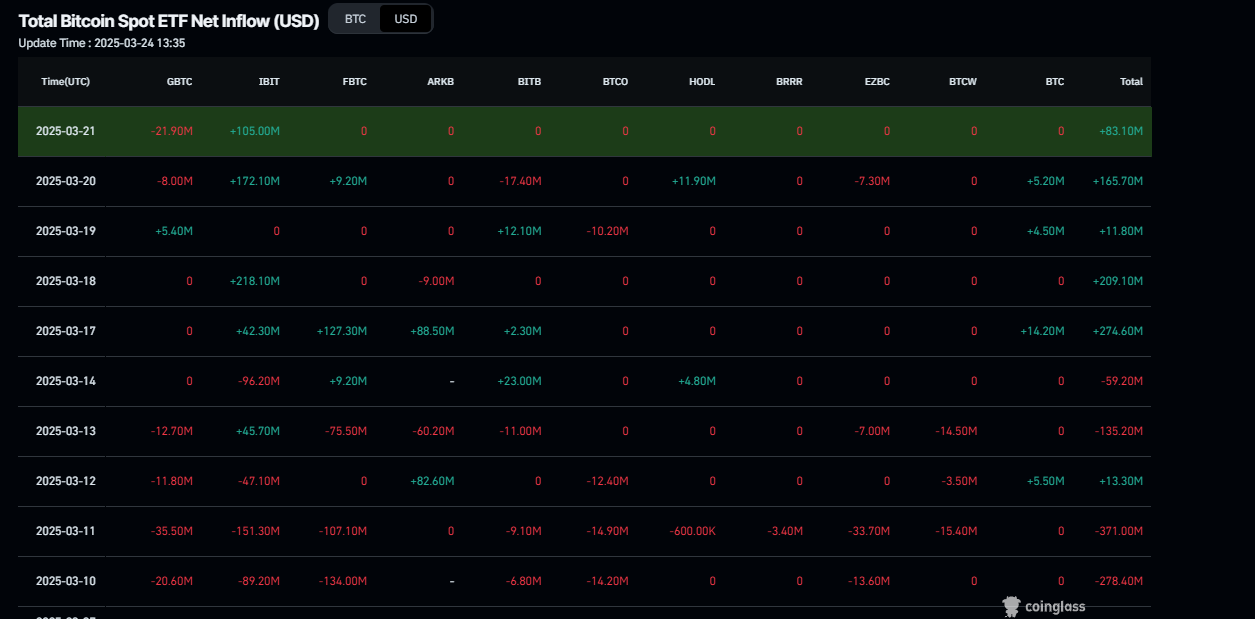
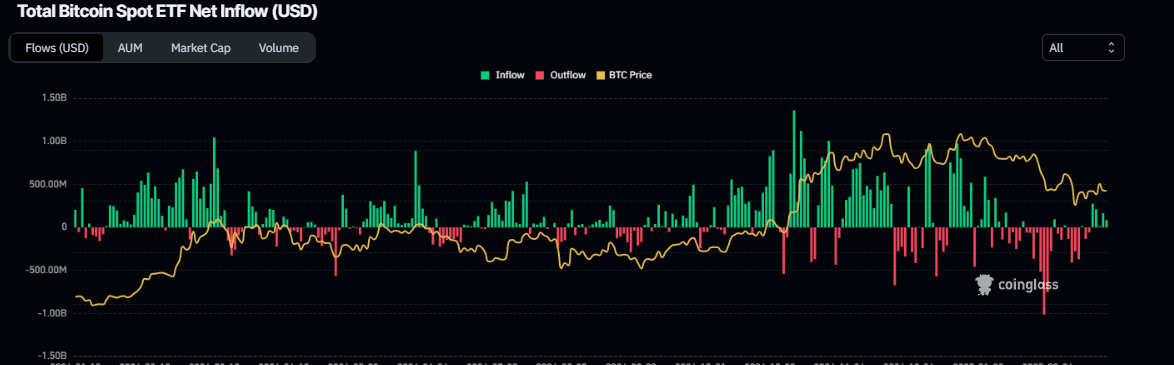
Total Bitcoin spot ETF net inflow chart. Source: Coinglass
CryptoQuant data shows that the amount of stablecoins (ERC-20) available on Binance has reached a new all-time high, surpassing $31 billion. This rise indicates that the investors in Binance remain confident and are preparing to enter or re-enter the market, which is generally a bullish sign. Additionally, the exchange may be boosting its stablecoin reserves to accommodate demand from investors still looking to hedge and for the incoming liquidity.
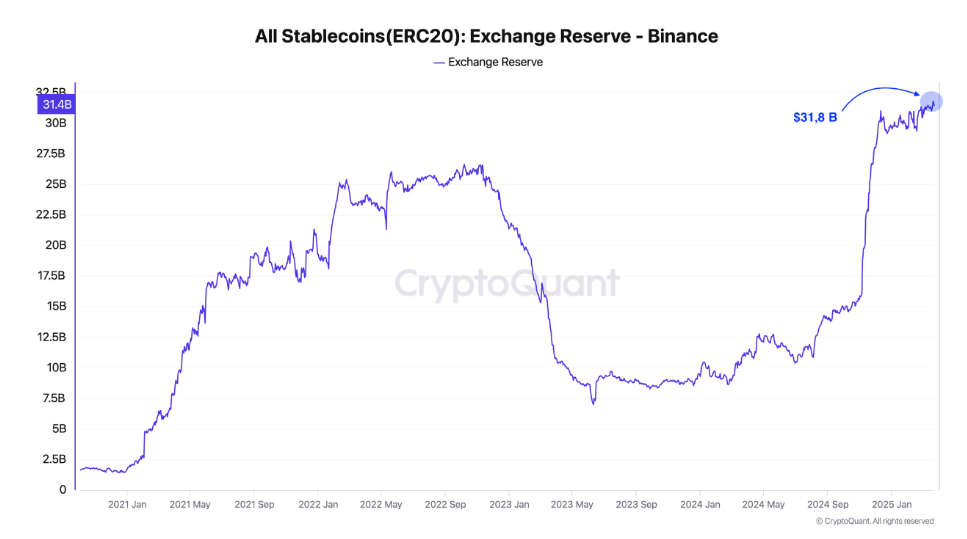
All Stablecoin (ERC-20) exchange reserve Binance chart. Source: CryptoQuant
Bitcoin Price Forecast: BTC bulls aim for the $90,000 mark
Bitcoin price broke and closed above its 200-day Exponential Moving Average (EMA) on Wednesday but failed to find support, consolidating around it the rest of the week. Moreover, BTC broke and closed above its 200-day EMA again on Sunday. At the time of writing on Monday, it trades slightly above $87,400.
If BTC finds support around its 200-day EMA at $85,519, it could extend the recovery to retest the key psychological level of $90,000. A successful close above this level could extend an additional rally toward its March 2 high of $95,269.
The Relative Strength Index (RSI) on the daily chart reads 51, above its neutral level of 50, and points upward, indicating increasing bullish momentum. The Moving Average Convergence Divergence (MACD) indicator showed a bullish crossover on the daily chart last week, giving a buy signal and suggesting a bullish trend ahead. Additionally, it shows rising green histogram levels above its neutral level of zero, indicating strength in upward momentum.
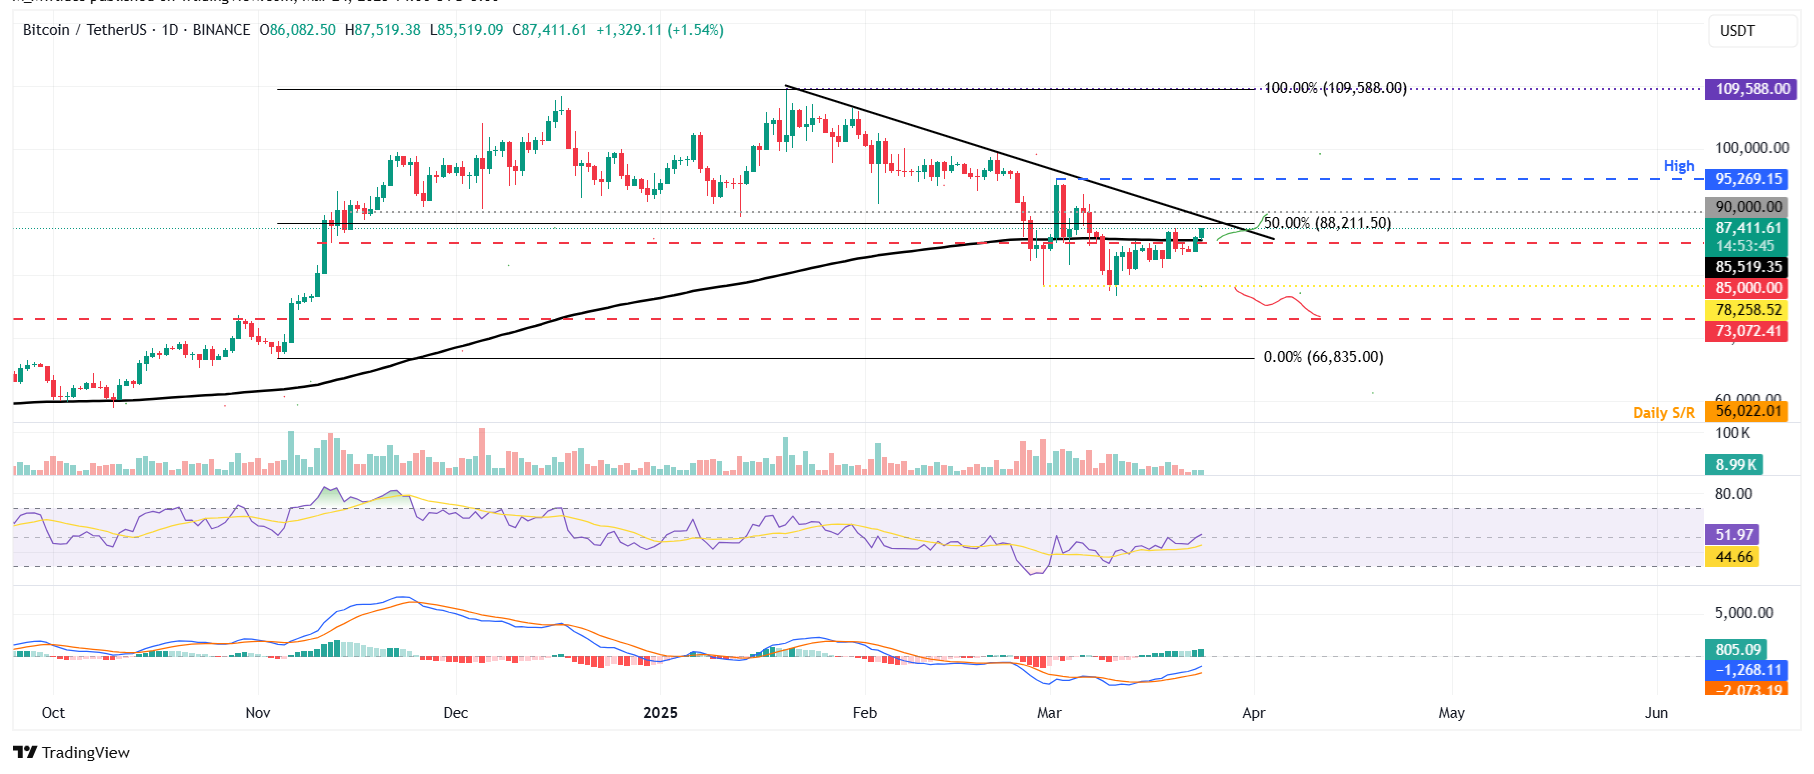
BTC/USDT daily chart
However, if BTC fails to find support around its 200-day EMA and closes below $85,000, it could extend the decline to retest its next support level at $78,258Bitcoin, altcoins, stablecoins FAQs
Bitcoin is the largest cryptocurrency by market capitalization, a virtual currency designed to serve as money. This form of payment cannot be controlled by any one person, group, or entity, which eliminates the need for third-party participation during financial transactions.
Altcoins are any cryptocurrency apart from Bitcoin, but some also regard Ethereum as a non-altcoin because it is from these two cryptocurrencies that forking happens. If this is true, then Litecoin is the first altcoin, forked from the Bitcoin protocol and, therefore, an “improved” version of it.
Stablecoins are cryptocurrencies designed to have a stable price, with their value backed by a reserve of the asset it represents. To achieve this, the value of any one stablecoin is pegged to a commodity or financial instrument, such as the US Dollar (USD), with its supply regulated by an algorithm or demand. The main goal of stablecoins is to provide an on/off-ramp for investors willing to trade and invest in cryptocurrencies. Stablecoins also allow investors to store value since cryptocurrencies, in general, are subject to volatility.
Bitcoin dominance is the ratio of Bitcoin's market capitalization to the total market capitalization of all cryptocurrencies combined. It provides a clear picture of Bitcoin’s interest among investors. A high BTC dominance typically happens before and during a bull run, in which investors resort to investing in relatively stable and high market capitalization cryptocurrency like Bitcoin. A drop in BTC dominance usually means that investors are moving their capital and/or profits to altcoins in a quest for higher returns, which usually triggers an explosion of altcoin rallies.
추천 기사


