

XRP traders take over $8 million in profits, Ripple back above $0.57
- Ripple traders take $8.36 million in profits on Thursday, Santiment data shows.
- XRP holds steady above $0.57 support, posting nearly 1% gains on the day.
- Ripple active addresses increased by nearly 30% since August 25, close to 20,000, at the time of writing.
Ripple (XRP) traders have consistently taken profits on their holdings in the last two weeks, per Santiment data. Once again, traders have grabbed $8.36 million in profit so far on Thursday. Typically, profit-taking negatively influences the asset as it increases the selling pressure.
However, XRP holds steady above key support at $0.57 at the time of writing, advancing close to 1% at the time of writing.
Daily digest market movers: Ripple traders take profits per on-chain data
- Data from crypto intelligence tracker Santiment shows that Ripple traders have taken $8.36 million in profits so far on Thursday, August 29.
- Profit taking in large volumes increases the volume of the asset in exchange wallets and increases the selling pressure on the asset.
- If traders continue profit-taking in large volumes, XRP could slip lower.
 [20.13.53, 29 Aug, 2024]-638605425908446685.png)
XRP network realized profit/loss
- XRP active addresses increased by nearly 30% between August 25 and 29. Active addresses are up to nearly 20,000 at the time of writing.
 [20.13.28, 29 Aug, 2024]-638605426267320307.png)
XRP active addresses
- On-chain metrics show mixed signals as to where XRP is headed next. Higher activity is typically a sign of gains. However, combined with profit-taking, XRP price could decline.
Technical analysis: XRP could slip by 9% and extend losses
XRP is in a multi-month downward trend. The altcoin could suffer a 9.23% decline and sweep liquidity at $0.5194, extending its losses.
Relative Strength Index (RSI) reads 47.76 on the daily time frame. RSI is under the neutral level.
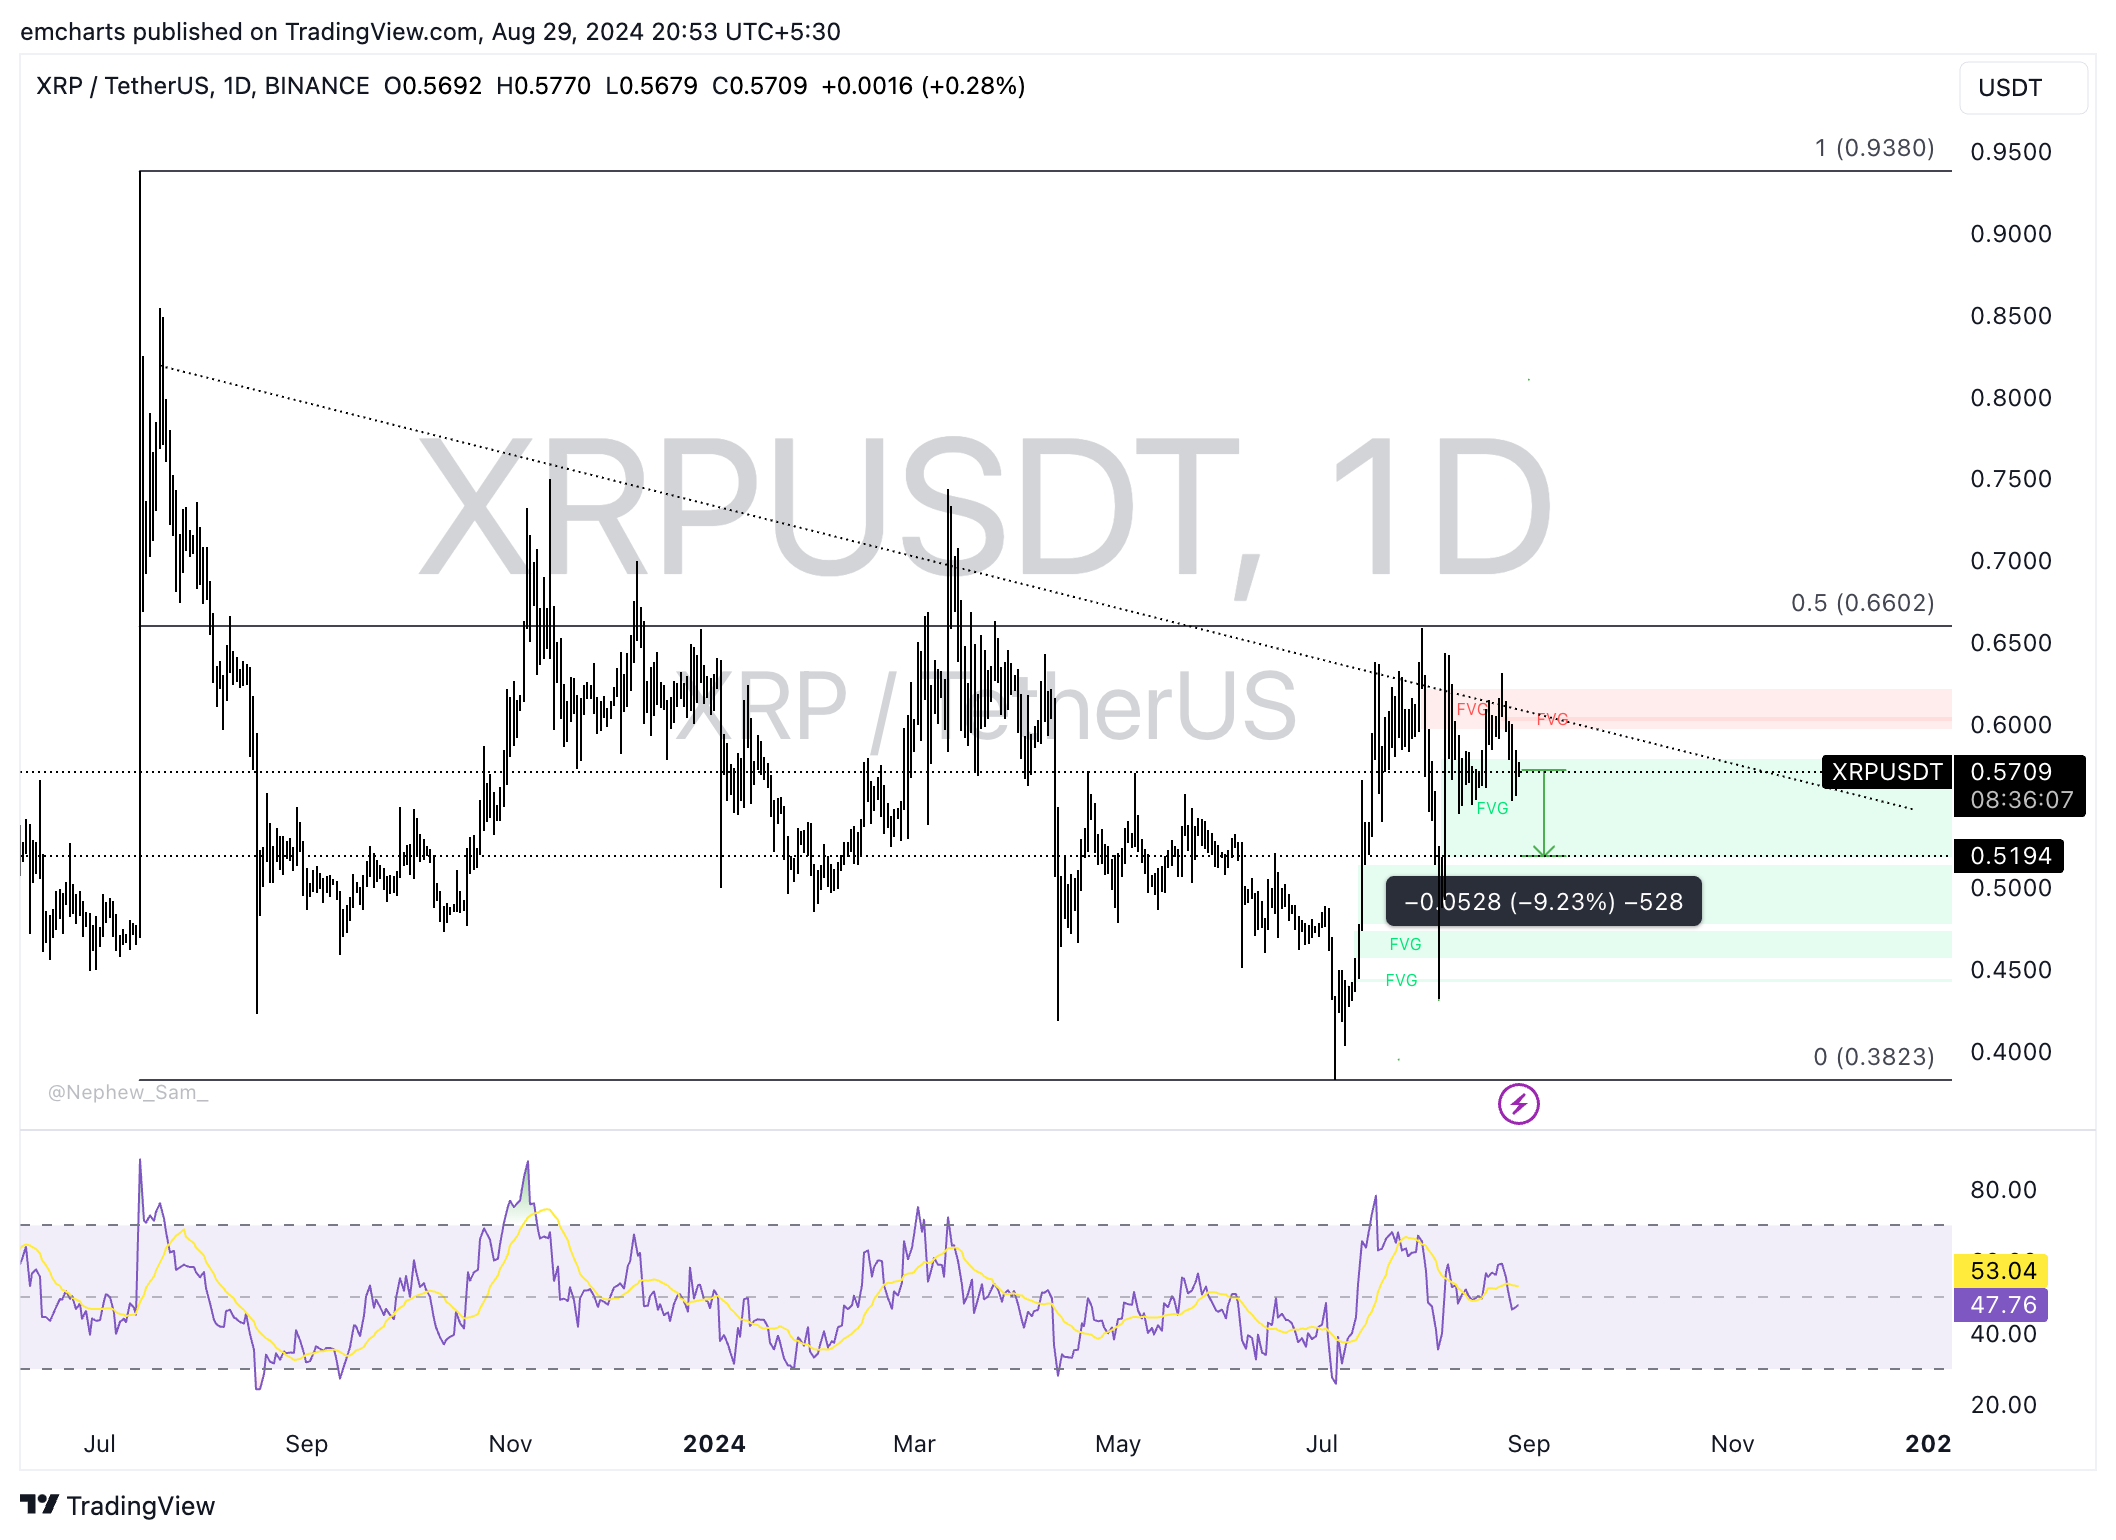
XRP/USDT daily chart
A daily candlestick close above $0.60 could invalidate the bearish thesis. In that case, XRP could rally toward $0.66, the 50% Fibonacci retracement level of the decline from the July 13 top of $0.9380 to the July 5 low of $0.3823.
Bitcoin, altcoins, stablecoins FAQs
Bitcoin is the largest cryptocurrency by market capitalization, a virtual currency designed to serve as money. This form of payment cannot be controlled by any one person, group, or entity, which eliminates the need for third-party participation during financial transactions.
Altcoins are any cryptocurrency apart from Bitcoin, but some also regard Ethereum as a non-altcoin because it is from these two cryptocurrencies that forking happens. If this is true, then Litecoin is the first altcoin, forked from the Bitcoin protocol and, therefore, an “improved” version of it.
Stablecoins are cryptocurrencies designed to have a stable price, with their value backed by a reserve of the asset it represents. To achieve this, the value of any one stablecoin is pegged to a commodity or financial instrument, such as the US Dollar (USD), with its supply regulated by an algorithm or demand. The main goal of stablecoins is to provide an on/off-ramp for investors willing to trade and invest in cryptocurrencies. Stablecoins also allow investors to store value since cryptocurrencies, in general, are subject to volatility.
Bitcoin dominance is the ratio of Bitcoin's market capitalization to the total market capitalization of all cryptocurrencies combined. It provides a clear picture of Bitcoin’s interest among investors. A high BTC dominance typically happens before and during a bull run, in which investors resort to investing in relatively stable and high market capitalization cryptocurrency like Bitcoin. A drop in BTC dominance usually means that investors are moving their capital and/or profits to altcoins in a quest for higher returns, which usually triggers an explosion of altcoin rallies.
추천 기사


