


Pi Network Price Forecast: PI sinks to record low of $0.0551 as bears dominate
- Pi Network extends losses, reaching a new all-time low of $0.0551 on Tuesday as selling pressure deepens.
- Derivatives positioning signals persistent bearish sentiment among PI traders.
- Technical indicators suggest continued downside risk, despite oversold conditions, which could trigger a short-term relief bounce.
Pi Network (PI) extends its losing streak, hitting a new all-time low of $0.0551 on Tuesday as bearish pressure intensifies. Weakening derivatives metrics suggest bears remain in control.
In addition, deteriorating technical indicators point to elevated downside risk, despite oversold conditions that could trigger a short-term relief bounce.
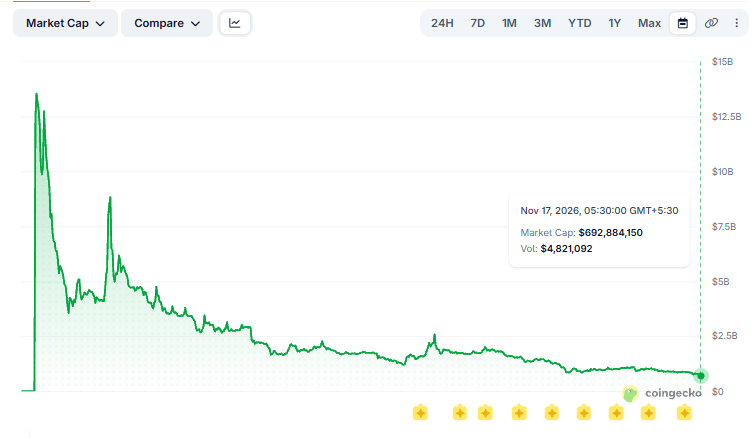
Hits a new all-time low and market cap drops below $700 million
Pi Network hits a new all-time low of $0.0551 on Tuesday, after falling over 20% since early November. In addition, PI has been in a broader downtrend since mid-May, with its market capitalization dropping below $700 million to around $692 million on Tuesday, as shown in the chart below.
Weakening derivatives and negative risk-adjusted returns
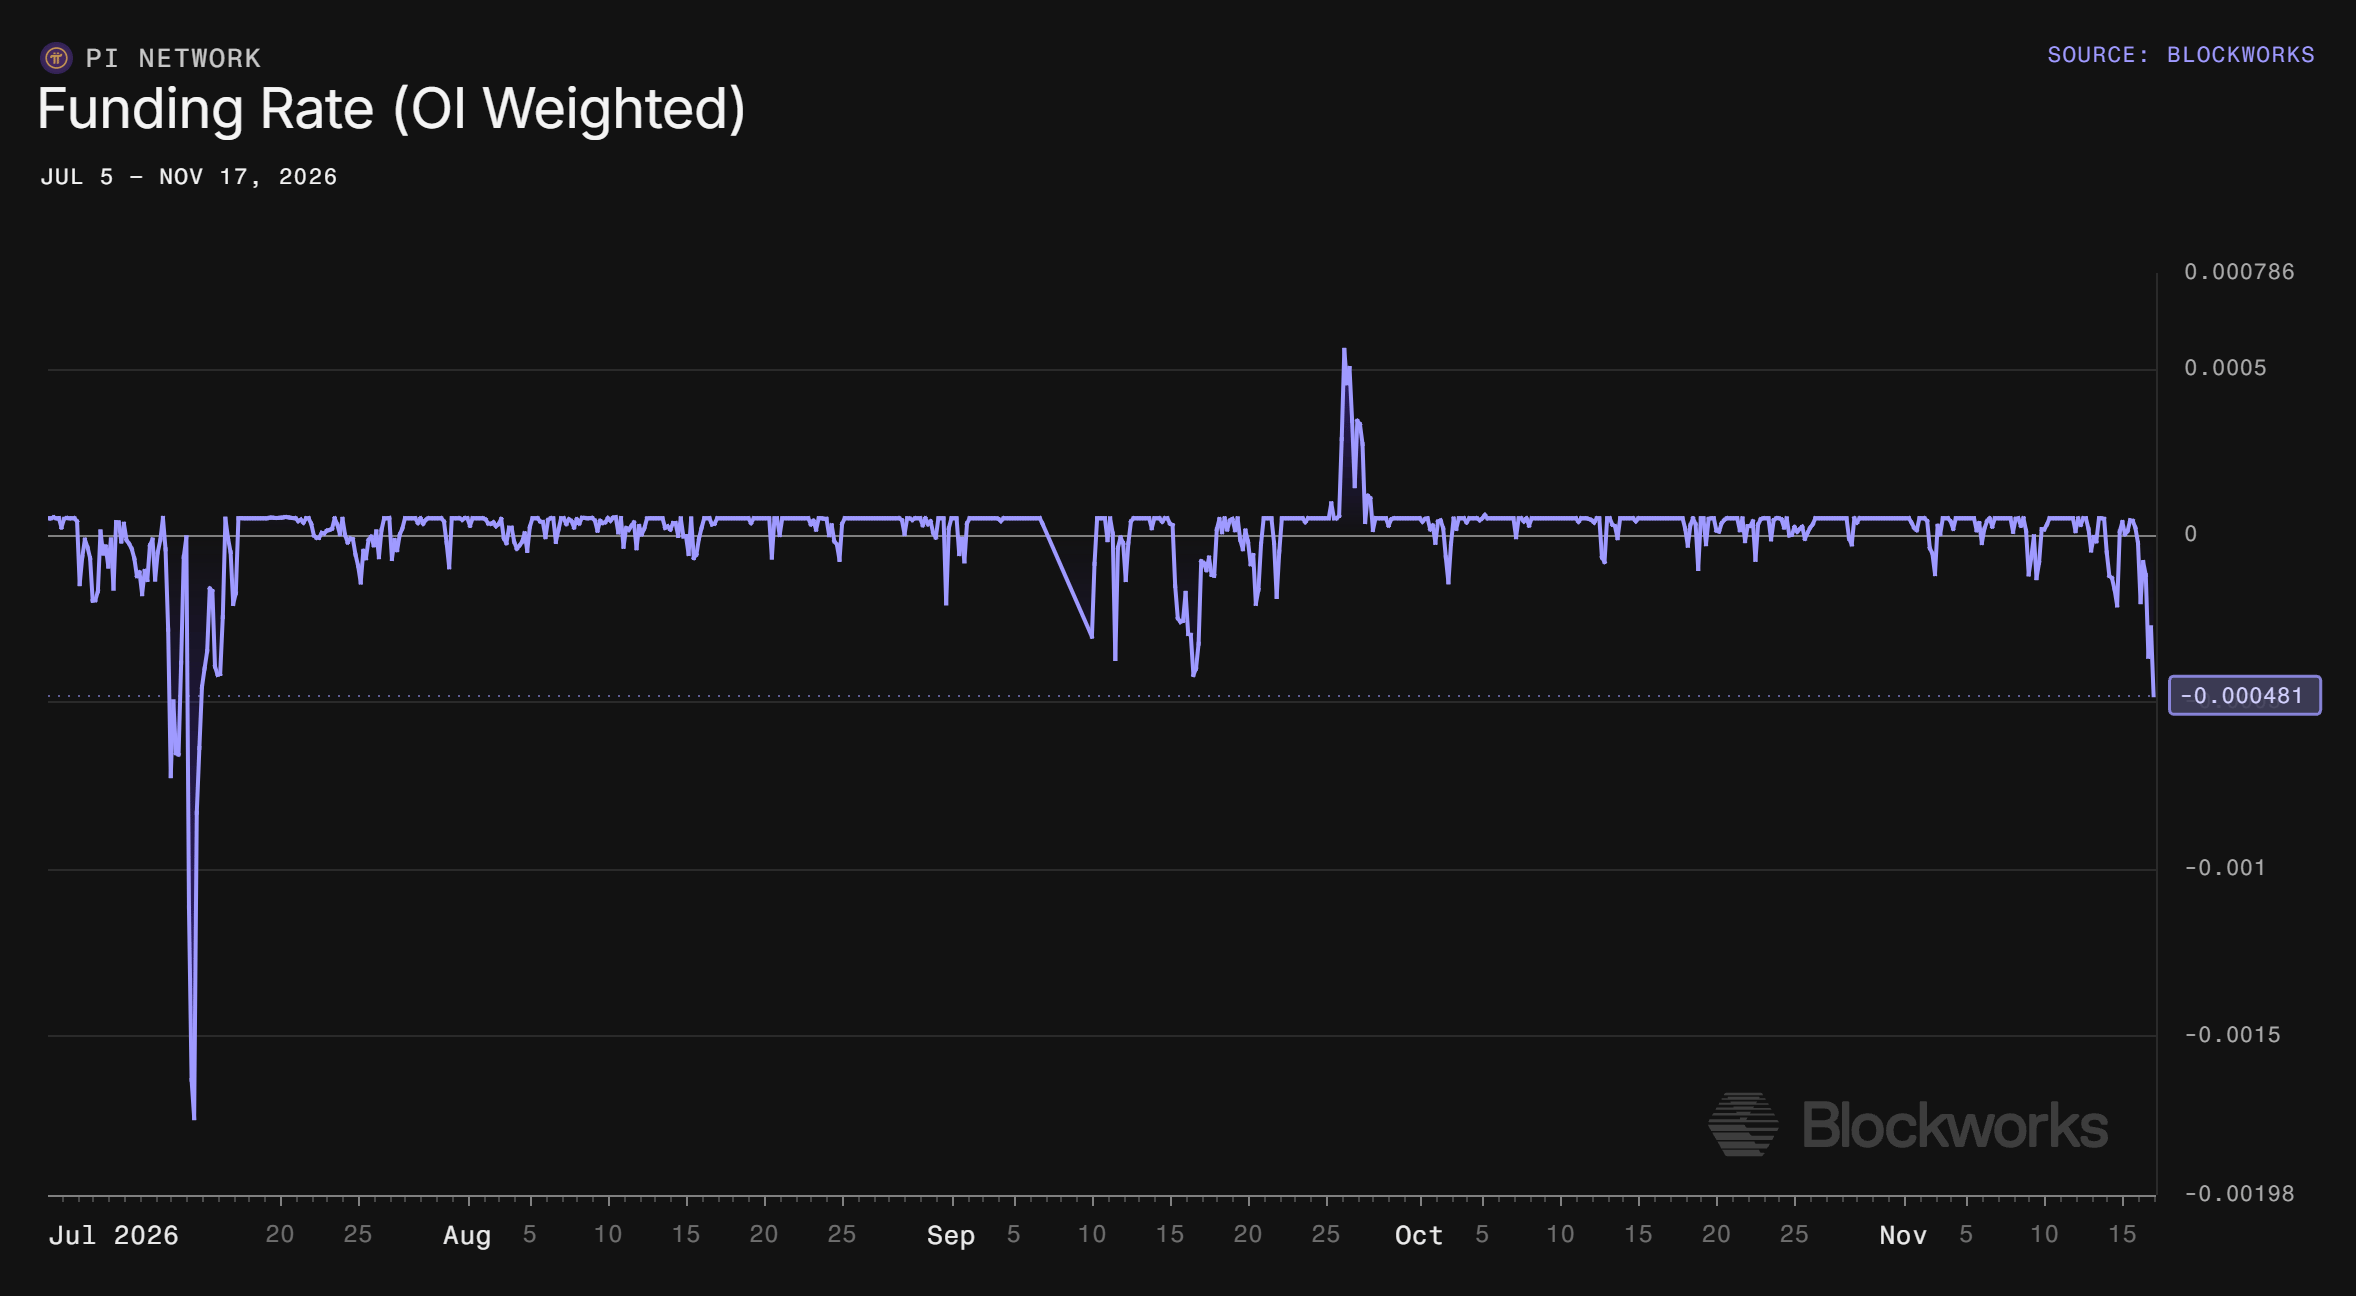
Derivatives positioning suggests bearish sentiment for Pi Network. The Blockworks chart below shows that PI's Open Interest (OI)-weighted funding rate turned negative on Monday, dropping to -0.00048% on Tuesday, indicating that shorts are paying longs and dominating perpetual futures positioning.
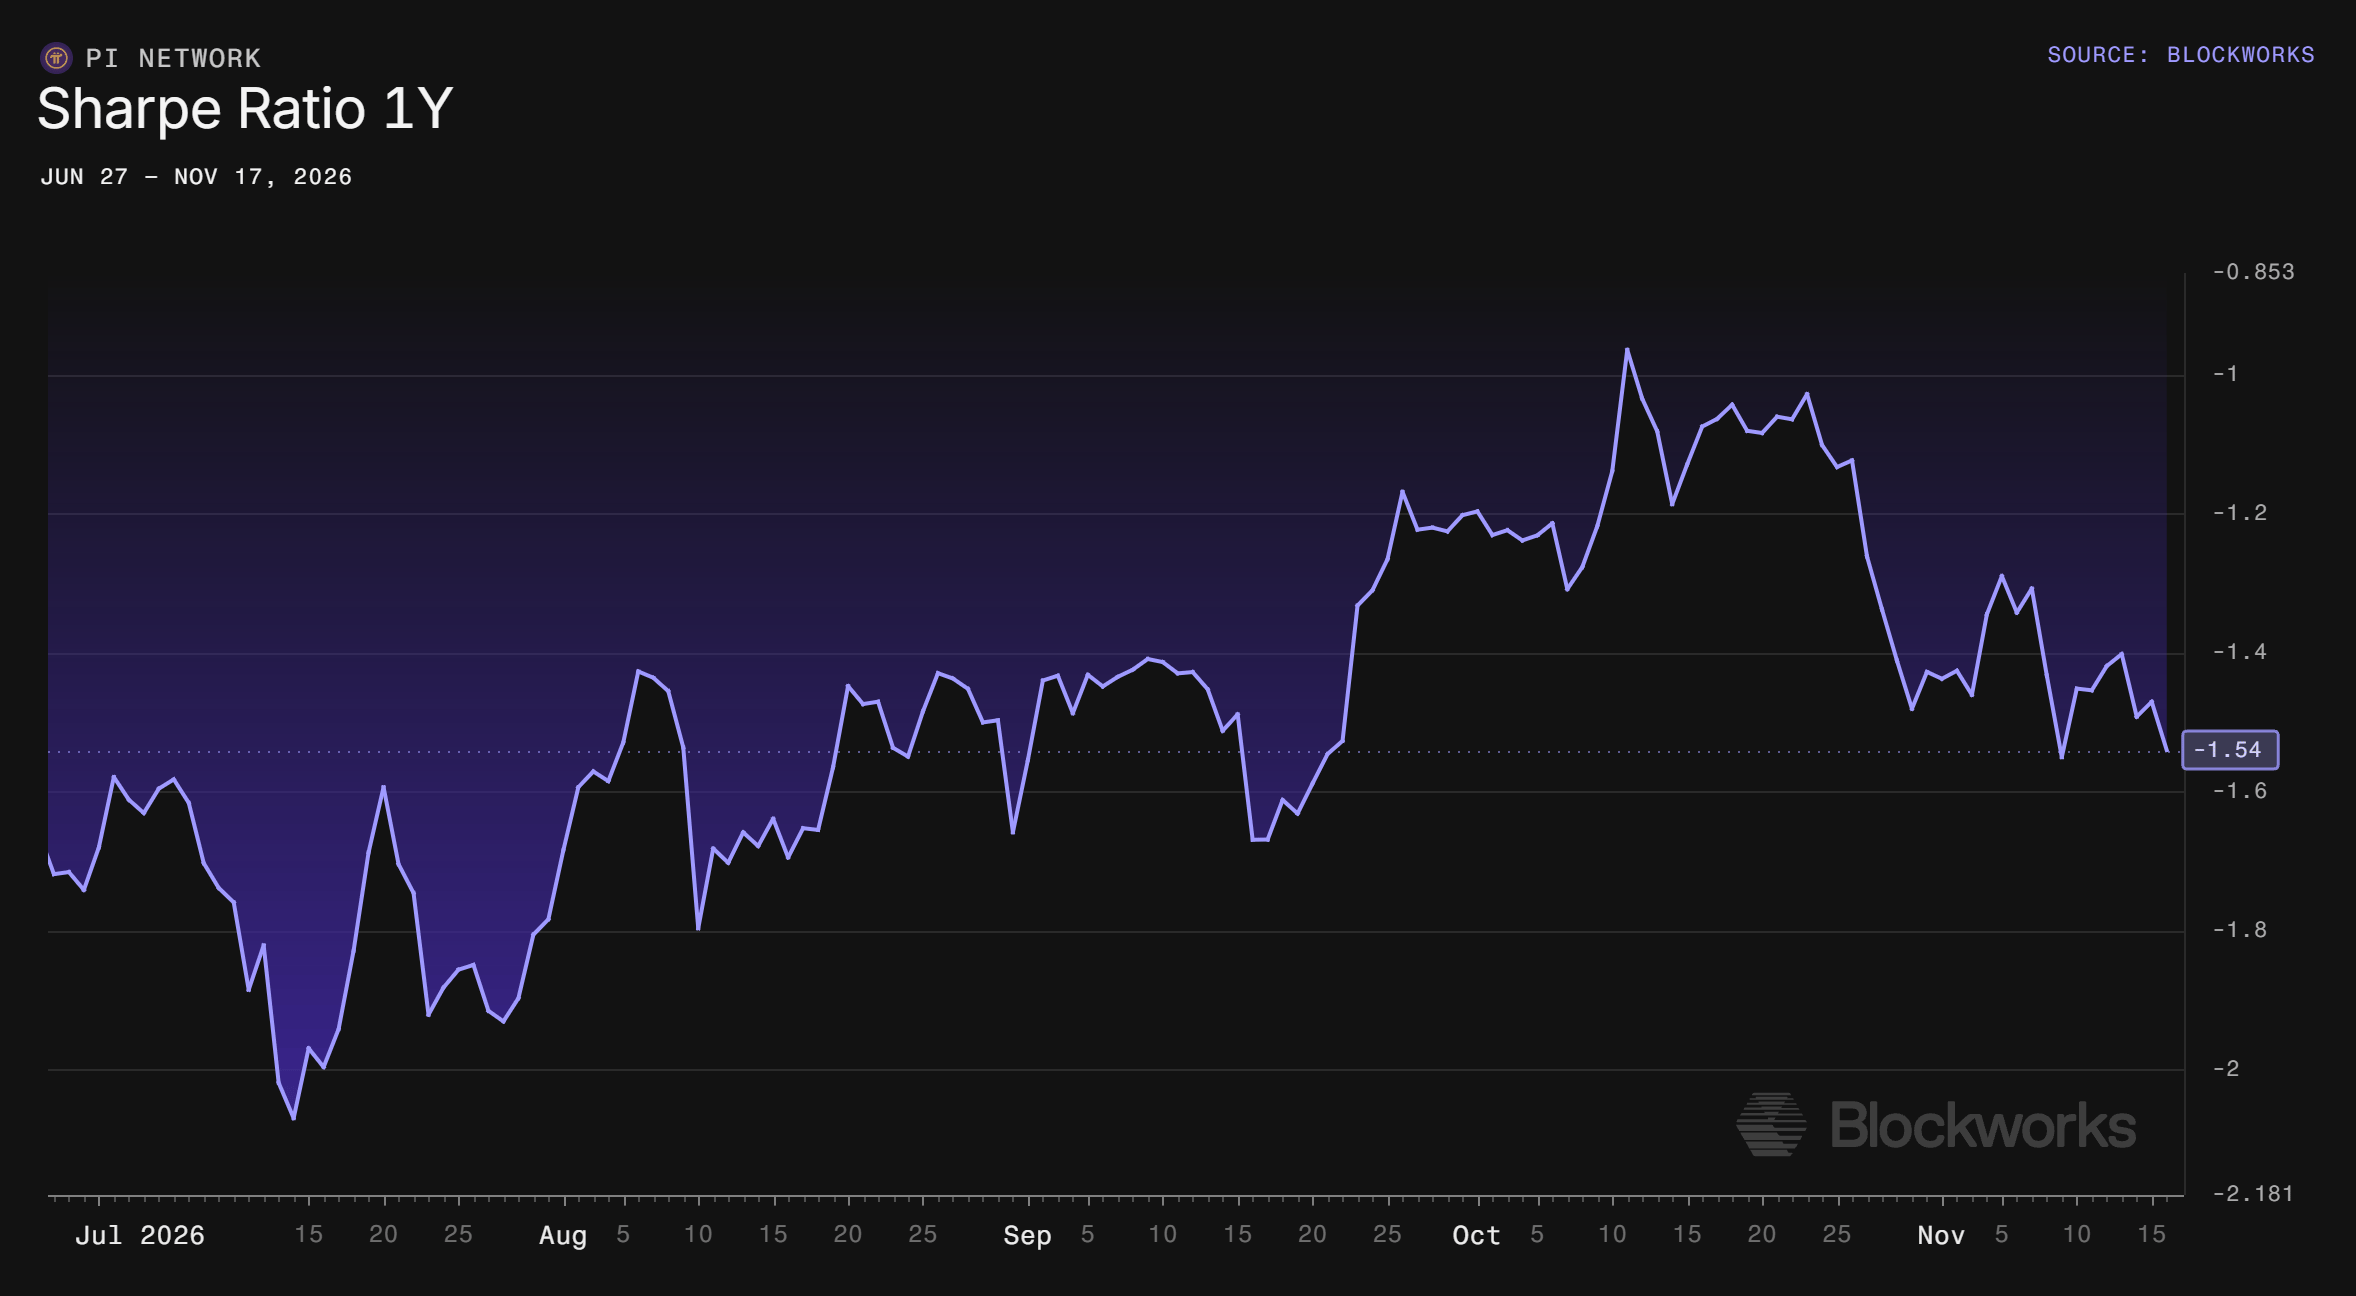
In addition, Pi Network's one-year Sharpe Ratio fell to -1.54 on Tuesday, indicating the altcoin has delivered negative risk-adjusted returns over the past year. The negative value suggests investors are finding it harder to justify holding PI amid persistent volatility and declining prices, which could further fuel ongoing selling pressure.
Pi Network technical outlook: Hits an all-time low
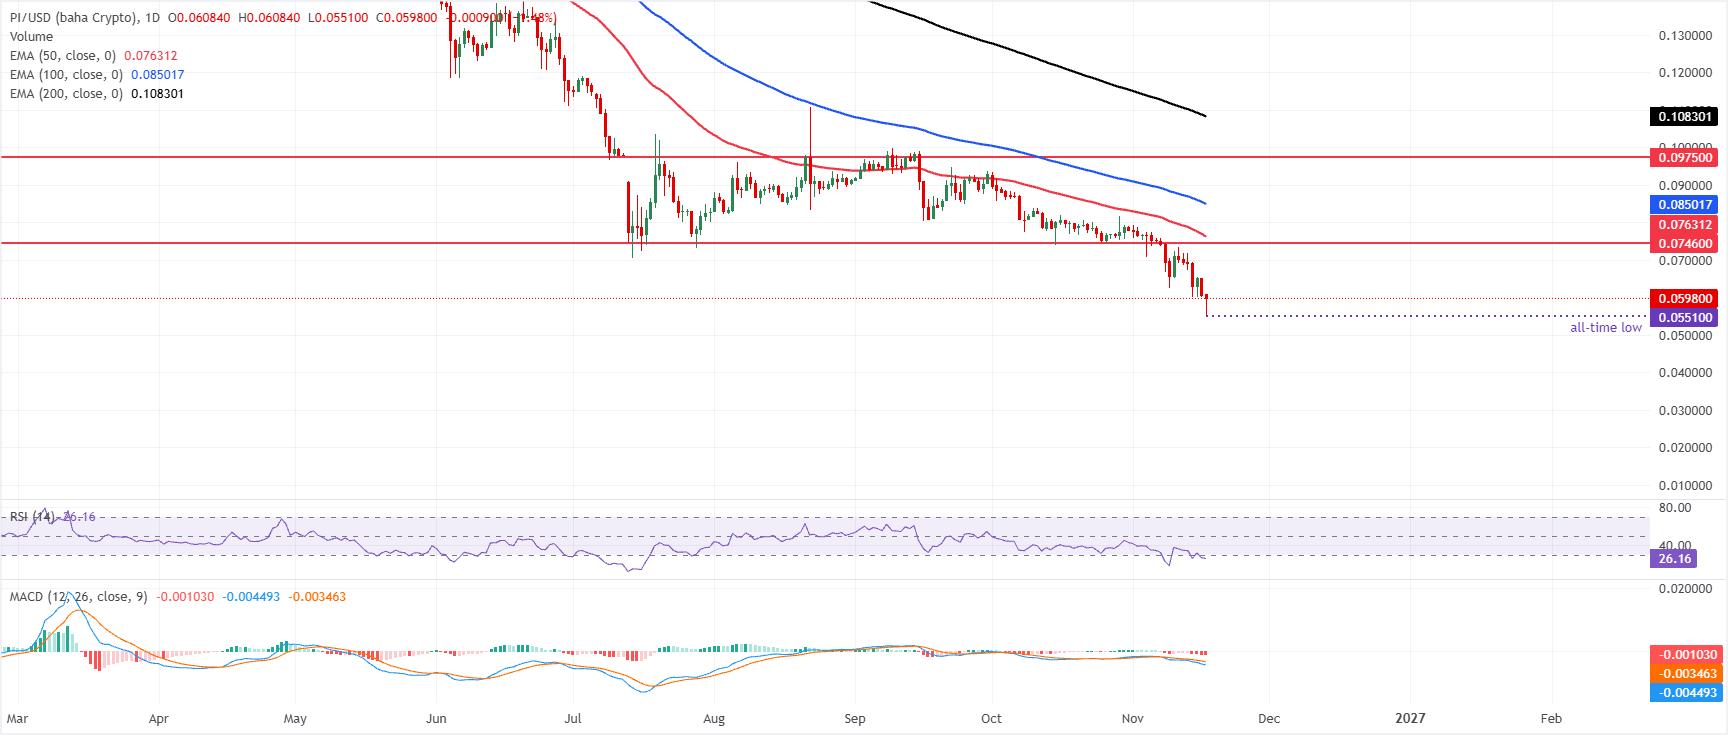
Pi Network price trades at $0.0600 on Tuesday after dropping to a new all-time low of $0.0551 during the early Asian trading session.
PI is extending a bearish near-term bias as it holds well below the 50-day, 100-day and 200-day Exponential Moving Averages (EMAs) at $0.0763, $0.0850 and $0.1083, respectively. This alignment of short- and long-term EMAs above the market suggests persistent downside pressure. At the same time, the Relative Strength Index (RSI) near 26 hints at oversold conditions, and the Moving Average Convergence Divergence (MACD) remains negative, reinforcing a still-weak underlying tone despite the possibility of a pause or minor bounce.
On the topside, initial resistance is seen at the horizontal barrier around $0.0746, followed closely by the 50-day EMA at $0.0763, forming an initial supply cluster before the 100-day EMA near $0.0850. Higher up, a secondary resistance band emerges at $0.0975, ahead of the 200-day EMA around $0.1083, which caps the broader bearish structure and would need to be reclaimed to ease the current downside outlook.
(The technical analysis of this story was written with the help of an AI tool. Know more.)
추천 기사


