


Ripple and Stellar outlook: XRP and XLM remain under pressure as bearish momentum persists
- XRP maintains a bearish near-term tone as it holds below key EMAs and trades below $1.30 on Tuesday.
- XLM remains under pressure, trading below $0.169 on Tuesday after a mild rebound the previous day.
- Mixed derivatives metrics and on-chain caution, along with weakening momentum, cap both altcoins.
Ripple (XRP) and Stellar (XLM) continue to remain under pressure, trading below $1.30 and $0.169, respectively, on Tuesday after a mild recovery the previous day. Both XRP and XLM remain below their key Exponential Moving Averages (EMAs), indicating bearish price action. Moreover, mixed derivatives metrics and cautious on-chain data are capping sustained recovery in XRP and XLM.
Mixed derivatives metrics cap rebound
Derivatives data shows weakening conditions for Ripple and Stellar. CoinGlass’ long-to-short ratios for XRP and XLM read 0.77 and 0.91, respectively, on Tuesday, nearing the lowest level over a month. A ratio below one indicates bearish sentiment, as traders bet that asset prices will fall.
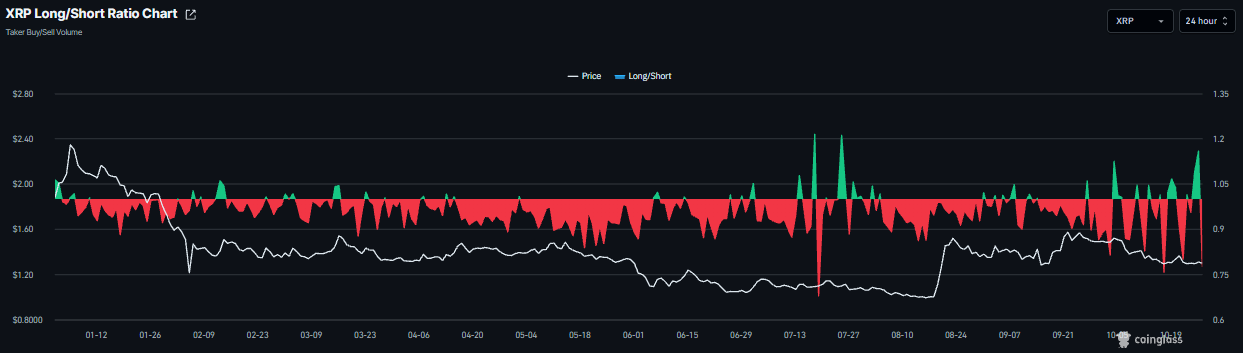
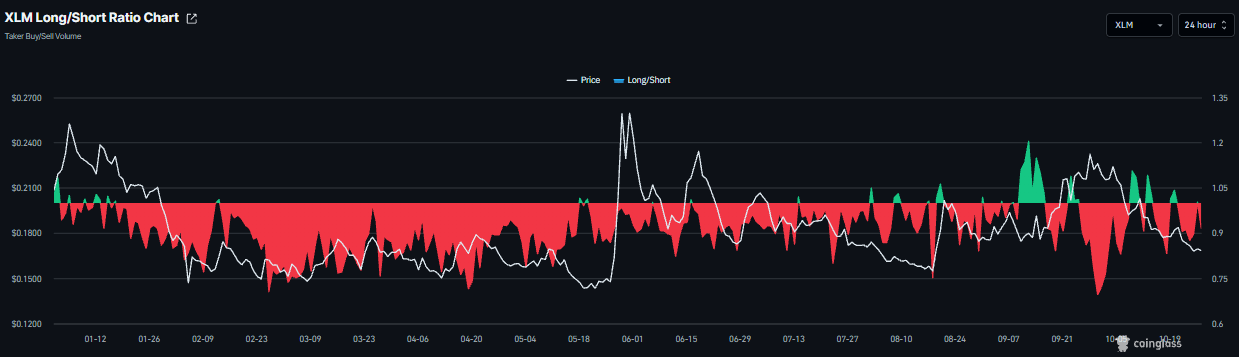
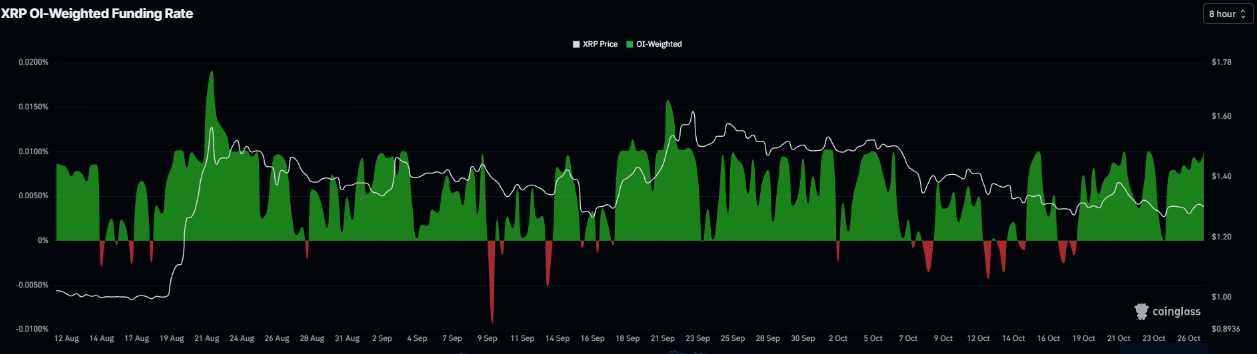
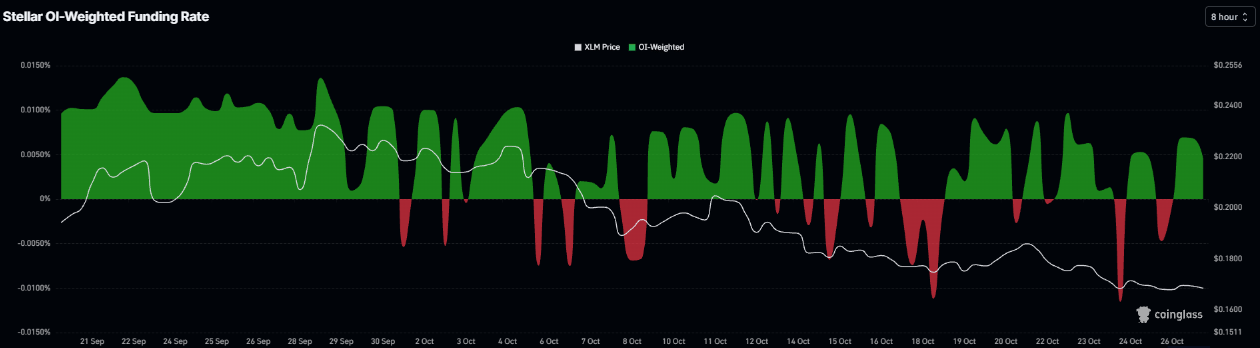
However, XRP and XLM funding rates flipped positive on October 16 and Monday, respectively, and read 0.0100% and 0.0045% on Tuesday, indicating that longs are paying shorts and suggesting a mildly bullish outlook.
These divergence between bearish positioning and positive funding rates suggests that broader derivatives sentiment remains cautious, capping sustained recovery in XRP and XLM.
On-chain data shows caution signs
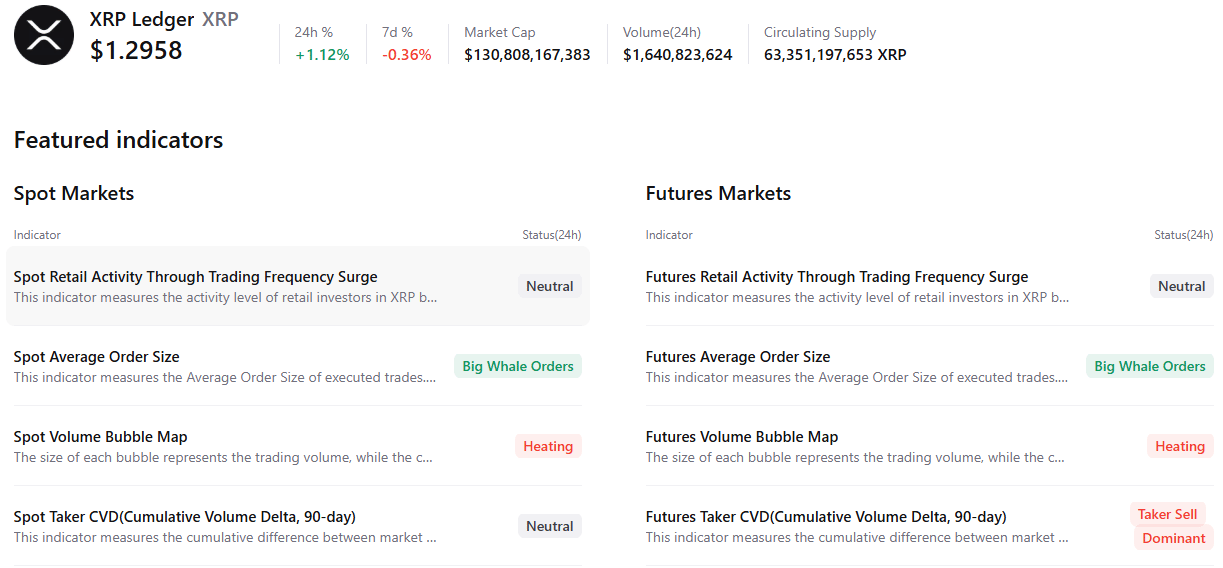
CryptoQuant’s summary data shows a bearish outlook for both altcoins. XRP’s spot and futures markets show large whale orders alongside heating conditions and sell-side dominance. These highlight a bearish, cautious sentiment bias among Ripple traders.
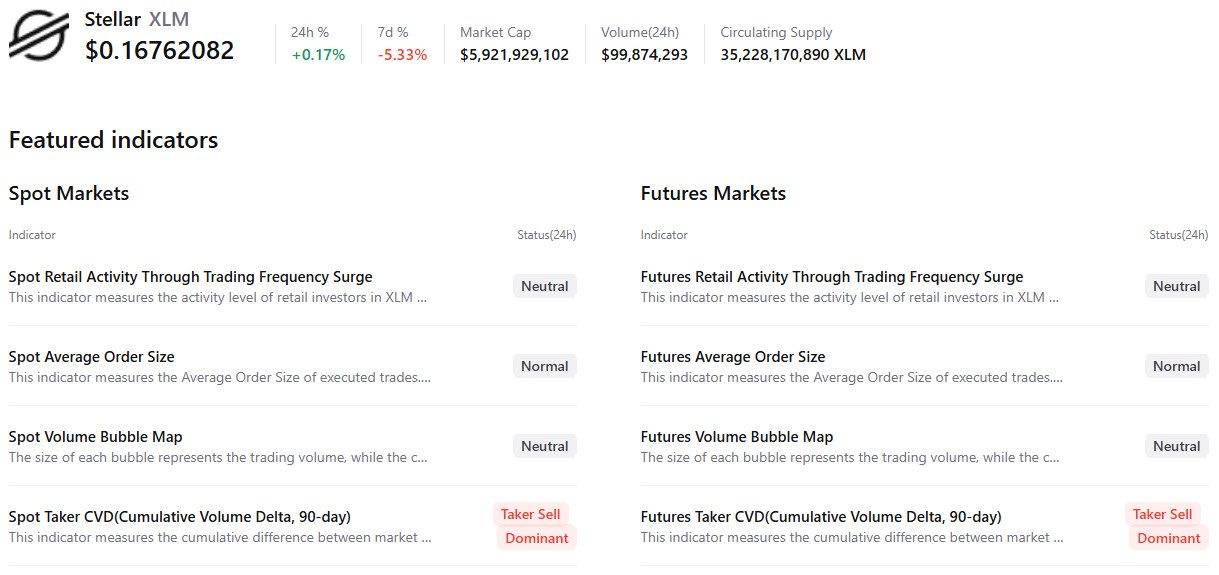
For XLM, spot and futures markets show sell-side dominance, indicating a negative outlook among Stellar traders.
Institutional demand weakens
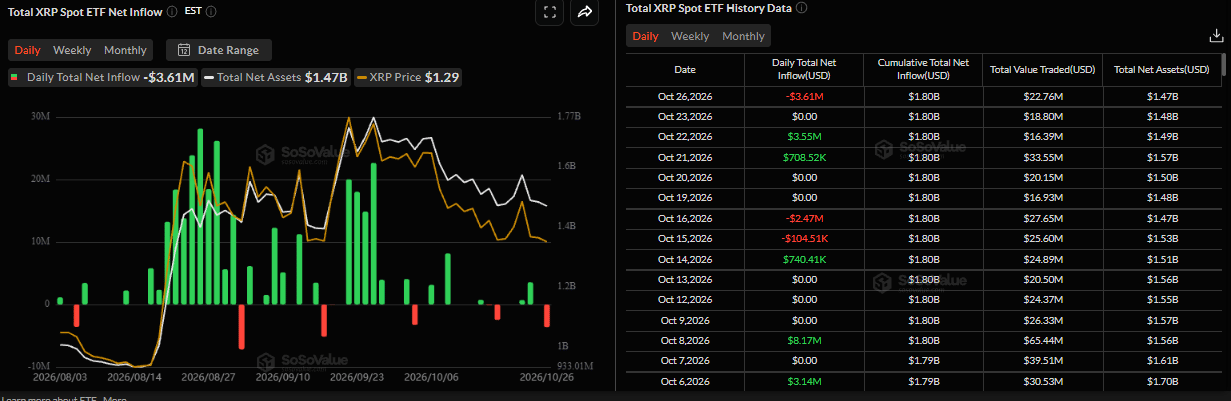
SoSoValue data shows that institutional demand for XRP started the week on a negative note, with spot Exchange Traded Funds (ETFs) recording an outflow of $3.61 million on Monday. If this outflow continues and intensifies throughout the week, XRP could extend a deeper correction.
XRP technical outlook: Capped below key EMAs
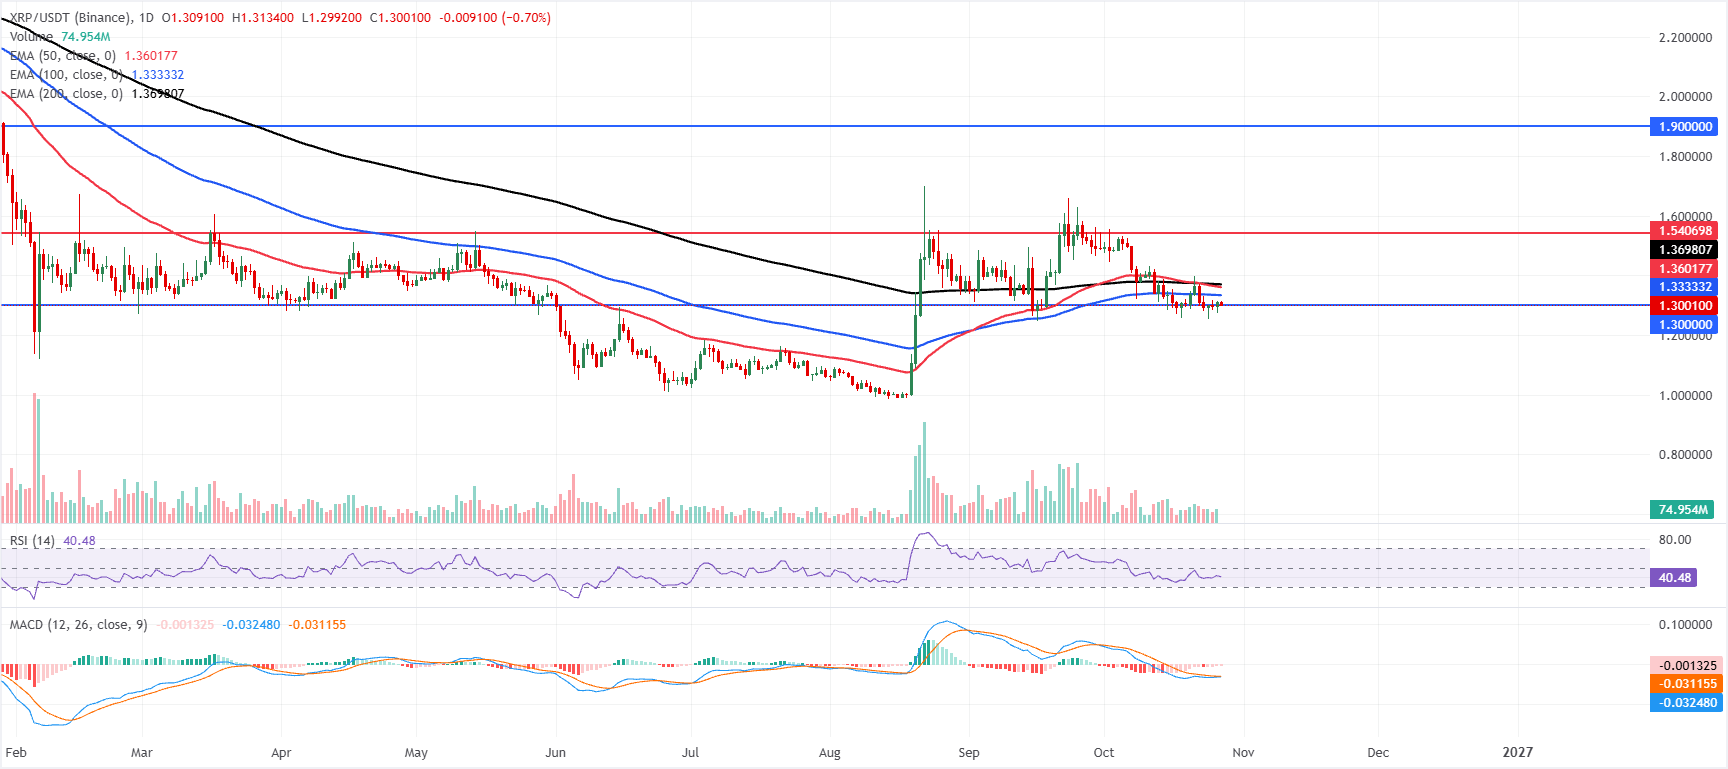
XRP trades at $1.300 on Tuesday, maintaining a bearish near-term tone as it holds beneath key Exponential Moving Averages (EMAs). The 100-day EMA at $1.333, the 50-day EMA at $1.360 and the 200-day EMA at $1.369 all sit overhead as layered dynamic resistance, suggesting rebounds are likely to be capped while the pair remains below this cluster.
Momentum is soft, with the Relative Strength Index (RSI) hovering near 40, and the Moving Average Convergence Divergence (MACD) still in negative territory, though its recent improvement hints at waning downside pressure rather than a clear bullish shift.
On the topside, immediate resistance is at the 100-day EMA at $1.333, followed by the 50-day EMA at $1.360 and the 200-day EMA at $1.369; higher up, horizontal barriers sit at $1.540 and then $1.900.
On the downside, nearby support aligns with the horizontal floor at $1.300, just below the current price, where buyers may try to defend the recent range; a decisive break below this level would likely expose further weakness, keeping XRP anchored in its broader corrective phase.
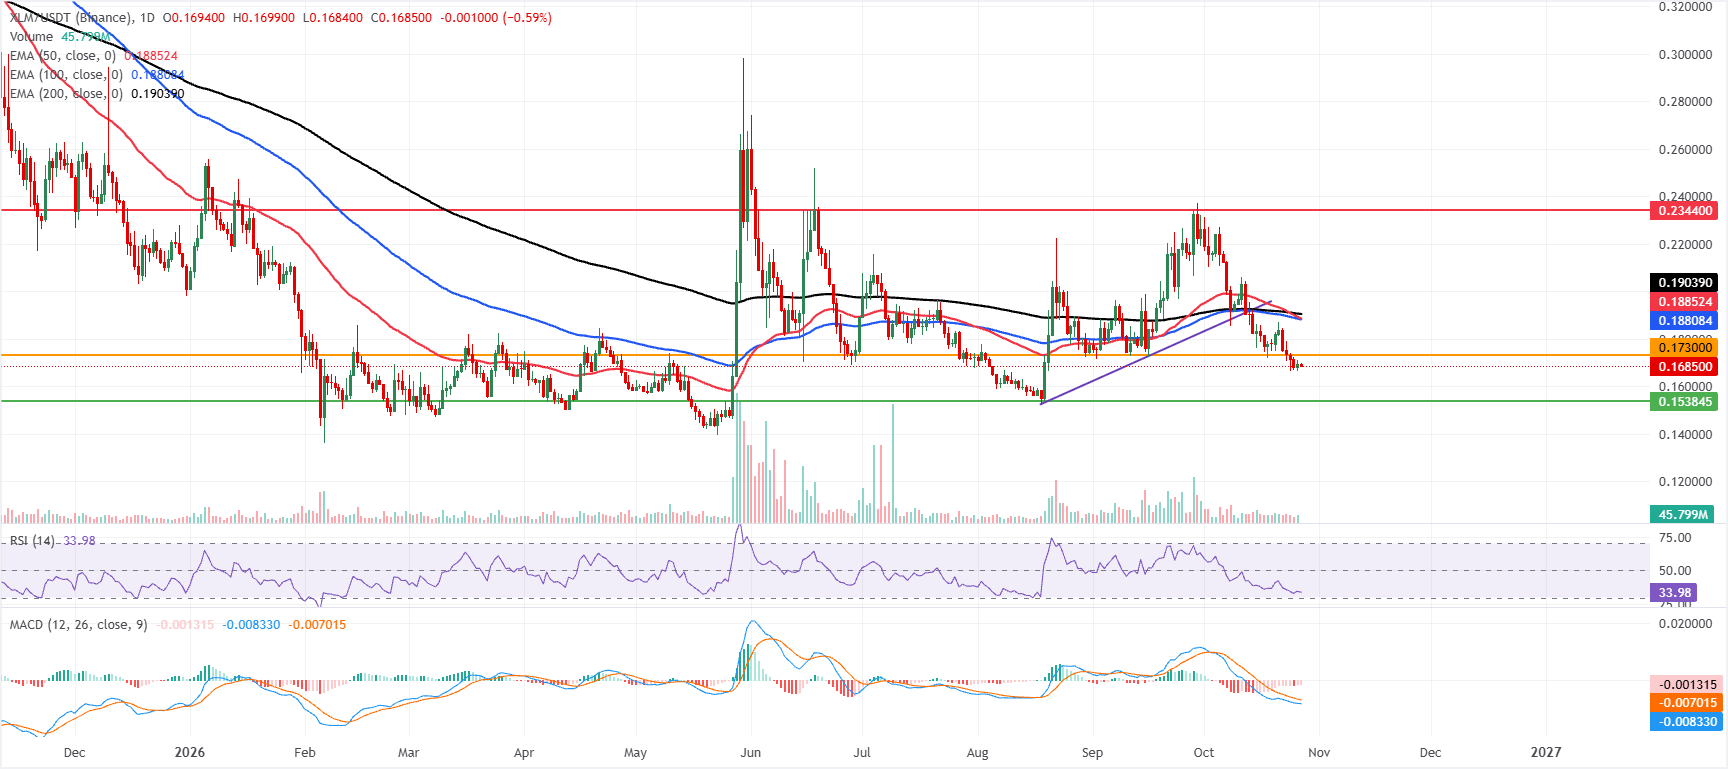
XLM technical outlook: Bears in control of momentum
XLM price trades at $0.168 on Tuesday, extending its pullback below all key EMAs and maintaining a bearish near-term bias. The 50-day, 100-day and 200-day EMAs clustered between roughly $0.188 and $0.190 sit overhead as a dense cap, suggesting rallies would struggle while price remains beneath this group.
Daily RSI near 34 leans toward oversold territory, while the MACD stays negative but mildly improves, hinting at slowing downside momentum rather than a confirmed bottom.
On the topside, initial resistance emerges at the horizontal barrier near $0.173, ahead of the EMA cluster around $0.188–$0.190, which reinforces the broader bearish structure.
Above that, the former rising trendline support turned resistance around $0.201 and the higher horizontal level at $0.234 mark subsequent caps if buyers attempt a deeper recovery.
On the downside, immediate support is located at the prior floor around $0.153; a sustained break below this level would open the way for another leg lower despite the increasingly stretched momentum readings.
(The technical analysis of this story was written with the help of an AI tool. Know more.)
추천 기사


